Interactive map to our city's future under the sea. Type in your zip code to see the flood risks of from rising sea levels and storms near you.
From Spatial Sustain
A new online site called Surging Seas from Climate Central maps the impact of climate change and sea level rise in coastal areas of the United States.
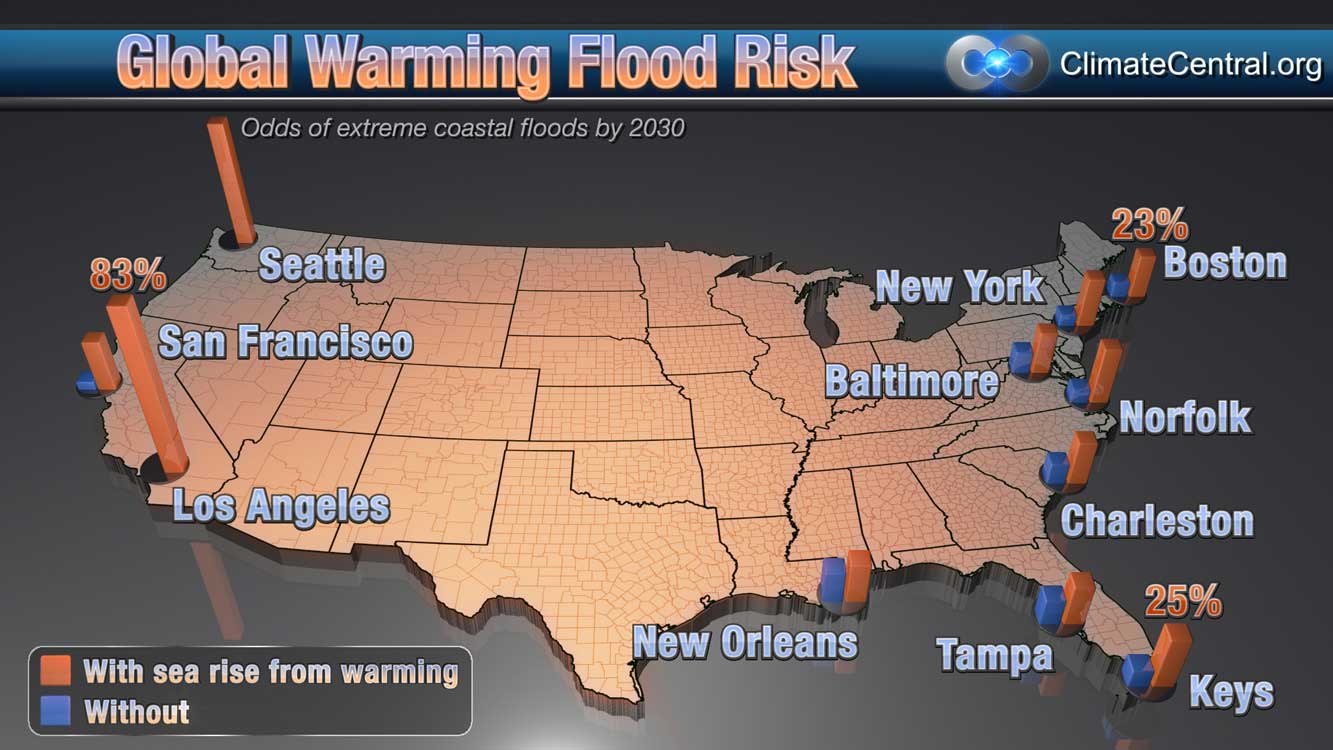 This map shows the odds of floods at least as high as historic once-a-century levels, occurring by 2030, based on Climate Central research.
The two bars extending from each study point contrast odds estimates incorporating past and projected sea level rise from global warming (red bars), and odds estimates not incorporating this rise (blue bars).
The century flood heights used for reference in these calculations are based on historic records, and expressed relative to sea level in 2009 to account for continually rising seas.
The online and interactive map displays the potential impacts of 2 to 7 more feet of sea level rise that is possible this century, which will impact the nearly 5 million people that live at less than 4 feet above high tide.
The map accompanies a report that looks at the impact of sea level rise and the risk from storm surges, with an estimate of the land, housing and population that are vulnerable.
The map accompanies a report that looks at the impact of sea level rise and the risk from storm surges, with an estimate of the land, housing and population that are vulnerable.

A few shocking statistics from the report include:
- In 285 municipalities, more than half the population lives below the 4-foot mark
- In 676 towns and cities more than 10% of the population lives below the 4-foot mark

Links :
- LiveScience : 4 Million Americans threatened by rising seas
- NYTimes : Rising sea levels seen as threat to coastal U.S.
No comments:
Post a Comment