Saturday, October 15, 2022

Rocking the Isles of Scilly


From NASA
 
An astronaut aboard the International Space Station (ISS) shot this photograph that captures a some of the essence of tidal features around the Isles of Scilly, an archipelago located just southwest of Cornwall, England.
The archipelago includes nearly 150 islands in the Celtic Sea, of which five are inhabited. Pictured are St. Mary’s, Tresco, St. Martin’s, Bryher, and St. Agnes—the largest islands in the chain.
Some of the coastal waters surrounding the islands have a bright turquoise hue, indicating the presence of shallow reefs and shoals.
 
Nautical raster chart (UKHO) with the GeoGarage platfrom
 
Deeper waters have richer blue hues.
This photo also captures swell patterns caused by waves that intersect one another as they move around the islands due to the westerly sea breeze.
The Isles of Scilly are remnants of the underlying Cornubian Batholith—a mass of ancient volcanic rock (a plutonic intrusion) that formed the Cornish Peninsula.
This intrusion originated with the crystallization of magma into igneous rock approximately 290 million years ago.
It now sits an estimated 10 kilometers (6 miles) below the surface.
Tides ebb and flow throughout the year and, at their lowest, can expose sandbars that allow people to walk between some islands.
Low tides also can expose large rocks along the shore that are used by gray seals to bask in the sun.
And bottlenose dolphins migrate with the tidal cycles here—most notably during high tides— in search of fish to feed on.
 
Links :

Friday, October 14, 2022

Surveying the Tonga volcano eruption aftermath

A detailed look at the undersea impact
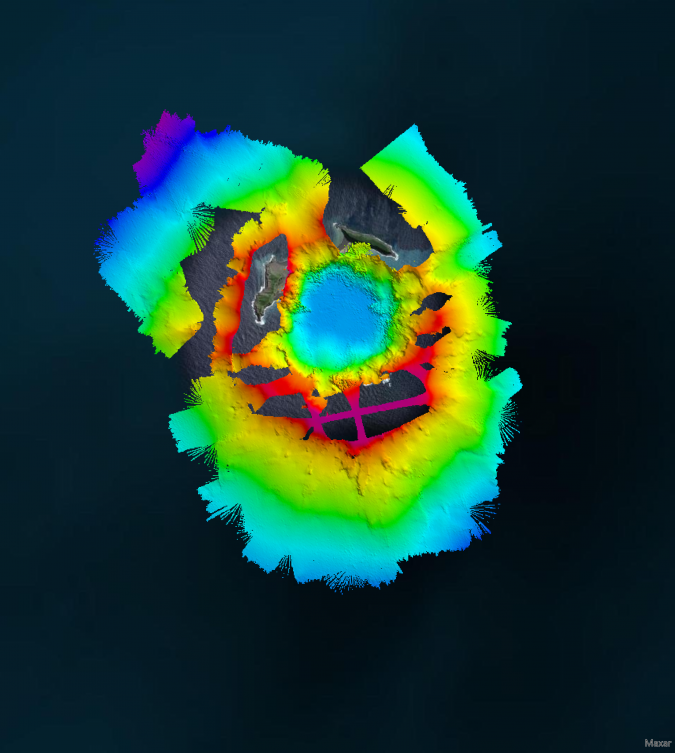
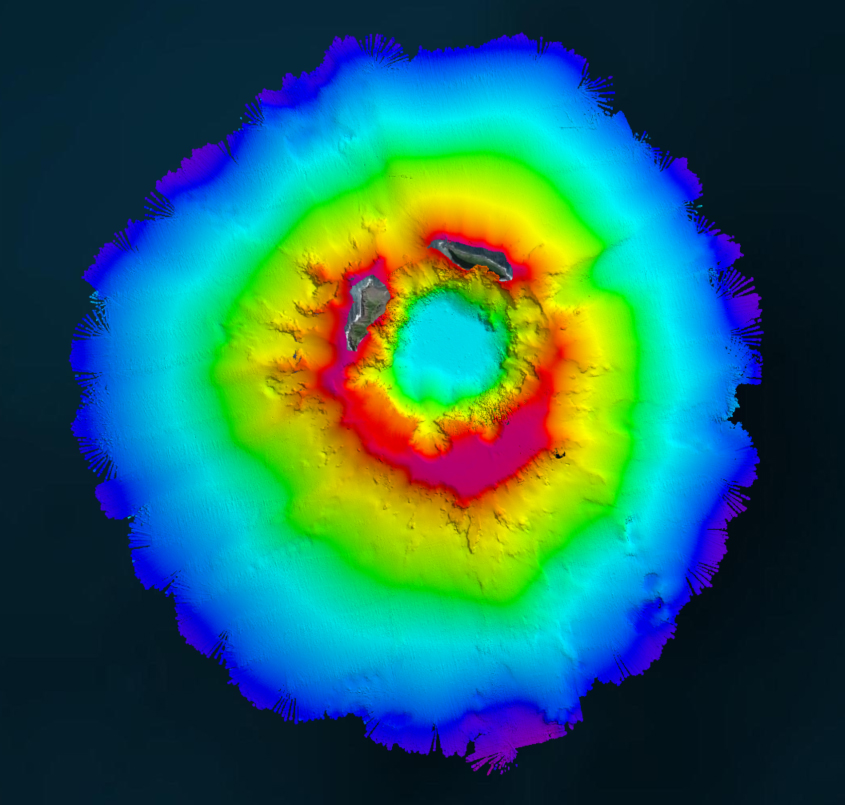
Aerial view of the Hunga-Tonga Hunga-Ha’apai (HT-HH) volcano.
(Image courtesy: SEA-KIT NIWA-Nippon Foundation TESMaP survey team) 

From Hydro by Ben Simpson & Jamie McMichaƫl-Phillips

The Tonga Eruption Seabed Mapping Project (TESMaP) is a collaborative mission to discover the undersea impacts of the January 2022 eruption of the Hunga-Tonga Hunga-Ha’apai volcano.
Using their collective knowledge, experience and resources, New Zealand’s National Institute of Water and Atmospheric Research (NIWA) and The Nippon Foundation of Japan hope to understand what happened, how much material was displaced and what shape the volcano was left in.
This information will help to improve tsunami forecasting and better predict the blast effects of subsea volcanoes, which in turn will help to protect people from similar natural disasters in the future.

On 15 January 2022, a South Pacific nation with just over 104,000 residents witnessed the unexpected and unprecedented eruption of the Hunga-Tonga Hunga-Ha’apai (HT–HH) volcano.
The immediate impact had catastrophic consequences for Tonga’s nearby islands.
The main island of Tongatapu was carpeted in toxic ash and a sonic boom travelled around the globe.
The shape of the seabed greatly influenced the speed and size of the resulting tsunami; death and damage were recorded as far away as South America, and waves hit Australia, New Zealand and Japan, even touching the shores of California, Alaska and Chile.
It also severed the submarine fibre-optic cables connecting Tonga with the world, leaving the country in a prolonged blackout.

In April 2022, New Zealand’s National Institute of Water and Atmospheric Research (NIWA) and The Nippon Foundation of Japan announced a collaborative mission to discover the undersea impacts of the explosion, using their collective knowledge, experience and resources to build a detailed and invaluable picture of the eruption’s aftermath below the ocean’s surface.
The Tonga Eruption Seabed Mapping Project (TESMaP) is funded by The Nippon Foundation and supported by The Nippon Foundation-GEBCO Seabed 2030 Project, which aims to map the world’s entire ocean floor by 2030 and to deliver this information via a freely available definitive map.

Modelling Future Eruptions

Around 680 million people currently live in coastal areas, and this figure is expected to increase to one billion in less than 30 years’ time.
These coastal communities face the growing threat of storm surges and tsunamis that can wash away entire neighbourhoods and endanger lives in a matter of minutes.
Since there are numerous similar volcanos around the globe, particularly along the Pacific Ring of Fire, the eruption of HT–HH highlights a critical risk to society, exacerbated by a lack of knowledge.
Through detailed research and surveys, expanding the collective knowledge of the undersea topography is vital to understanding what happened, how much material was displaced and what shape the volcano was left in.
This information makes it possible to improve tsunami forecasting and better predict the blast effects of subsea volcanoes, which in turn will help to protect people from similar natural disasters in the future.

Phase one of TESMaP, which took place between April and May, saw NIWA scientists on board the research vessel RV Tangaroa survey the ocean around HT–HH, covering thousands of square kilometres and collecting video images of the eruption’s impact.
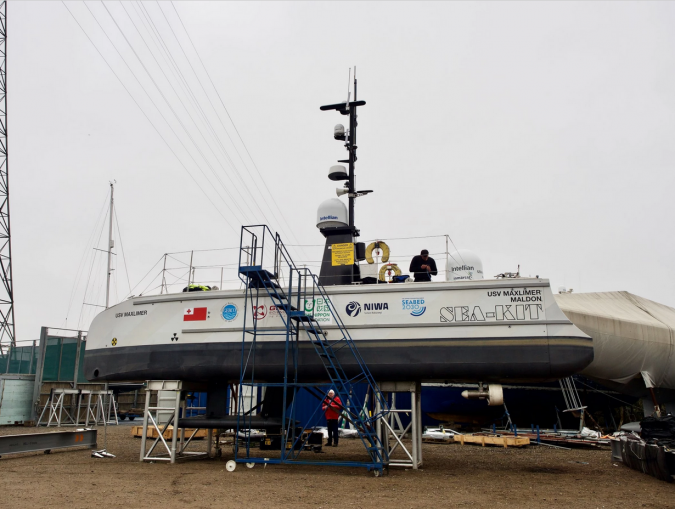
Phase two, which took place between July and August, utilized SEA-KIT International’s 12m uncrewed surface vessel (USV) Maxlimer to conduct a month of further mapping inside the caldera.
This research – conducted in an area which could not be surveyed by NIWA due to safety reasons – will prove crucial to the overall findings of the project.

SEA-KIT USV Maxlimer getting prepared for despatch to Tonga.

Displaced Material

Due to the sheer magnitude of the explosion, dramatic changes to the volcano were to be expected.
But instead, researchers on board RV Tangaroa for the month-long expedition were amazed to find it still largely intact.
NIWA scientists mapped a total of 22,000km2 of the surrounding seafloor and observed changes covering an area of 8,000km2.
They recorded up to seven cubic kilometres of displaced material – enough to fill three million Olympic-sized swimming pools.
Tonga’s severed domestic internet cable was buried under 30m of ash and sediment, and scientists found sandy mud and deep ash ripples as far as 50km away from the volcano.

Ecosystem Impacts

The impacts on the ecosystem were also examined.
The volcano was devoid of biology, but remarkably there were features as close as 15km away that still had abundant and diverse populations of marine life.
Surrounding seamounts had pockets of normal biodiversity, such as corals, sponges, starfish and mussels, indicating the resilience of such marine ecosystems and giving scientists a baseline for monitoring recovery in the future.
Preliminary water column data showed that it is still recovering, with some airborne ash yet to completely settle on the seafloor.
There is also evidence to suggest the volcano may still be erupting, with a dense ash layer found in the upper water column near the site.

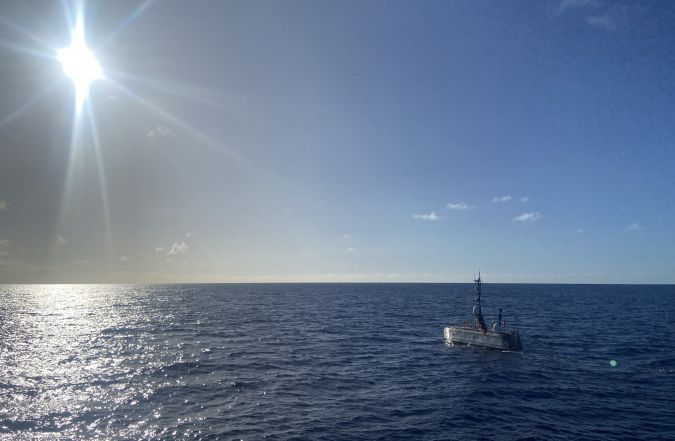
USV Maxlimer in Tonga.
Mapping the Gaps with USV


As part of phase two, USV Maxlimer mapped the current shape of the caldera and measured environmental conditions of the water above it, all whilst being controlled remotely from SEA-KIT’s base in the UK, some 16,000km away.
The use of USV Maxlimer as a configurable platform for a range of sensors provided a unique opportunity to gather data safely and continuously from inside the caldera over a full month.
During the mission, USV Maxlimer used just 100 litres of fuel per day, which is under 2% of the fuel consumption of a typical survey vessel.
In addition to reducing the risk to people, deployment of a USV for survey inside the caldera ensures carbon emissions for the project remain low.

This was the first time that a USV had been used for this type of mission and demonstrated how the technology is pioneering new ways of understanding our oceans.
Maxlimer, the first SEA-KIT X-class USV, is the company’s testing and development vessel.
She was part of the winning Nippon Foundation-GEBCO alumni entry in 2019’s Shell Ocean Discovery XPRIZE and has since achieved numerous ‘firsts’, including the first uncrewed offshore pipeline inspection and first international commercial uncrewed transit in 2019.
The USV also completed 22 days of remote survey operations on Europe’s continental margin in 2020, mapping over 1,000km2 of ocean floor.

Real-time Data Collection

Sensors on board collected bathymetric data, water column backscatter data, sound velocity, conductivity, temperature, turbidity, oxidation reduction, pressure with depth and current data, all of which will develop and support understanding of the eruption’s undersea impact and ongoing activity.
The USV used newly fitted winch capability for sensor dips and tows to gather water column data as far down as 300m and provide a closer look at the suspended sediment layer.
This collection of oceanographic data will help to identify layers of geothermal activity as well as the change in salinity and dissolved particles, and will be used for comparison studies against samples gathered outside the caldera by RV Tangaroa.

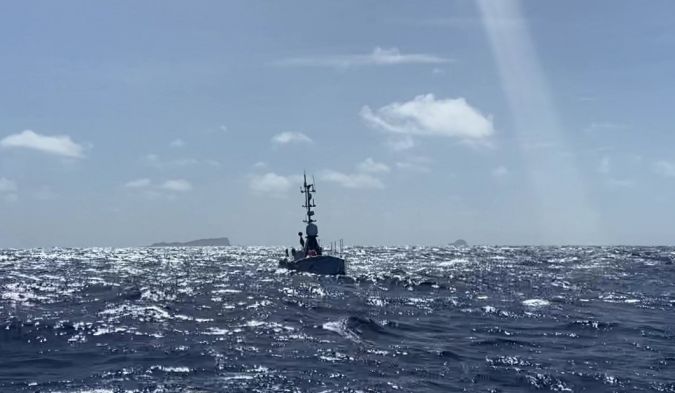
Maxlimer, together with three members of the SEA-KIT team, was based in Nuku’alofa, Tonga for around 40 days.
During this time, the vessel was also available for use for environmental surveys ahead of possible new cable lays to reconnect the islands, as well as for the mapping of other volcanoes in the area and generating change maps from previous eruptions.

SEA-KIT USV Maxlimer returning from HT-HH caldera in Tonga.
 
Links :

Thursday, October 13, 2022

River deltas are running out of land

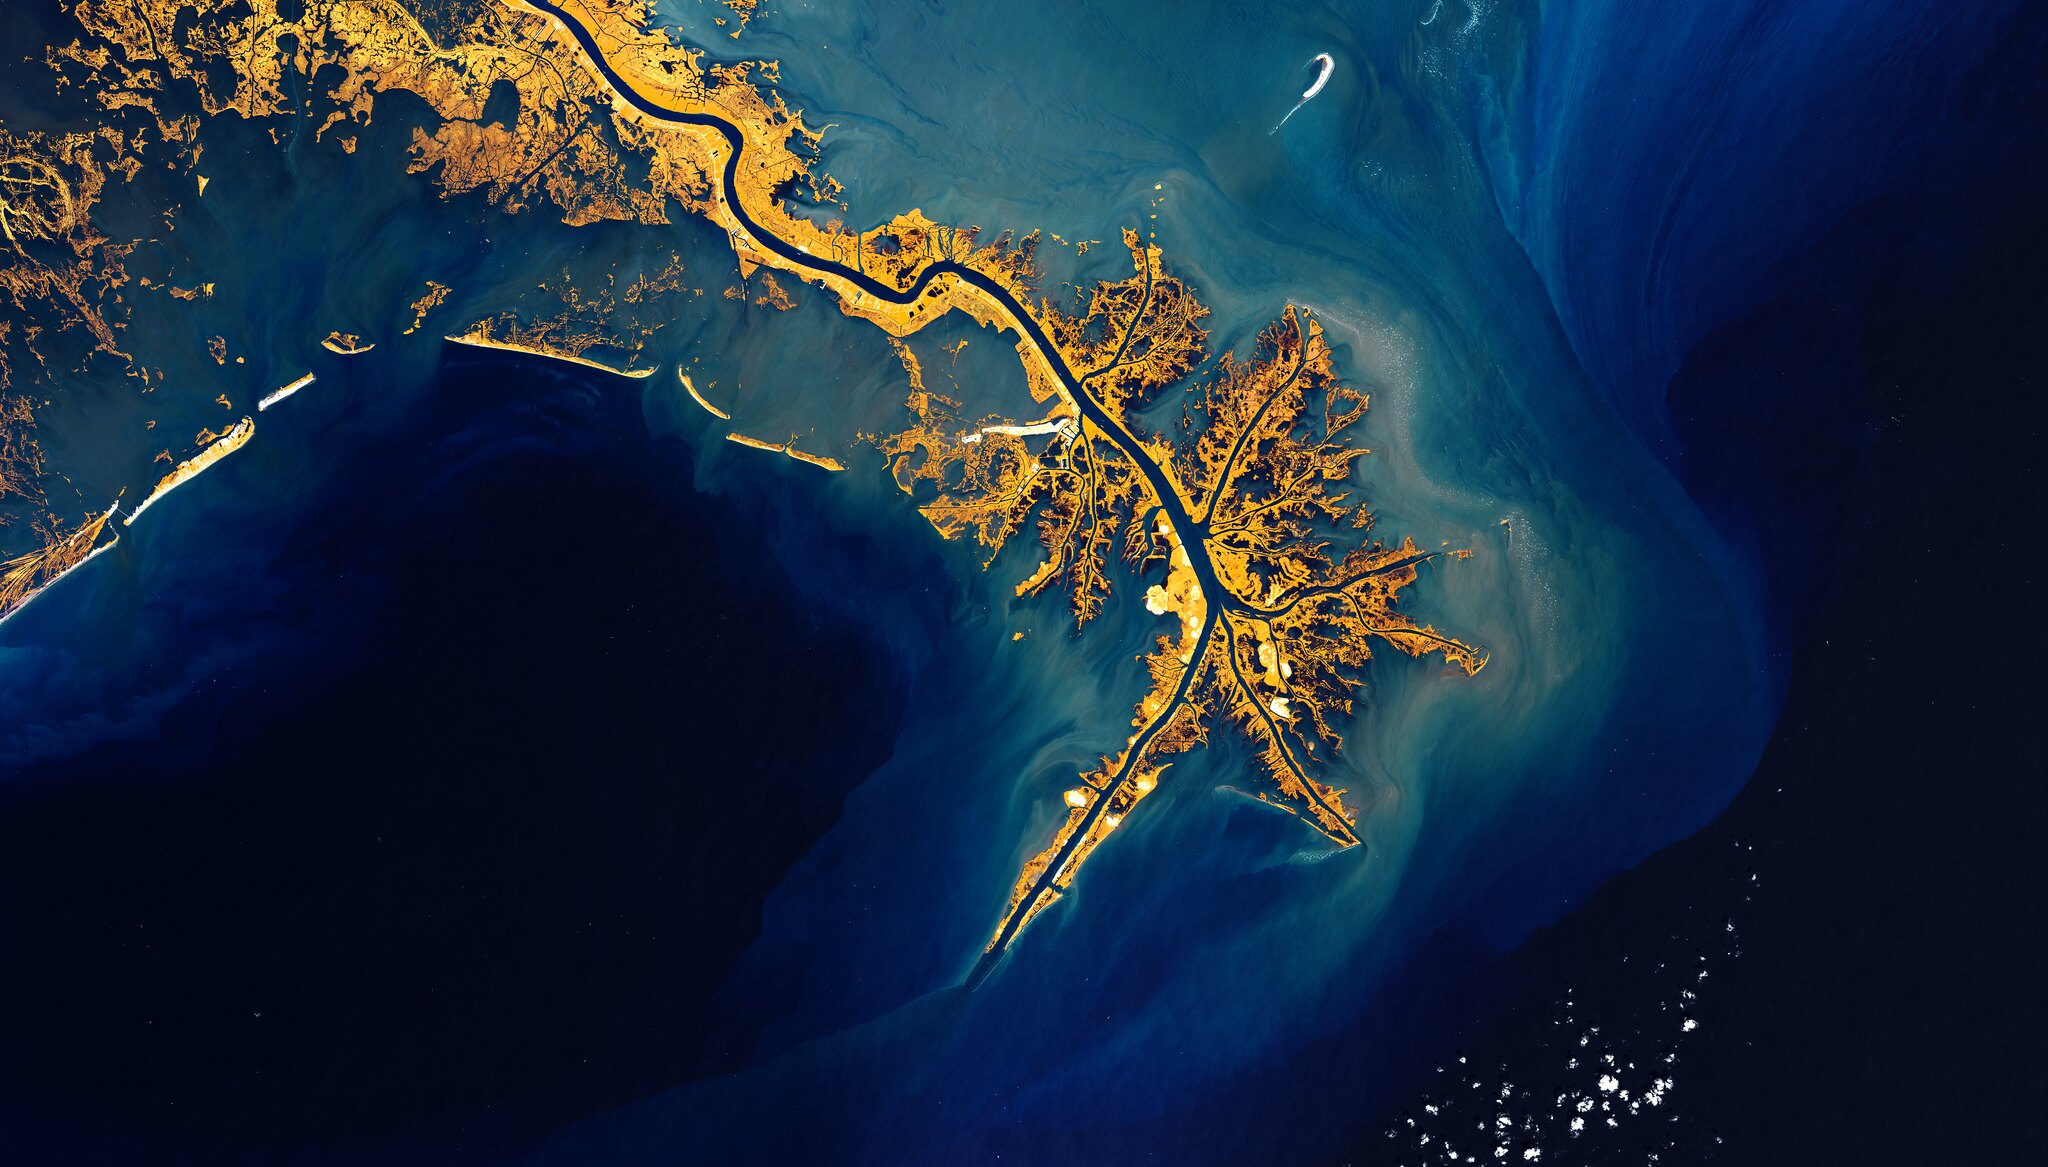
Many river deltas, such as the Mississippi delta, are not getting enough sediment to sustain the current amount of dry land.
Photo by Claudia Weinmann/Alamy Stock Photo
 
The Mississippi River Delta offers a beautiful combo of layers & colors while its waters meet the Gulf of Mexico. That it is the 7th largest river delta on Earth
Copenicus Sentinel 2 22-09-29) 
Courtesy of Iban Amestoy 

From Hakai Mag by J.Besl


Estimates of many deltas’ stabilities in the face of sea level rise were overoptimistic.

Millions of people live on river deltas, occupying land that exists in the delicate balance between a river’s push and the ocean’s pull.
Deltas are inherently transient, but
according to a new study, many may be even more precarious than once thought, with unexpectedly high levels of land loss threatening to submerge these low-lying landscapes.

The insight that many deltas are degrading even faster than previously estimated stems from a new analysis of sediment flow rates led by Austin Chadwick, a geomorphologist at the California Institute of Technology.

When a river reaches the delta, its flow slows and it begins dropping the sediment it carries, bolstering the land in the process.
To date, geologists working to predict the future of a particular delta commonly compare the pace of sea level rise to the rate of sediment deposition.
Their models assume sediment is spread evenly across the delta.
But that’s not a realistic scenario, says Chadwick.

“The previous work has been very much a best-case scenario,” he says.
“A river actually can’t be everywhere at once, and it can’t fight back against sea level rise everywhere.”

In reality, a river only builds new land where it’s currently flowing.
Sediment deposited out of the water forms wide sandy pancakes called lobes.
When too much sediment accumulates and blocks the river’s path, the river will jump course and start building a new lobe elsewhere.
The old lobe, cut off from the sediment supply, will start to erode.

Chadwick and his team wanted to quantify how much land is gained and lost during these jumps and estimate how much future engineering projects can mitigate this land loss.
They modeled a delta system using a new equation that factors in the interplay between sea level rise and river lobes’ unequal growth.
They then confirmed the model using an artificial miniature delta in their lab before applying their findings to actual river systems.

The researchers’ prognosis for many deltas is bleak.
The scientists estimate that given the pace of sea level rise, the Mississippi River, for instance, needs to deliver three times more sediment to the delta than previous estimates suggest to maintain the current area of dry land.
Romania’s Danube River delta has it worse—it needs 10 times its current supply of sediment.
In most cases, that’s more grit than the river can supply, suggesting these deltas are doomed to drown.

The new forecasting method, says Chadwick, “gives you a more realistic, but also a little bit more pressing, prediction.”

Not all deltas are in danger, though.
China’s gritty Yellow River is so thick with sediment that it jumps course and forms a new lobe every decade.
Engineers have even been able to corral the river with diversions to focus the firehose of sediment and bolster land in select locations.
These sorts of projects come at a steep engineering and ecosystem cost, but they maximize the river’s land-building potential.
Without diversions, a river may waste that much-needed sediment by pipelining it into the open ocean or building a lobe and abandoning it.
For regions that can afford it, diversions offer a path to ensuring there is persistently dry and habitable land in choice delta regions.

Very few rivers, however, have the massive sediment supply of the super-silty Yellow River.
The Mississippi River, in comparison, naturally switches course every 2,000 years.
Louisiana’s Coastal Master Plan recommends diversions in some locations and river dredging elsewhere to build marshes and stabilize banks.

The clock is ticking for the mouth of the Mississippi and many other deltas.
As the ocean rises, engineers will need even more sediment to fill the deeper water, says Ehab Meselhe, a civil engineering professor at Tulane University in Louisiana.
A restoration solution that works today may not work 10 years from now.
“The sooner we implement projects, the more likely they are to succeed,” Meselhe explains.
“Time,” he adds, “is not on our side.”
 
Links :

Wednesday, October 12, 2022

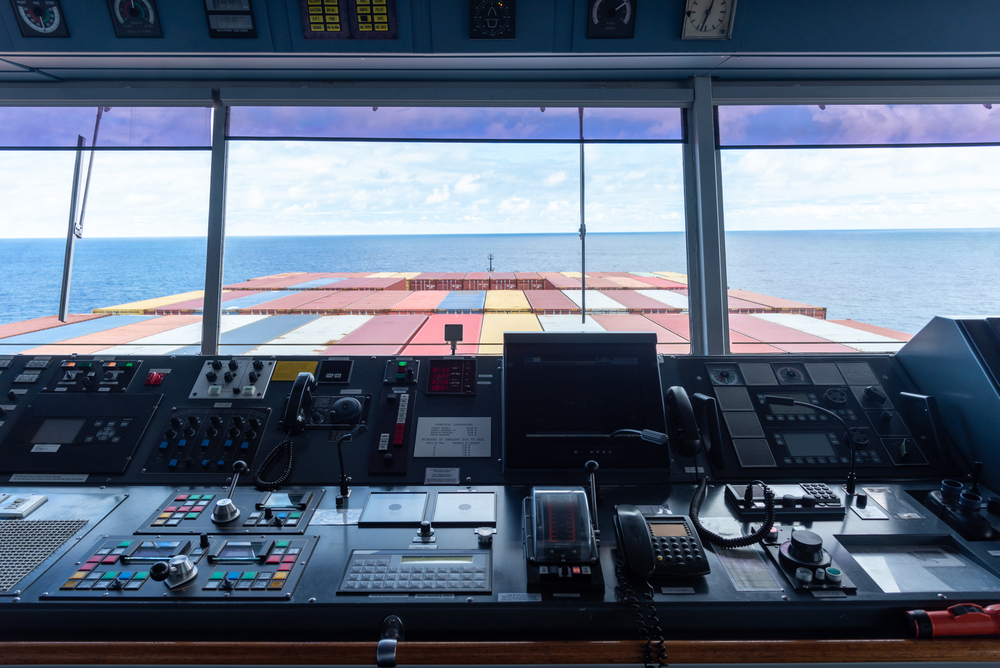
UKHO: The next generation of navigation technology will transform shipping


From Safety4Sea by Peter Sparkes

UKHO’s Chief Executive, Peter Sparkes, refers to the radical changes that S-100 suite of standards will bring to navigational safety, highlighting that the future is digital.
In that regard, UKHO is currently in a transition phase up to 2026 as it is withdrawing from paper chart production, supporting users to unlock the benefits that digital navigation brings.


The shipping industry is navigating an era of unparalleled change and a digital transformation, Mr .Sparkes says, adding that, in that regard, it is vital to understand the marine context in which we operate to successfully enhance not only safety but also decarbonizing efforts.

SAFETY4SEA: What are the top priorities on your agenda for the next five years?

Peter Sparkes: The future of shipping will be underpinned by digital innovation, enhanced satellite connectivity at sea, and data-driven decision-support solutions that better optimise operations.
Meanwhile, the next generation of electronic navigational charting data standards (S-100) will greatly enhance the safety and efficiency of maritime navigation.
Our aim is to be at the forefront of the industry’s digital transition, continuing to provide the assured and globally trusted ADMIRALTY Maritime Data Solutions that the world’s seafarers depend on.

An increasingly digital maritime industry will be shaped by the International Hydrographic Organization’s new universal S-100 data standards – which we will support as one of our top priorities – fusing and enriching navigational products and services.
S-100 will also enable fleet operations and supply chains to work in closer harmony, to unlock a new level of port access, transparency and support in near real-time.
The new standards will dramatically reduce the time that vessels need to wait for important navigational and safety updates, improving the safety of life at sea and supporting enhanced voyage optimisation and weather avoidance.
We seek to play a leading role in advancing the development of these new digital standards by working with users, providers and partners to test product specifications, build safety cases, improve the user experience and fully realise the undoubted potential of the S-100 suite of standards.

S4S: Following your recent announcement, what are the key barriers and drivers with regards to the digital transformation within the industry that you are currently facing?

P.Sp: We understand and acknowledge the significance of our announcement to withdraw from global paper chart production by 2026, given our history of creating standard nautical charts (SNCs) and the trust that mariners have long placed in ADMIRALTY charts.
Generating timely and effective digital alternatives and managing a smooth transition is a responsibility we feel keenly.
The last 10 years have seen a rapid decline in user demand for paper charts, driven by the SOLAS-mandated transition to ECDIS and growing recognition of the wider operational benefits of digital solutions, including the next generation of navigation services.
In 2011, 80% of ADMIRALTY products sold were paper based, with 20% digital.
In 2021, 84% of ADMIRALTY products sold were digital, while only 16% were paper based so demand is declining at about 17% per annum.
Our users are telling us they want and need digital solutions.
They need to know where they are, not where they were.
Withdrawing from paper chart production enables us to greatly increase our focus on digital navigation products and services that we will be able to update in near real-time, greatly enhancing safety of life at sea.
During the transition period, we will support users of SNCs and work with our distributor channel to help users switch to digital alternatives, between now and 2026.
The key message is, we want to take all our ADMIRALTY users with us, greatly improving our support for them and helping them to unlock the benefits that digital navigation brings.

S4S: What changes should we expect to see following the transition to a digital chart portfolio by 2026?

P.Sp: The UKHO has produced first-generation electronic navigational charts (S57 ENCs) for nearly 20 years, with 18,000+ cells now available through the global ADMIRALTY Vector Chart Service (AVCS).
Our extensive international portfolio of ENCs, which meet flag and port State requirements, help bridge crews, navies and shipping companies to navigate safely and efficiently, whilst helping inform the operational and investment decisions of charterers and other key stakeholders.
Our strategy to withdraw from paper chart production is centred around reducing and eventually removing our paper chart portfolio, in line with user needs, market trends and commercial viability.
It will happen in a phased and carefully managed transitionary approach, in close consultation with our customers, partner hydrographic offices and regulatory bodies, including the UK Maritime and Coastguard Agency (MCA).
As we withdraw paper charts, we will focus on providing users with authoritative digital alternatives to meet their demands and those of regulatory bodies, phasing out SNC coverage in a way that is safe for mariners and sustainable for the UKHO.
The withdrawal of paper charts does not include paper publications, which we will continue to support.
However, we are also developing a much improved, far more user-friendly ADMIRALTY Digital Publication solution, too.

S4S: What advice would you give to industry stakeholders for safer navigation in the digital age?

P.Sp: The shipping industry is navigating an era of unparalleled change and a digital transformation.
But despite the pace and scale of these challenges, the next generation of navigation technology will deliver a huge leap forward in positional and situation awareness capability, providing tools that will enable us to make smarter, faster decisions about the operations of our vessels, and deliver the safe, secure, and thriving oceans that we all seek.
Better understanding the marine context in which we operate is fundamental to successfully protecting our oceans, coastlines, and environment, as well as to decarbonising maritime operations.
Cleaner fuels and novel propulsion technologies will play a significant role in reducing shipping’s carbon impact.
High-fidelity navigational data can, in the near-term, also help to unlock significant latent operational efficiencies in our ports and in how we operate ships.
Together, we can help to enhance voyage and route optimisation, expedite port operations, and enable ‘smarter steaming’ and ‘Just in Time’ arrivals.

S4S: What does the industry need to start doing differently to prepare for a smarter and digitalised future?

P.Sp: For me as a former mariner, what’s really exciting is the scale of the latent potential that we can help realise.
Data-based vessel, voyage and fleet optimisation is particularly interesting, as are the impacts of heavy weather avoidance, slower steaming and ‘Just in Time’ arrivals as they become operational norms.
A recent ‘Seas at Risk and Transport & Environment’ report identified that by reducing speeds across the global fleet by 20% – which is an achievable by-product of ‘Just in Time’ – we may be able to reduce shipping’s carbon footprint by a remarkable 34%.
This means that the potential impact of smarter navigation, enabled by data-driven efficiencies, is huge.
The UKHO is actively looking at the role it can play to harness this opportunity, working with other like-minded stakeholders in common purpose.

To help support the development of ‘Just-in-Time’ arrivals, UKHO is working with partners on the Port Call Optimisation Task Force to create a new universal data standard for all parties involved in a port call.
This is a great example of how we can harness the latest innovations in navigational standards to meet shipping and society’s environmental goals.
I’m excited by the contribution we can make to reducing shipping’s carbon emissions, and that’s just one area among many that we are focusing on.

S4S: How can we promote/encourage more innovation in the marine navigation?
What would be the key trends that will cast our attention in the coming years?

P.Sp: One example close to home for the UKHO is the Centre for Seabed Mapping (UK CSM).
The Centre was launched in July to increase the coverage, ‘map the gaps’, improve the quality and access of seabed mapping data collected using public funds, and better promote the role that marine data plays as a critical component of national infrastructure.

We are inviting UK Government organisations involved in seabed mapping, who share common interests in optimising the UK’s national maritime assets, to become a member of the newly unveiled UK CSM.
The idea behind the Centre is to spearhead a coordinated approach to the collection, management, and access of seabed mapping data – and to champion a more integrated marine geospatial sector in the UK.
The UK CSM has established three initial working groups that members can join and contribute to: National Data Collaboration, International Data Collaboration, and Data Collection Standards.
This initiative and other international collaborations that UKHO participates in will help to encourage innovation in the marine data and navigation space.
The role of collaboration in the near-term cannot be understated.
The sector’s challenges are so large that no one player can hope to solve them on their own, so it’s critical we find the right mechanisms – such as the UK CSM – for working together.

S4S: Do you have any other projects/plans you would like to share with industry stakeholders?

P.Sp: To give one example of where things might be heading, the digitalisation of onboard systems, the rapid growth of the Internet of Things, and the improvement in broadband communications have brought the possibility of uncrewed and autonomous vessels within reach.
This will require UKHO to consider how we move from navigational systems that have been simplified to meet the needs of the human user, to navigation solutions that are data-rich and machine-readable.In June, the crewless Mayflower Autonomous Ship arrived in North America after setting sail from Plymouth, UK, three months earlier.
The vessel’s successful voyage – which the UKHO supported with electronic navigational data – demonstrates the power of AI and autonomous technology, and sets the coordinates for where maritime is heading in the near future.

S4S: What is your key message to industry stakeholders with respect to e-navigation?

P.Sp: As the UKHO transitions from paper charts to focusing fully on our ADMIRALTY digital products and services, our core purpose remains the same: supporting the safety of shipping operations and delivering the best possible navigation solutions to achieve that.
Whether for the Royal Navy, commercial vessels or other ocean users, the organisation’s focus is on developing and delivering ADMIRALTY digital services our users need, to promote safe, secure and thriving oceans.

Links : 

Tuesday, October 11, 2022

Is climate change disrupting maritime boundaries?


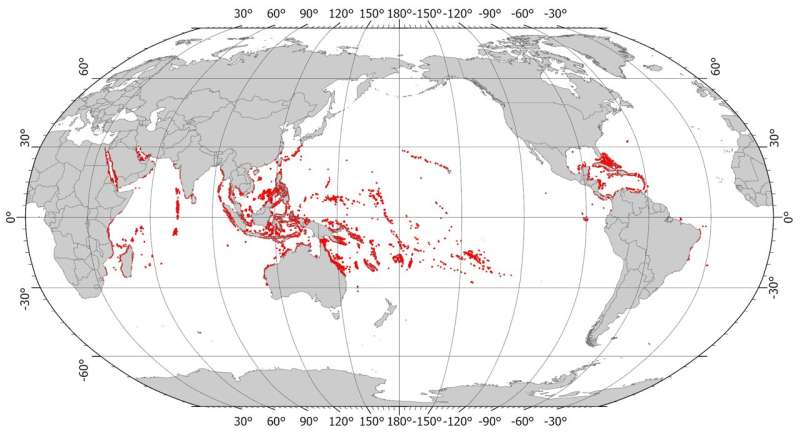
 Global coral reef distribution (red dots).
Credit: Millennium Coral Reef Mapping Project/World Atlas of Coral Reefs


From Phys by University of Sydney

Coral reef islands and their reefs—found across in the Indo-Pacific—naturally grow and shrink due to complex biological and physical processes that have yet to be fully understood.
Now, climate change is disrupting them further, leading to new uncertainties for legal maritime zones and small island states.

But it may not be time to panic yet.
A number of technologies and new approaches, coupled with expanded research into coral reef island behavior, may help dispel some of the uncertainties and solidify claims.

A study by University of Sydney researchers, published in Environmental Research Letters, finds that the rules for atolls and coral reefs in international law of the sea—already murky and subject to interpretation due to their shifting nature—will be under greater stress as sea levels rise and ocean acidification disrupts reef integrity.

"It's a perfect storm that is bringing instability and uncertainty to what are already difficult boundaries to determine with any great accuracy," said Dr.
Thomas Fellowes, a postdoctoral research associate at the School of Geosciences of the University of Sydney and lead author of the paper.

"There are geopolitical consequences too.
Coral reef islands are the legal basis for many large maritime zones.
Hence, the climate disruptions we're already seeing—and will see in the decades ahead—may have substantial impact not only for small island states, but in hotly contested boundary disputes in places like the South China Sea."

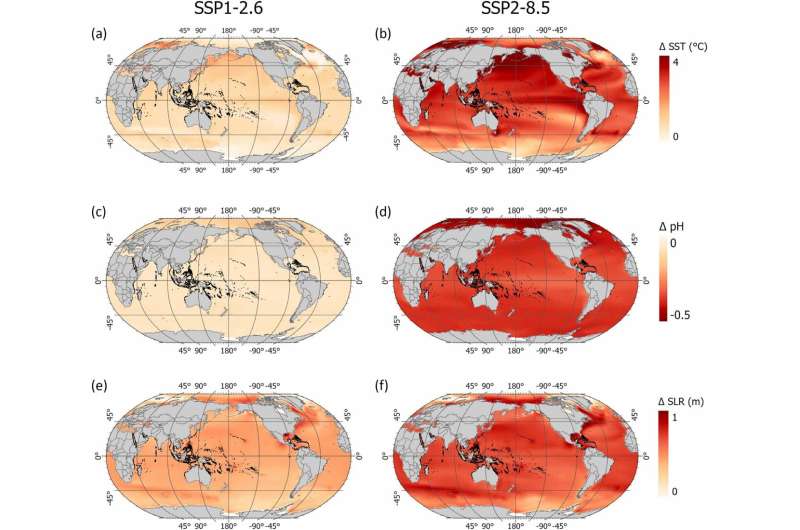
IPCC projections for 2081 to 2100 relative to 1995-2014 under best case scenario (1.5˚C rise, left) and worst case scenario (CO2 emissions double by 2050, right).
Credit: Intergovernmental Panel on Climate Change


This treaty, signed by 167 nations and almost universally recognized, governs everything from territorial seas—up to 12 nautical miles from a coast or low-water line of a reef—to exclusive economic zones of up to 200 nautical miles.
It codifies the rules for freedom of navigation, and allows nations to exploit, conserve and regulate resources in neighboring waters.

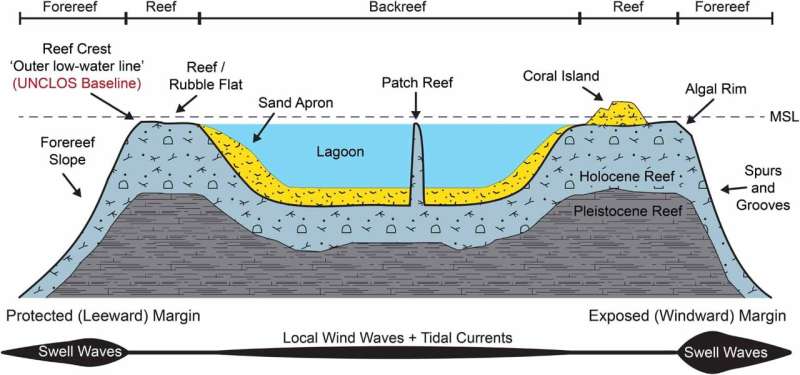
"For coral islands, the outer 'low-water line' of the reef is used as the legal baseline to establish maritime zones," said Frances Anggadi, a Ph.D.
student at the University of Sydney Law School.
"The potential loss of maritime zones due to changes in reef baselines from climate change is a serious concern for nations like Kiribati, as well as for larger ones like Australia, who depend on reefs and islands to maintain their claims."

But there is still no clear agreement whether changes to the structural integrity of coral reef islands due to climate will lead to legal vulnerabilities.
"They may not, and that's what many Pacific island countries believe.
What's clear is that a more detailed understanding of coral reef island behavior is needed, along with rethinking of the legal rules."

Dr. Fellowes added that "coral reefs are vulnerable, only thriving within a specific range of biophysical, ocean and climate conditions.
But changes in sedimentation due to climate change may support coral islands and strengthen some maritime claims.
It's not entirely clear that there will only be losers."

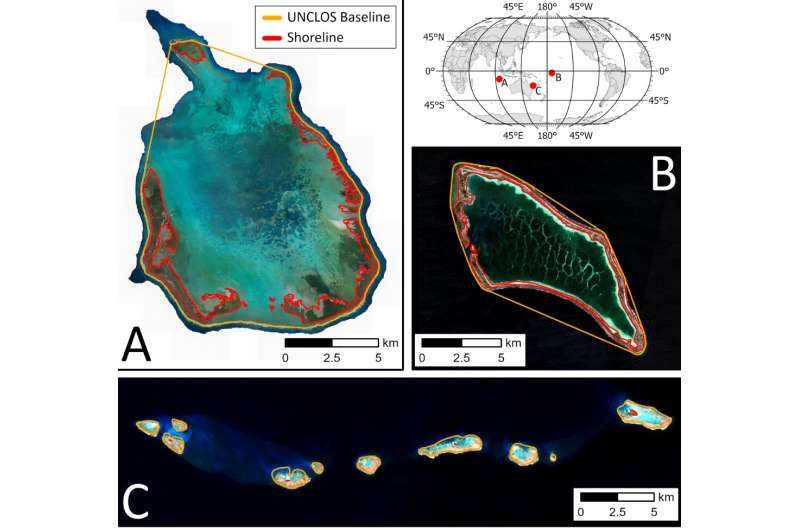
Coral reef island shorelines (red) and UNCLOS baselines (orange) at (a) Cocos Keeling Island, Australia (b) Kanton Reef, Kiribati, and (c) Wreck Reef, Australia.
Credit: Geoscience Australia/Sentinel Hub


The researchers argue that one way to buttress existing claims is by defining reef baselines with geographic coordinates like GPS, or remote sensing approaches like satellite bathymetry.

Another is to better understand how climate change will affect island habitability, since sustaining human habitation or economic life in a location is another way to establish a viable claim under the treaty.

But for these approaches to work, more data on each coral reef island system is needed in order to more accurately delineate the true scope of existing claims, how resilient those claims have been so far, and to better understand what aspects of climate change might affect them in the future.

There are four ways in which climate change is disrupting coral reef systems in ways that may affect maritime boundaries: sea-level rise, warming oceans, ocean acidification and increased storminess.

Each has an impact on the interconnected biophysical processes that allow the creation, retreat and overall structural stability of coral reefs and islands.

Cross-section of coral reef geomorphic zones, showing wave energy gradients, sedimentary features (islands, sand aprons and lagoons) and UNCLOS baselines. 
Credit: Vila-Concejo and Kench

For example, higher temperatures trigger the expulsion of algal symbionts in corals and other invertebrates (like giant clams), leading to coral bleaching, which—if enough coral organisms die—can result in reef collapse.
In the decades ahead, this could lead to a shrinkage of the outer low-water line of the reef, reducing the basis for a maritime claim.

Oceans acidify as they absorb more and more carbon dioxide, reducing their mineral saturation and making it harder for corals to form.
Reef building species like Acropora—a small polyp that is common in tropical reefs—begin to change their skeletal structures to rely on less carbonate mineral, imperiling overall reef integrity.

As the reefs grow and expand, they become either fringing, barrier or atoll reefs.
Fringing reefs are the most common, projecting seaward from the shore, forming borders along shorelines and surrounding islands.
Barrier reefs do this at greater distance, separated from land by a lagoon of often deep water.
If a volcanic island sinks below sea level and its reef coral continues to grow, an atoll forms.