Saturday, October 28, 2023

Moments of magic and bliss: Chris Burkard’s ocean photography

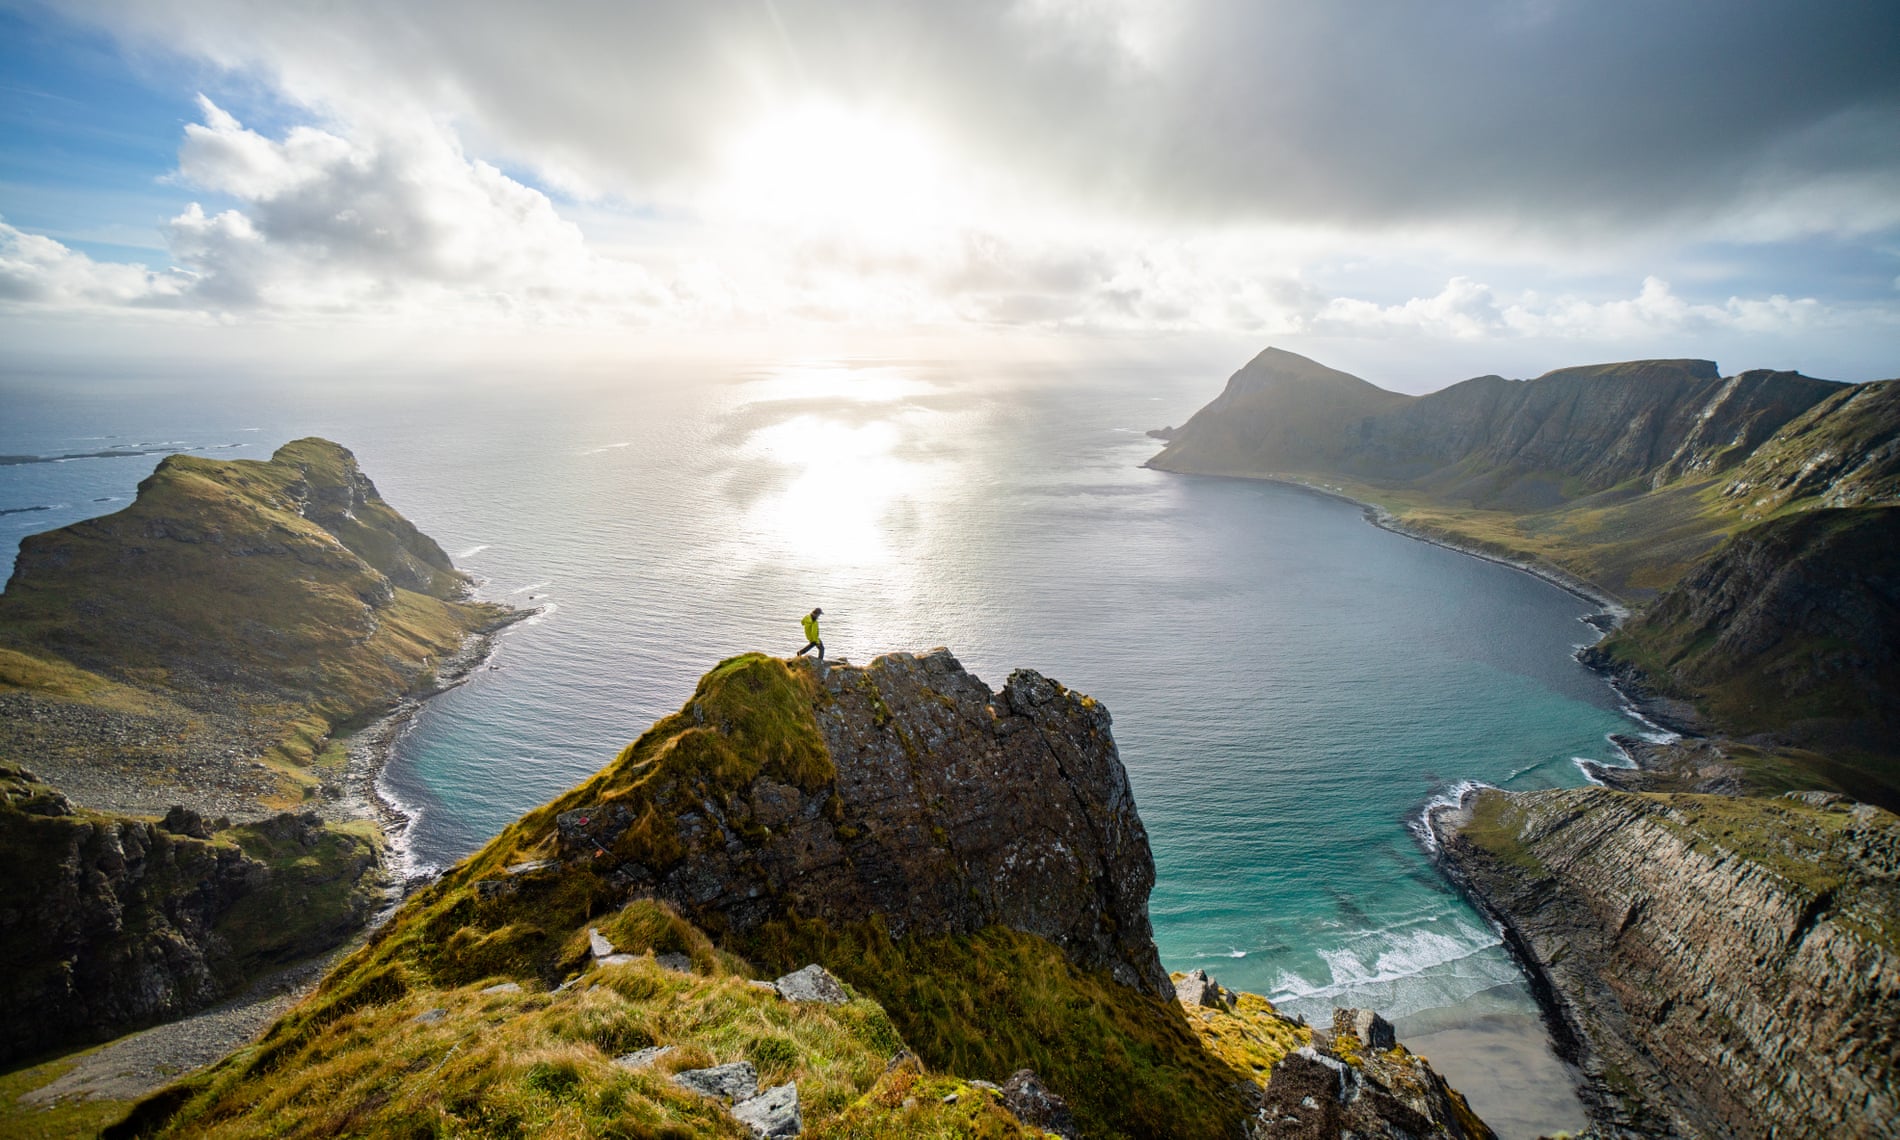
Norway, Atlantic Ocean, 2018
Photo Chris Burkard/Gestalten

From The Guardian by by Matt Fidler
 
Outdoor and surf photographer Chris Burkard has explored the seven seas capturing their diversity and wild beauty.
His arresting work from the colder northern regions to the tropics shows the world’s ocean as a source of inspiration that needs our respect and care


You may well be familiar with the work of photographer Chris Burkard, one of the most followed photographers on Instagram, where he shares his vision of wild places with 4 million followers.
His work, which has also been published in several books, is a journey of exploration of the seven seas, from otherworldly seascapes to coastal wildernesses to surfing in the frozen north Atlantic to the tranquil tropics, illustrating the diversity but also the fragility of the global ocean.
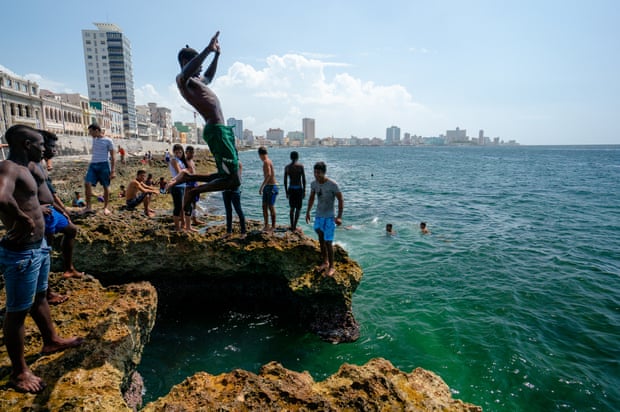
Cuba, Caribbean, 2013

Growing up just steps from the Pacific Ocean in the central California town of Pismo Beach, Burkard grew attached to the sea at an early age through surfing.
After first planning to be a mechanic, he discovered photography, interned at TransWorld Surf magazine and eventually found permanent work at the surf content and forecasting website Surfline.
A self-taught photographer, he went on to build a career through his travel and adventure work, publishing several books, winning many awards, appearing on podcasts and lecturing regularly; a Ted Talk of his on the joy of cold water surfing has more than 2m views.
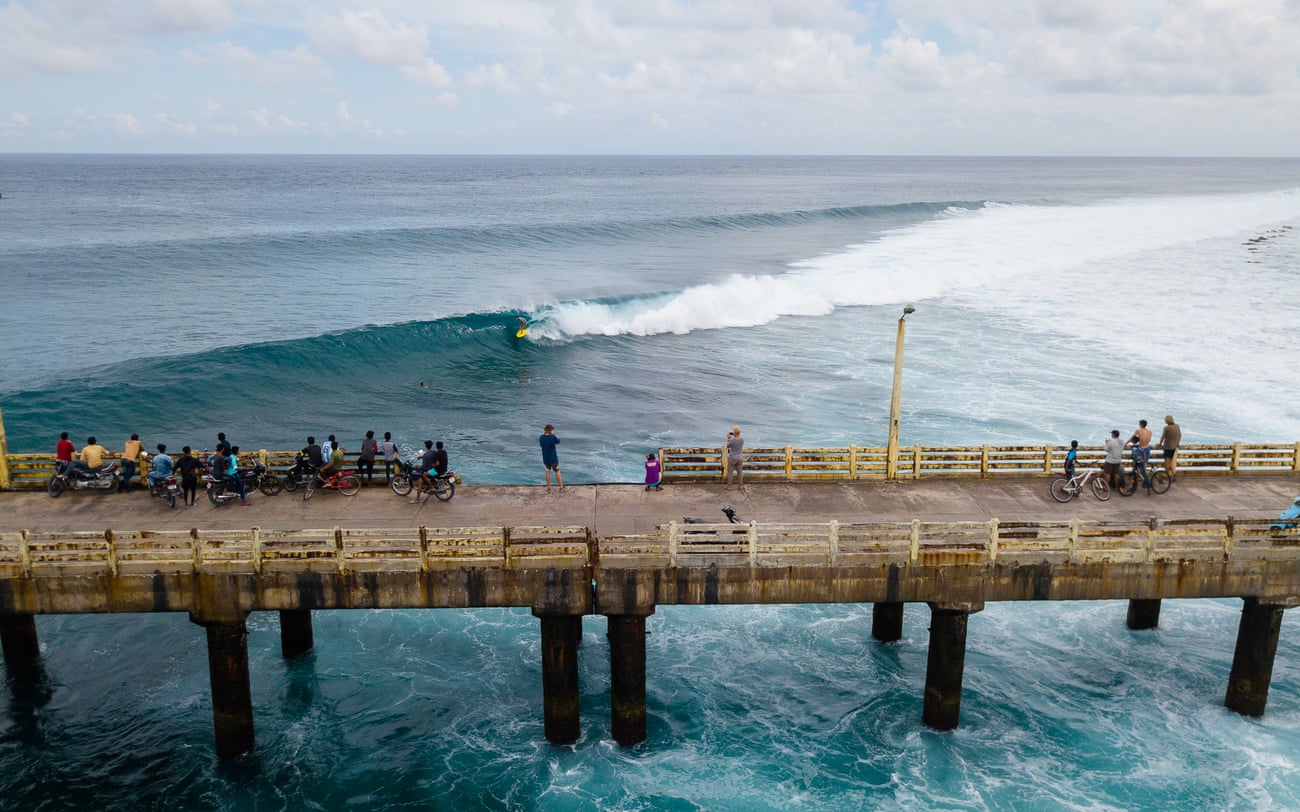
Indian Ocean, India, 2017

After experiencing western Canada’s coast, he began to looking for locations and stories away from more well-worn surfer trails.
“Surfline marked the beginning of a frantic few years of adding new stamps to my passport, travelling from Costa Rica to Kiribati, from Mexico to the Mentawai Islands,” he says.
“But it wasn’t until I traveled to Tofino and Haida Gwaii, islands in western Canada, that I really understood the saying ‘never turn your back on the ocean’.
My camera became my passport, and I invested everything in it

“It was the first time I really experienced a truly raw ocean, a different body of water than the calmer Pacific that I was used to.
It was colder, shaped more by the tides – meaner, more aggressive.
Going there made me realise I wanted to push the boundaries of what was possible.
I found that the more risks I took – not just in life but also creatively – the stories I was telling with my camera started to take on a greater depth, became more immersive and emotional.

“I fell in love with the desolate beauty of remote places – untamed, harsh environments where mountains meet the sea.
Places like Alaska, the Faroes, the Aleutians, the far east of Russia, Chile, Iceland, and Norway, where there is a sheer drop from steep granite mountains to icy ocean.”
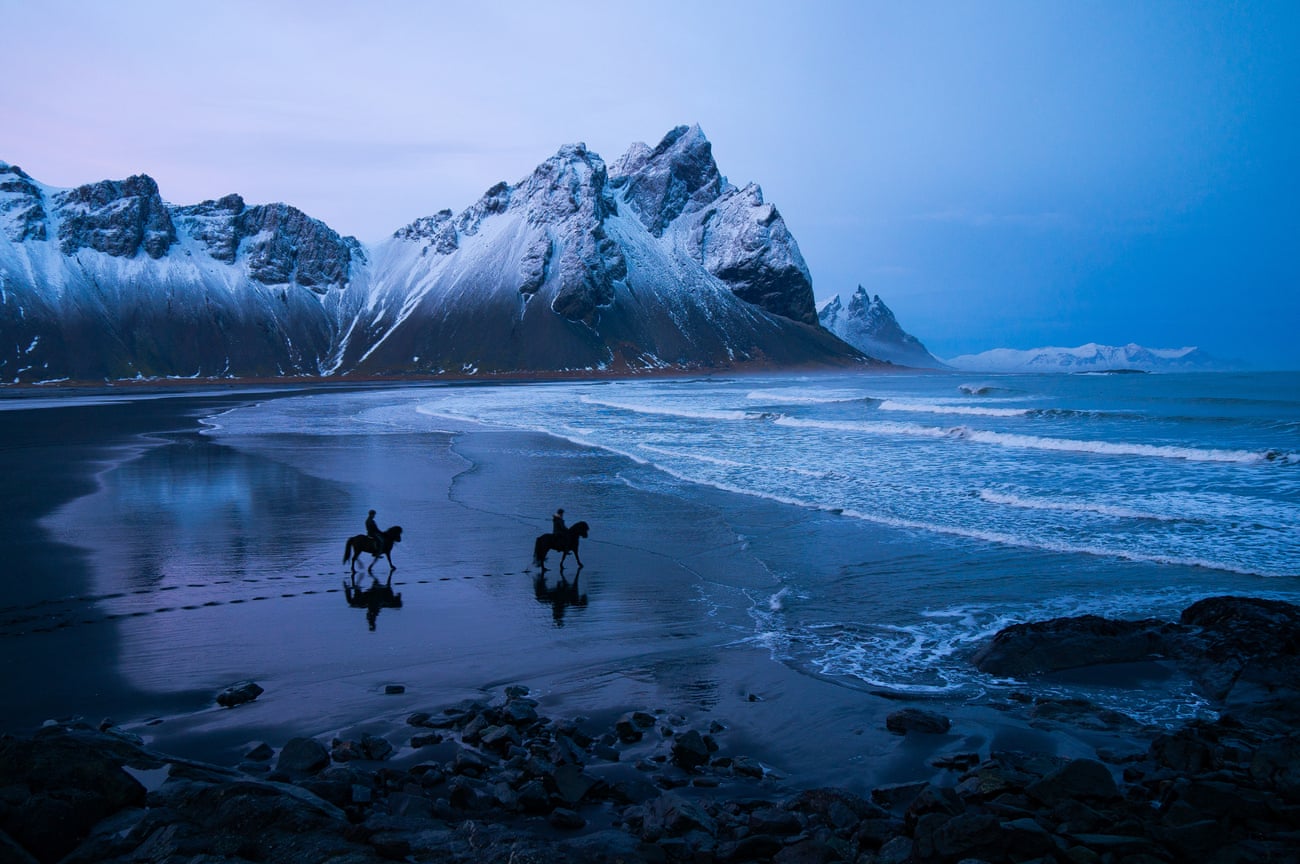
Iceland, Atlantic, 2013.

With his latest book of photography, Burkard wanted to produce something more comprehensive than previous collections.

“Some of the work I perhaps wasn’t known for – it’s rewarding for it to come out – and I’ve been excited to have a way to articulate my point of view not only for ocean and beaches, but to look at communities, food and what makes them interesting.
The ocean was my first canvas thats what drew me inChris Burkard

“As I have gotten older, my goals have shifted.
Early on in my career, I wanted to get a photograph on the cover of Surfer magazine.
Then it was chasing this or that award.
Nowadays my practice is more about how I can uplift people who need their stories told, and advocate for some of the places that have fed my soul.”
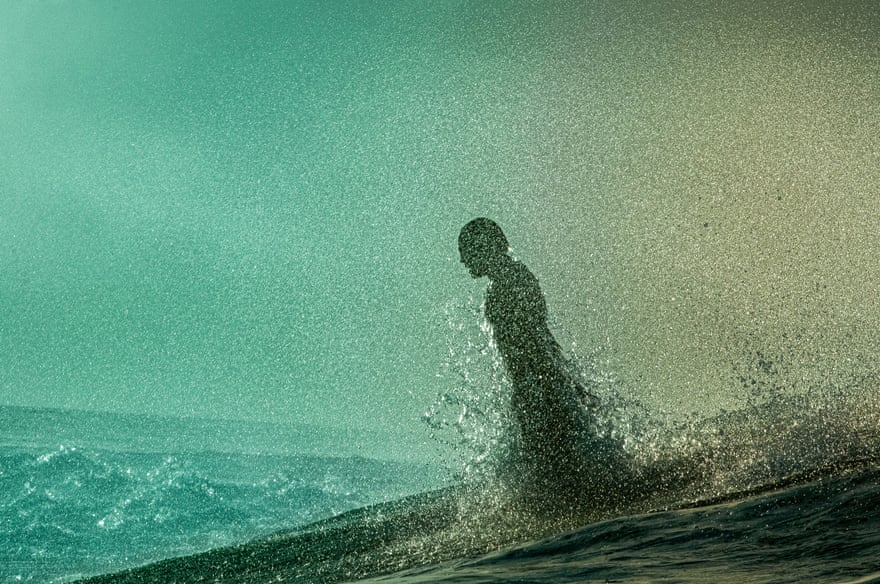
Tahiti, French Polynesia, 2011

Much of his photography has a sense of a carefully planned setting, but also has a spontaneity that clearly requires patience and preparation.
“The ocean is a great teacher,” he says.
“Unlike other action sports, when shooting surfing specifically there is an element of waiting and patience.
You have to go when a storm is hitting, and that obviously only provides a limited window of opportunity.
Every time it’s different, and you have to capitalise on it and be grateful for what you get.”

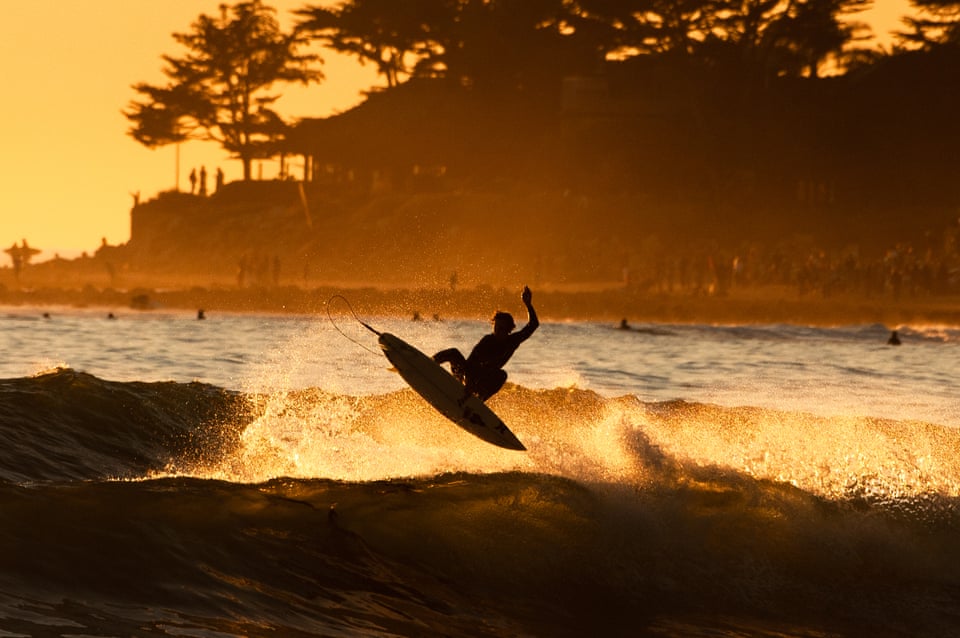
Iceland, Atlantic, 2014

Central California, United States, 2011

Burkard is colour-blind, and though he often struggles to match his outfits this has perhaps contributed to a unique approach to photography.
“I’ve never looked to capture complementary colours in my images; instead, I’ve always looked for contrast.
On that trip I was searching for striking, starkly different colour schemes that play off of one another, ones that emphasise the difference between light and dark.
I can’t really say, but I sometimes wonder if being colour-blind has allowed me to home in on capturing this contrast a little more than I would have been able to otherwise.”
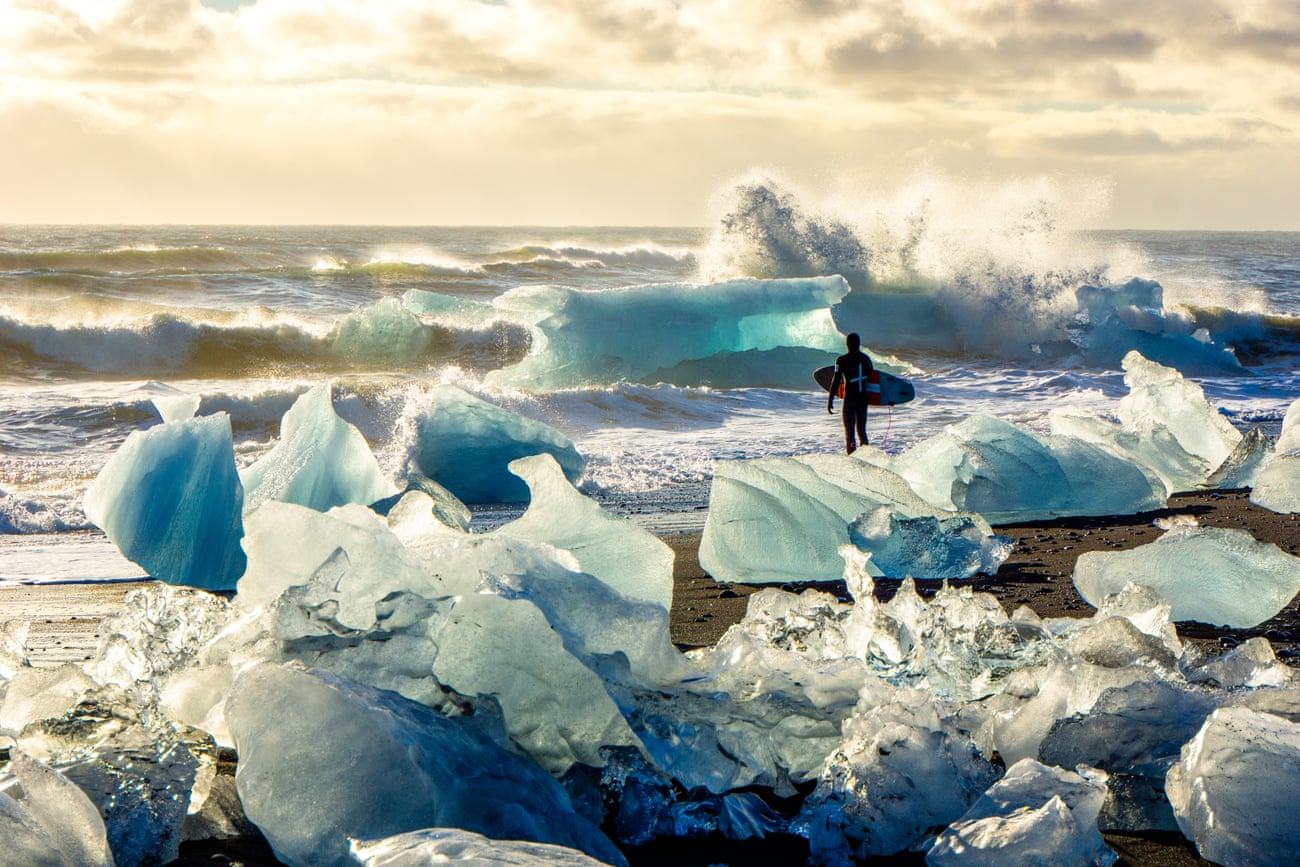
Iceland, 2011, Atlantic

Burkard is very transparent with his audience on social media, detailing the logistics of a shoot or journey, or sharing some detail of the story behind the photograph.
“I don’t believe Instagram has made my career but it has given me more access to the story – the readers, the communities – and when you are given that, you take advantage.”
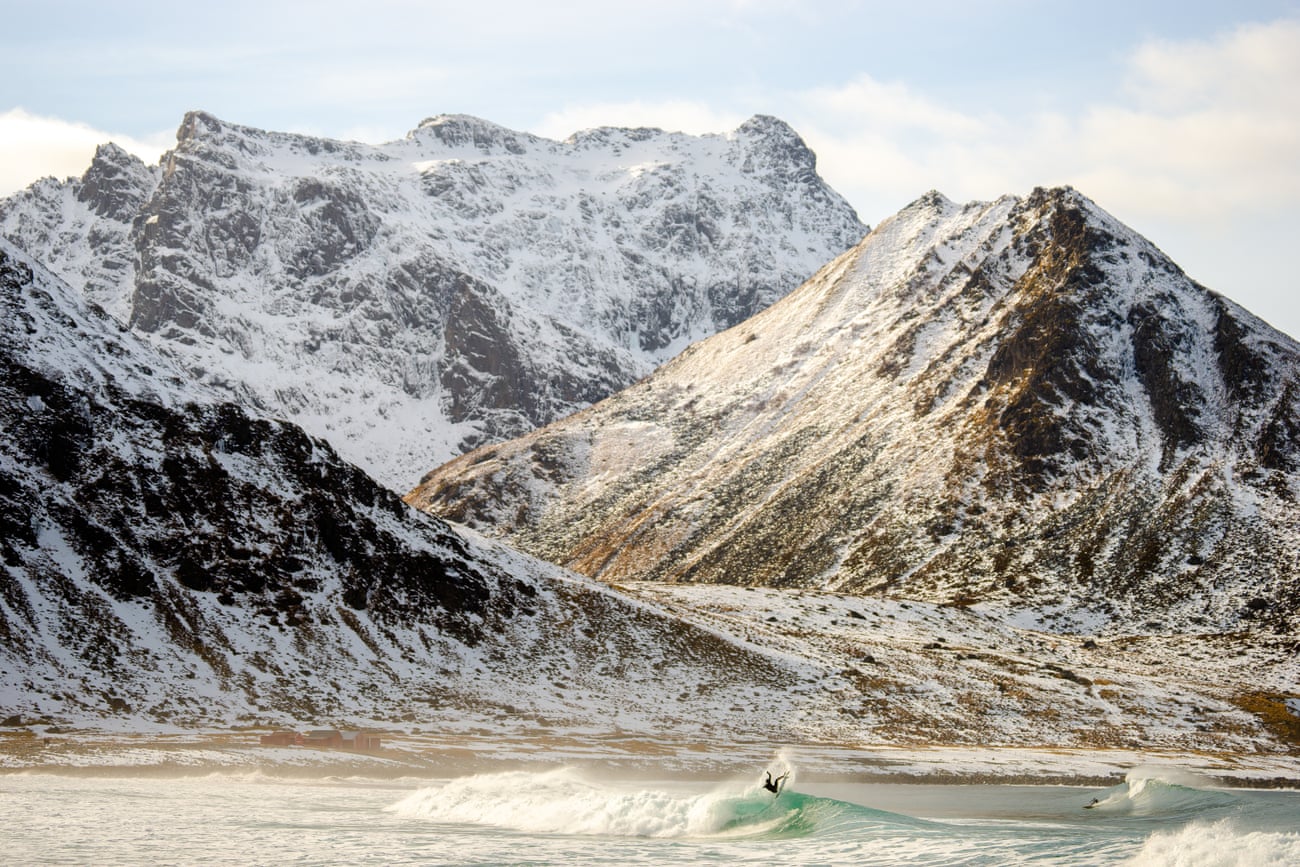
Winter surfing, Norway, Atlantic, 2014

He keeps returning to the cold-water surf destinations, an obsession that began with a trip to Iceland.

“A lot of the people I’ve met aren’t surfers.
If you’re in a small village in the Faroe Islands, people might be shocked you’re even in the water at all, because it’s only in the last five to 10 years that people have taken to the ocean for recreational purposes.
In these cold locales, anyone can tell you a story of an uncle or father or brother or friend who has died at sea.
Many of these communities are riddled with similar sad tales.
So it can also be very empowering when people come out and see you surfing and tell you that they had never imagined that this would be possible – that they had never connected the harsh reality of the ocean with the possibility of fun.”

I try to create a sense of timelessness, so that when you see a picture of mine, it feels accessible
Burkard
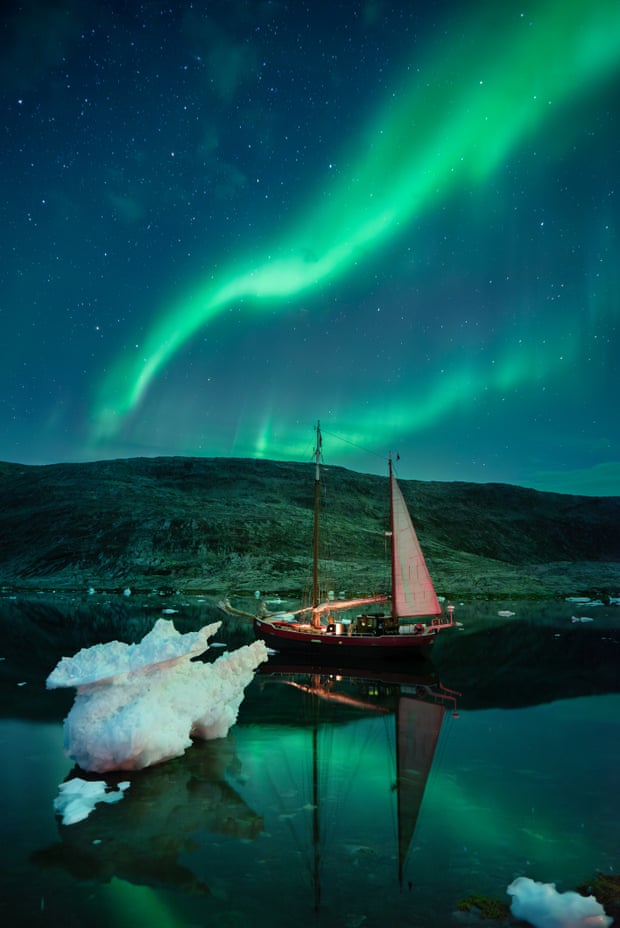
A workshop on the Aurora Arktika in eastern Greenland, Atlantic Ocean, 2017

Friday, October 27, 2023

A $7.5-million find: Overlooked Getty estate sale map turns out to be 14th century treasure


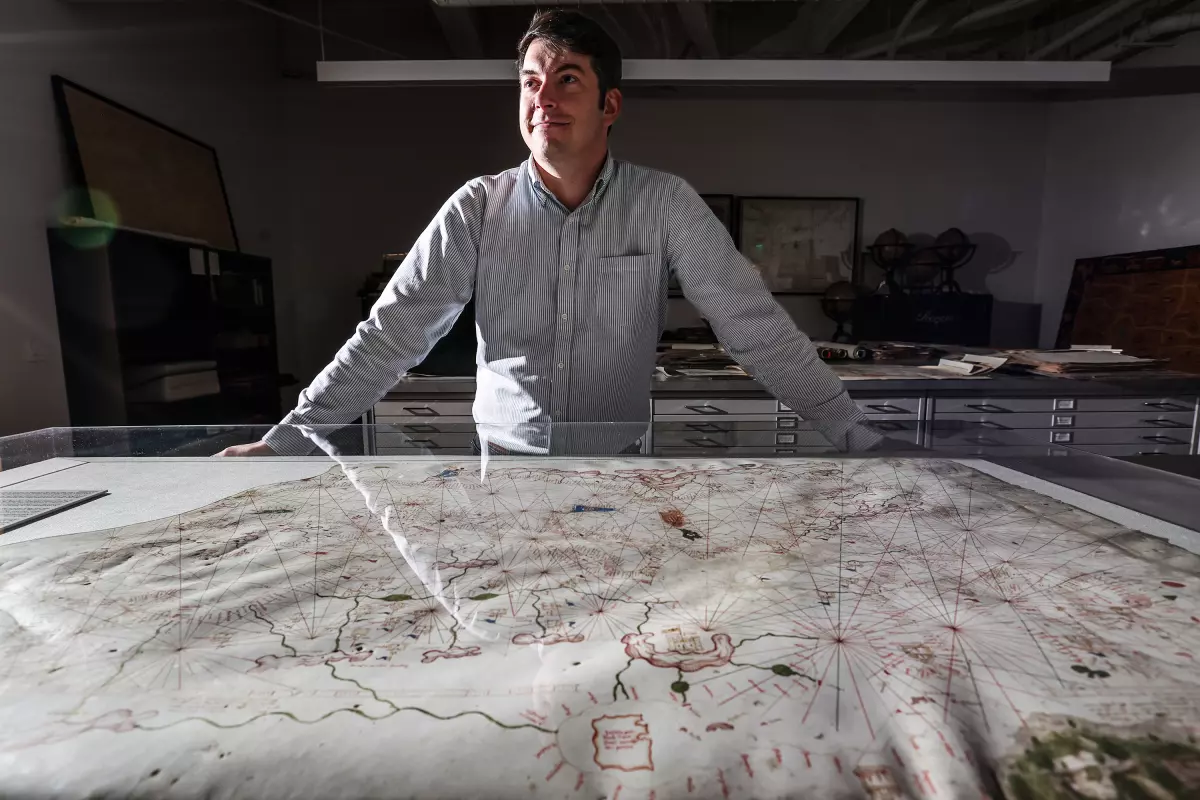
La Jolla map dealer Alex Clausen came across this rare 14th century nautical chart
at an estate sale for Ann and Gordon Getty.
"...the greatest thrills are the discoveries which are truly unexpected, but for which you search and prepare your entire career. You don’t know where or when, you simply prepare for the journey."
(Robert Gauthier / Los Angeles Times)

From LA Times by Hannah Fry

Alex Clausen is a map dealer.

And although that designation may not, at first read, exude adventure and romance, Clausen really is a modern-day treasure hunter.
He doesn’t sail the seas in search of sunken ships and pirate booty.
But from his perch at Barry Lawrence Ruderman Antique Maps Inc. in La Jolla, he has made some impressive discoveries.

Clausen, 35, peruses auctions, estate sales and other dealers’ websites in search of antique maps, manuscripts and pivotal historical documents that have been forgotten or overlooked — sometimes for decades.

A few years ago, he got his hands on the original drawings for the Statue of Liberty.
But nothing, he said, compares to the $7.5-million find he came across last fall. 


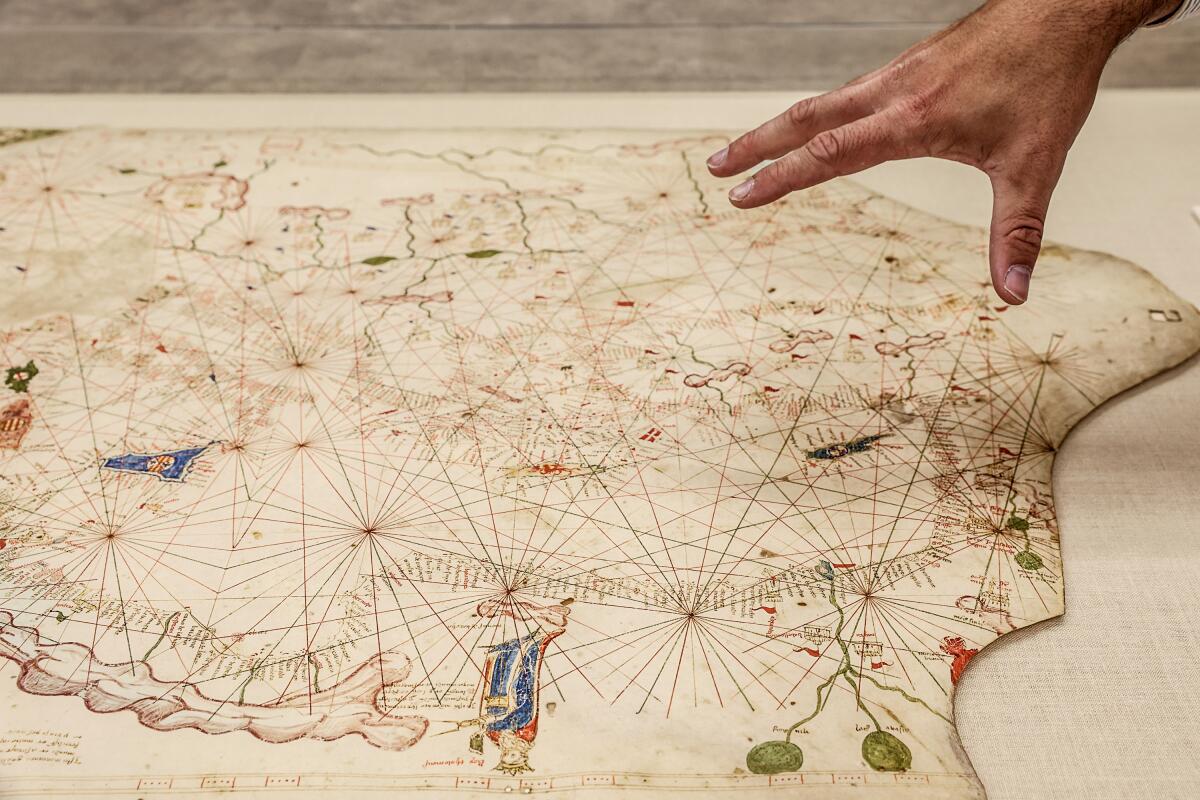
Map dealer Alex Clausen said certain details on this portolan chart offered clues that it was far older than the 16th century date listed at the Getty estate sale.
(Robert Gauthier / Los Angeles Times)

Clausen was deep in a virtual tour of an estate sale for oil heir Gordon Getty and his wife, Ann, an avid collector who died in 2020.
Tucked between a George II mahogany breakfront secretaire bookcase and a series of manuscript and watercolor maps showing the waterways of Venice, Clausen found a type of antiquated nautical map known as a portolan chart.

The chart, which the estate sale dated between 1500 and 1525, caught his eye: “It wasn’t like the chairs, lamps and things that surrounded it,” he said.
The estimated price, between $100,000 and $150,000, seemed fitting for a portolan chart from the 16th century.

But something didn’t quite fit.
The map seemed older.
 
The age of this nautical map precedes Columbus reaching the New World by 130 years.
Courtesy Of Barry Lawrence Ruderman Antique Maps Inc. Copyright Tess Cramer.

What unfolded became “the best story of a portolan chart, at least in the United States, in the years I’ve been chasing this subject,” said Richard Pflederer, an independent scholar who specializes in the topic.

Portolan charts are hand-drawn seafaring maps, typically drafted on animal skin, that were used during early exploration for navigation between ports.
They are known for distinctive rhumb lines that radiate out from various points in the ocean in the direction of wind or compass points to help navigators plot their course.
They often feature drawings of compass roses, flags, sea monsters and ships; unlike modern maps, interior details of land are not the key focus.

Among map collectors, Clausen said, portolan charts hold a special mystique, because they offer insight into the very earliest forms of mapmaking.
“There’s no two portolans really from this early phase that are the same,” he said.


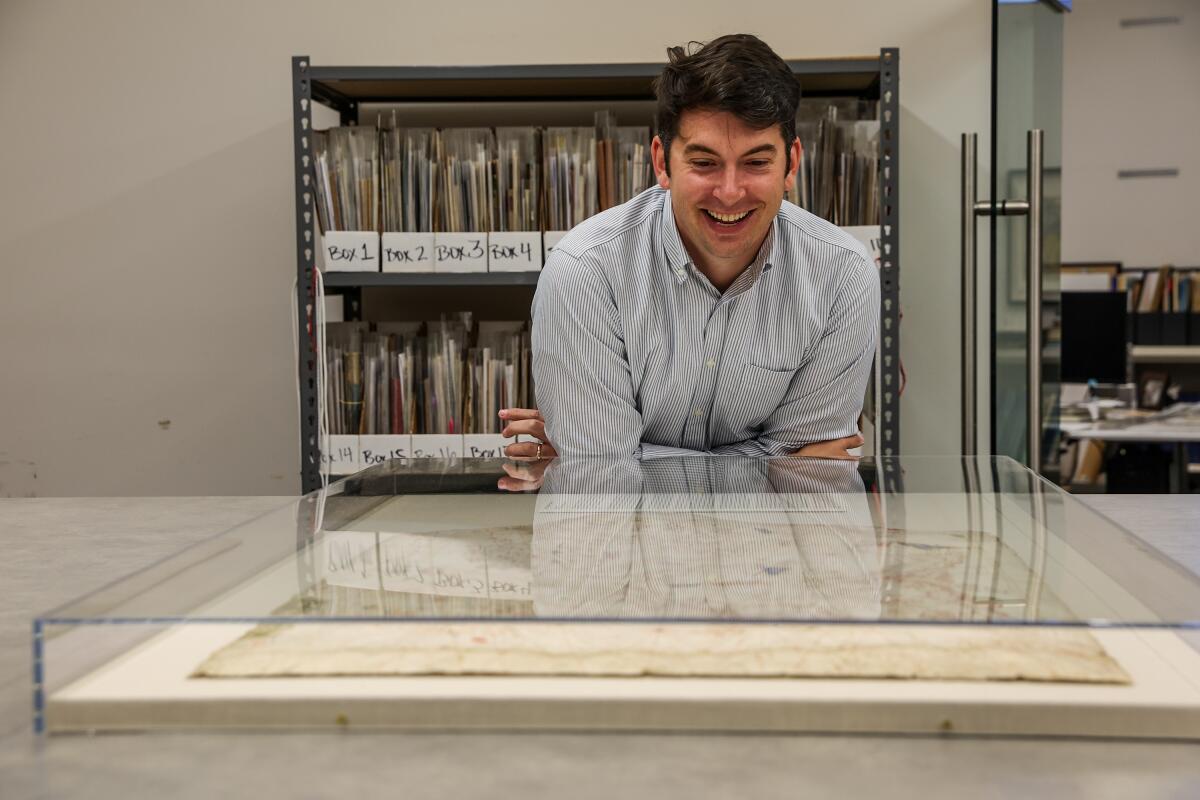
Clausen has made some impressive finds in his regular perusal of estate sales and auctions, but he says none compares to his discovery of a 14th century nautical map now listed for $7.5 million.
(Robert Gauthier / Los Angeles Times)


As Clausen examined the chart more closely via an online portal, the date just didn’t seem right.
Granada in southeastern Spain was labeled with a different flag than the other Spanish kingdoms in the Iberian Peninsula.
The detail that stuck out because Granada was home to the last holdout of the Moorish kingdom before surrendering to Spanish forces in 1492.
That would place the map, at latest, in the 15th century and not the 16th.

But finding out the exact age — and how much the chart was truly worth — took Clausen on a months-long historical journey.

The first known reference to the chart came from Italian scholar Pietro Amat di San Filippo, who saw the map in the library of a Corsini family palace in Florence in 1888 and included mention of it in an article he wrote for the Italian Geographic Society.
The scholar tentatively dated it from 1347 to 1354.
It changed hands several times before Ann and Gordon Getty purchased it in 1993.

The couple had the map restored and for years it hung in the library of their San Francisco townhouse.
They paid roughly 56,500 British pounds for the map, then the equivalent of about $85,000.
Nearly 30 years later, Clausen and the team from Barry Lawrence Ruderman purchased it for just over $239,000.
It ended up being a steal.
“It was truly hidden in plain sight,” said Barry Ruderman, Clausen’s business partner. 


Among map collectors, portolan charts hold a special mystique because they offer insight into the very earliest forms of mapmaking.
(Robert Gauthier / Los Angeles Times)


The chart extends from the islands of the North Atlantic Ocean to the Mongol empire’s Golden Horde in what is now Eastern Europe.
In the west, it shows the borders of the kingdoms involved in the Hundred Years’ War, featuring the most complete mapping of the British Isles at that time.
In the east, the chart shows the remnants of the Crusader strongholds and the final throes of the Byzantine Empire.

The clues initially led Clausen to suspect the map had been drawn around 1420.
He consulted with scholars and catalogers, including Pflederer, carefully omitting his hypothesis about the date.
After reviewing images of the map, a medievalist suggested it may date to the mid-1350s.
“I was just incredulous,” Clausen said of the revelation.
“We were talking about something that really only exists in a handful of national libraries.”

There’s only so much that can be seen through high-resolution images online, so Clausen went to see the chart in New York before the sale.
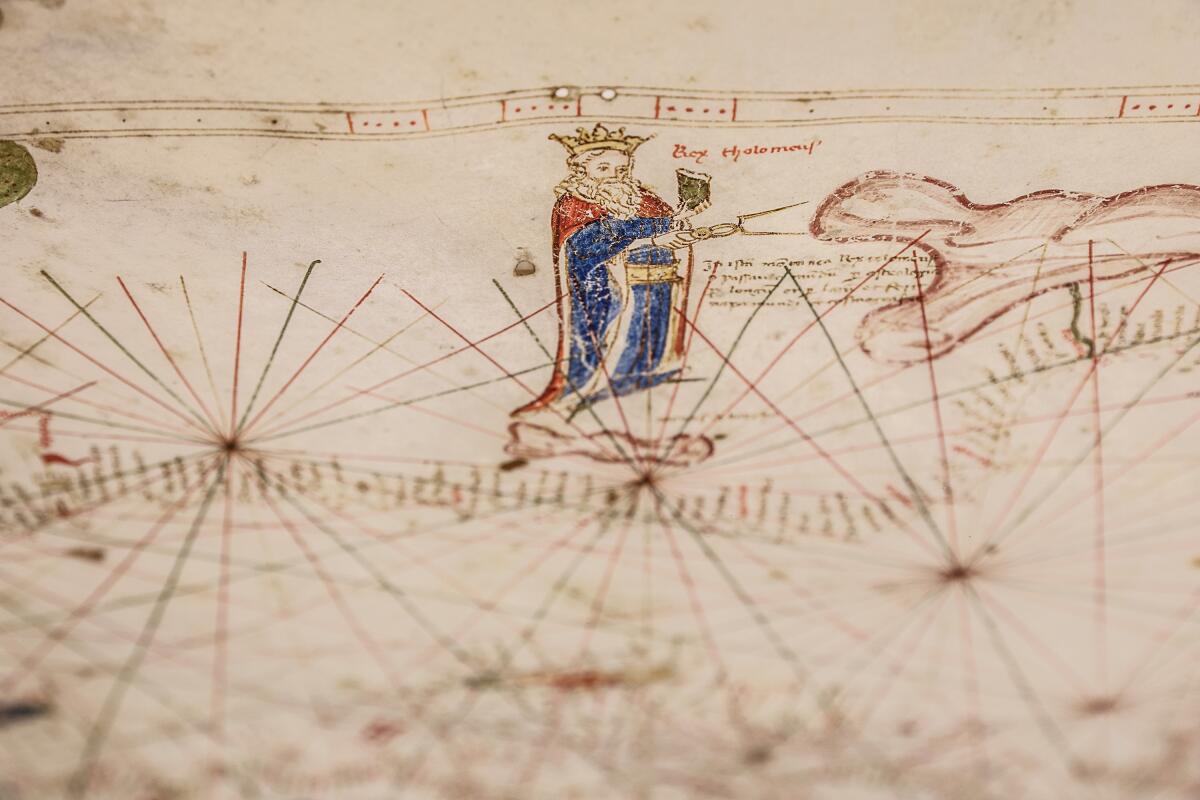
In particular, he wanted to get a better look at a portrait that Christie’s suggested was King Solomon.
When he examined the map, he saw the figure was actually an homage to the 2nd century geographer Ptolemy.

The crowned and bearded man is pictured holding a compass to the nearby Atlas Mountains in North Africa.
A Latin inscription next to him reads “In this mountain range, King Ptolemaeus uses a world-compass and through astrology, by longitudes and by latitudes, he constructed a mappa mundi and a cosmography.”

Clausen believes the chart’s author conflated Ptolemy with a dynasty of Greek kings who had ruled Egypt.

After the chart was purchased, Clausen sent it to a lab in New York that took a scientific approach to dating, analyzing pigments and performing carbon dating on a small piece of the parchment.
Through their tests, they determined the chart was created, on the early end, from the 1320s to the 1350s; and at latest from the 1390s to the 1420s.

By the time the artifact made it to San Diego, Clausen and his team had found scholarly articles dating to the 1880s that suggested the chart was created in the mid-1300s.
After hundreds of hours of research they finally had a date: 1360.

Making the discovery “was really rewarding from an intellectual perspective,” Clausen said, surveying the chart, which measures roughly 2.2 feet by 3.7 feet and is framed in a heavy case at his office in La Jolla.
“And, of course, it’s also rewarding from a commercial perspective, because it takes something that I think was a reasonable buy from what it was listed as and moves it into an absolutely different category.”

The Barry Lawrence Ruderman antique map shop is listing the chart, now dubbed the Rex Tholomeus Portolan Chart of 1360, for $7.5 million.
With such a price tag, it probably won’t attract a novice map collector.
Instead, Clausen envisions a university or museum taking ownership and placing it somewhere that people can enjoy and learn from it.

The chart is the only complete 14th century portolan known to exist outside Europe.
Although not the oldest portolan in existence, it is “an important data point in understanding the evolution of European cartography of the Mediterranean Sea and adjacent waters,” Pflederer said.

And it’s older than portolans displayed by the Huntington Library in San Marino, the Morgan Library and Museum in New York, the Newberry Library in Chicago and the Beinecke Rare Book and Manuscript Library at Yale University.
“It’s a bit of an Indiana Jones thing,” Ruderman, Clausen’s business partner, said of the experience.
“After over 30 years in the business, the greatest thrills are the discoveries which are truly unexpected, but for which you search and prepare your entire career.
You don’t know where or when, you simply prepare for the journey.”
 
Links :

Thursday, October 26, 2023

Rapid melting in West Antarctica is ‘unavoidable,’ with potentially disastrous consequences for sea level rise, study finds


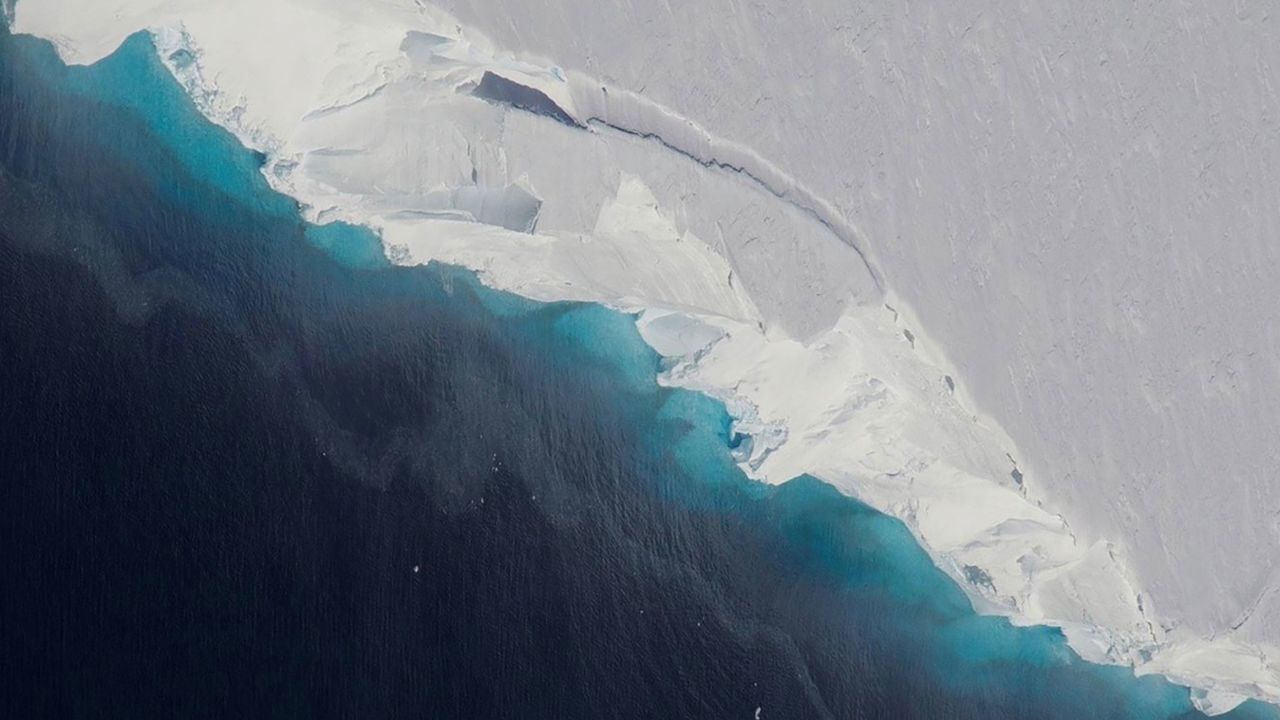
West Antarctica — home to the Thwaites Glacier, also known as the "Doomsday glacier" — is the continent's largest contributor to global sea level rise.Jeremy Harbeck/OIB/NASA

From CNN By Rachel Ramirez, CNN
 
Rapid melting of West Antarctica’s ice shelves may now be unavoidable as human-caused global warming accelerates, with potentially devastating implications for sea level rise around the world, new research has found.

Even if the world meets ambitious targets to limit global heating, West Antarctica will experience substantial ocean warming and ice shelf melting, according to the new study published Monday in the journal Nature Climate Change.

Ice shelves are tongues of ice that jut out into the ocean at the end of glaciers.
They act like buttresses, helping hold ice back on the land, slowing its flow into the sea and providing an important defense against sea level rise.
As ice shelves melt, they thin and lose their buttressing ability.

While there has been growing evidence ice loss in West Antarctica may be irreversible, there has been uncertainty about how much can be prevented through climate policies.
 

Significant melting of ‘Doomsday Glacier’ may be inevitable: Study
Loss of ice in the West Antarctic has been an area for concern.
 
 
The researchers looked at “basal melting,” when warm ocean currents melt the ice from beneath.
They analyzed the rate of ocean warming and ice shelf melting under different climate change scenarios.
These ranged from the ambitious, where the world manages to limit global warming to 1.5 degrees Celsius above pre-industrial levels, to the worst-case, where humans burn large amounts of planet-heating fossil fuels.

They found if the world limits temperature rise to 1.5 degrees Celsius, which it is not on track to do, climate change could still cause the ocean to warm at three times the historical rate.

Even significantly cutting planet-heating pollution now will have “limited power” to prevent warmer oceans from triggering the collapse of the West Antarctic ice sheet, the report found.

“It appears that we may have lost control of the West Antarctic ice melting over the 21st century,” said Kaitlin Naughten, an ocean modeler with the British Antarctic Survey and lead author of the study.

West Antarctica is already the continent’s largest contributor to global sea level rise and has enough ice to raise sea levels by an average of 5.3 meters, or more than 17 feet.
It’s home to the Thwaites Glacier, also known as the “Doomsday glacier,” because its collapse could raise sea levels by several feet, forcing coastal communities and low-lying island nations to either build around sea level rise or abandon these places, Naughten said.

While the study focused on ice shelf melting and did not directly quantify the impacts on sea level rise, “we have every reason to expect that sea level rise would increase as a result, as West Antarctica speeds up this loss of ice into the ocean,” Naughten said.

Ted Scambos, a glaciologist at the University of Colorado Boulder who was not involved with the study, said the findings are “sobering.” 
They build on existing research that paints an alarming picture of what’s happening to the planet’s southernmost continent, he told CNN
“The thing that’s depressing is the committed nature of sea level rise, particularly for the next century,” Scambos told CNN.
“People who are alive today are going to see a significant increase in the rate of sea level rise in all the coastal cities around the world.”

The only way to really stop the rapid ice melting, Scambos said, would be not just to cut levels of planet-heating pollution but also to “remove some that has already built up.” This will be “a real challenge,” he said.

Some scientists sounded a note of caution about the study.
Tiago Segabinazzi Dotto, senior research scientist at the National Oceanography Centre in the UK, said it should be “treated carefully” as it is based on a single model.

However, its conclusions do agree with previous research in the region, he told the Science Media Center, giving “confidence that this study needs to be taken in consideration for policymakers.”

Naughten and her colleagues acknowledged their study has limits — predicting future rates of melting in West Antarctica is very complex and it’s impossible to account for every possible future outcome.
But, looking at the range of scenarios, the report authors said they were confident the melting of ice shelves is now unavoidable.

“The question of doom and gloom is something I’ve spent a lot of time thinking about with this study, because how do you tell such a bad news story?” Naughten said.
“Conventional wisdom is supposed to give people hope, and I don’t see a lot of hope in this story,” she added, “but it’s what the science tells me and it’s what I have to communicate to the world.”

West Antarctic ice shelf melting is one impact of climate change “we are probably just going to have to adapt to and that very likely means some amount of sea level rise we cannot avoid,” Naughten said.

But although the outlook is dire, humanity cannot give up on slashing fossil fuel emissions, Naughten said.
Devastating impacts can still be avoided in other parts of Antarctica and the rest of the world, she noted.
 
Links :

Wednesday, October 25, 2023

The incredible historical map that changed cartography

 
From VisualCapitalist by Chris Dickert

In a one-paragraph story called On Exactitude in Science (Del Rigor en la Ciencia), Jorge Luis Borges imagined an empire where cartography had reached such an exact science that only a map on the same scale of the empire would suffice.

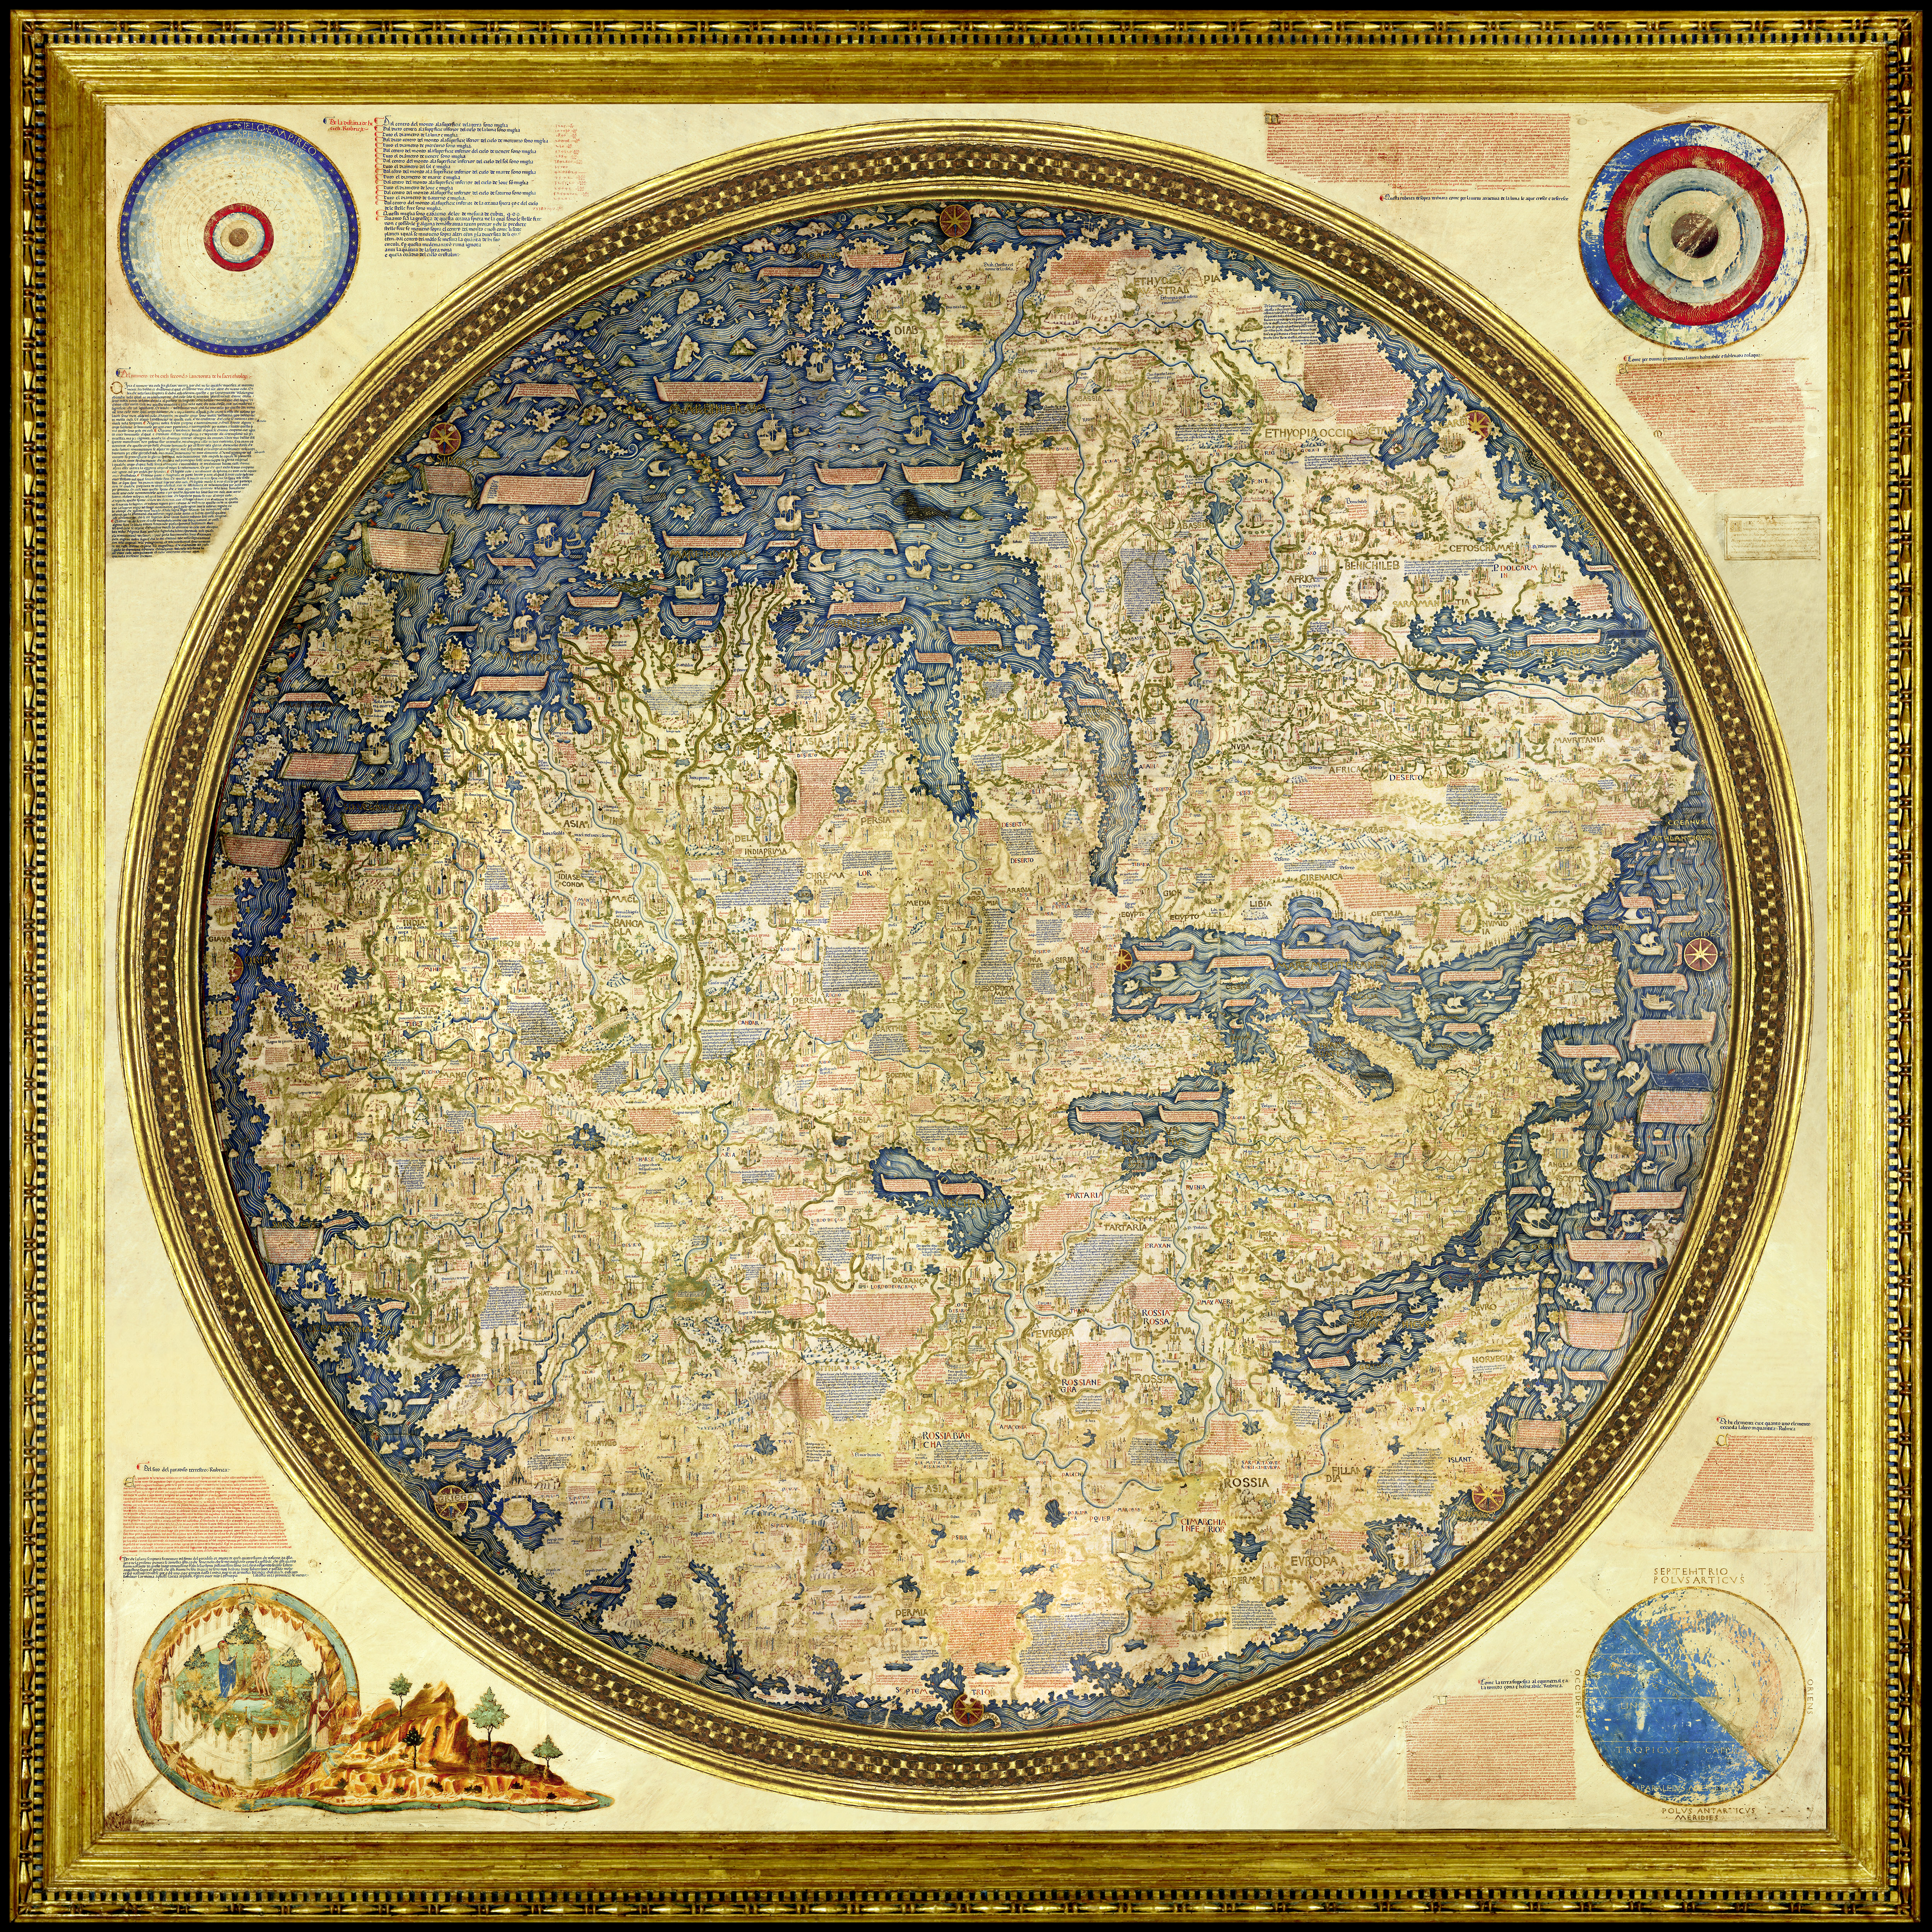
The Fra Mauro Mappa Mundi (c. 1450s), named for the lay Camaldolite monk and cartographer whose Venetian workshop created it, is not nearly as large, at a paltry 77 inches in diameter (196 cm).
But its impact and significance as a bridge between Middle Age and Renaissance thought certainly rivaled Borges’ imagined map.

One of ‘the Wonders of Venice’

Venice was the undisputed commercial power in the Mediterranean, whose trade routes connected east and west, stretching to Flanders, London, Algeria, and beyond.

This network was protected by fleets of warships built at the famous Arsenale di Venezia, the largest production facility in the West, whose workforce of thousands of arsenalotti built ships on an assembly line, centuries before Henry Ford.


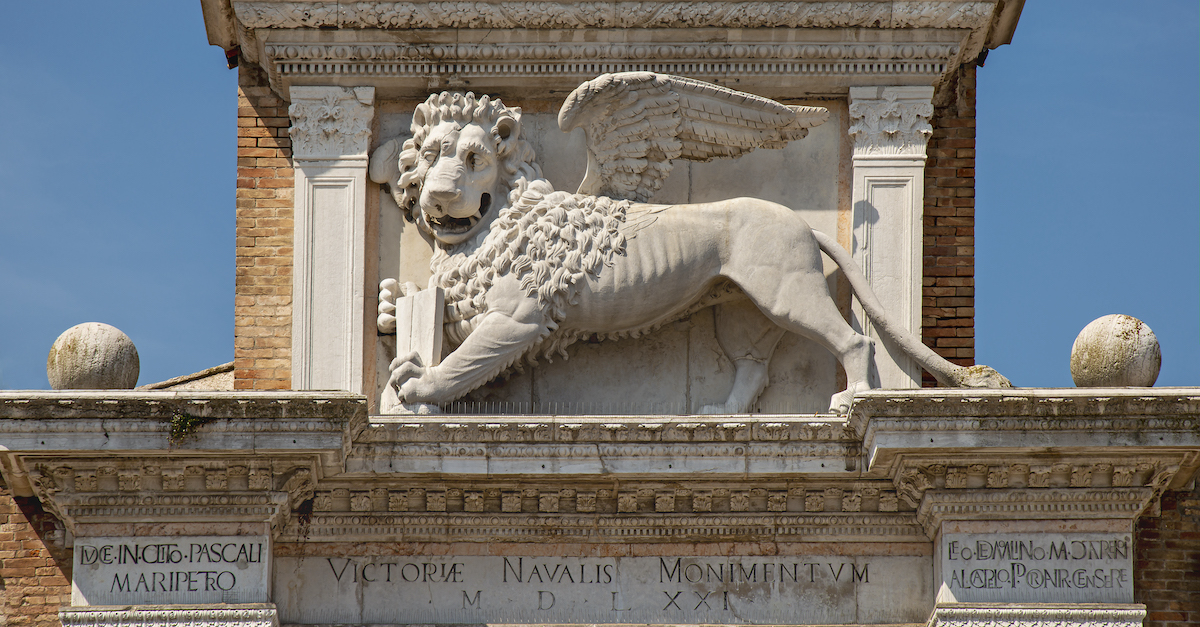
The lion of St Mark guards the land gate to the Arsenale di Venezia, except instead of the usual open bible in its hands offering peace, this book is closed, reflecting its martial purpose.
Source: Wikipedia

The Mappa Mundi (literally “map of the world”) was considered one of the wonders of Venice with a reputation that reached the Holy Land.
It is a circular planisphere drawn on four sheets of parchment, mounted onto three poplar panels and reinforced by vertical battens.

The map is painted in rich reds, golds, and blues; this last pigment was obtained from rare lapis lazuli, imported from mines in Afghanistan.
At its corners are four spheres showing the celestial and sublunar worlds, the four elements (earth, air, fire, and water), and an illumination of the Garden of Eden by Leonardo Bellini (active 1443-1490).

Japan (on the left edge, called the Isola de Cimpagu) appears here for the first time in a Western map. And contradicting Ptolemaic tradition, it also shows that it was possible to circumnavigate Africa, presaging the first European journey around the Cape of Good Hope by the Portuguese explorer Bartolomeu Dias in 1488.

NASA called the historical map “stunning” in its accuracy.

A Historical Map Between Two Worlds

Medieval maps, like the Hereford Mappa Mundi (c. 1300), were usually oriented with east at the top, because that’s where the Garden of Eden was thought to be.
Fra Mauro, however, chose to orient his to the south, perhaps following Muslim geographers such as Muhammad ibn Muhammad al-Idrisi.

Significantly, the Garden of Eden is placed outside of geographic space and Jerusalem is no longer at the center, though it is still marked by a windrose.
The nearly 3,000 place names and descriptions are written in the Venetian vernacular, rather than Latin.

At the same time, as much as Fra Mauro’s map is a departure from the past, it also retains traces of a medieval Christian worldview.
For example, included on the map are the Kingdom of the Magi, the Kingdom of Prester John, and the Tomb of Adam.


Isidore of Seville, Etymologiae (c. 600–625). 
Source: Wikipedia

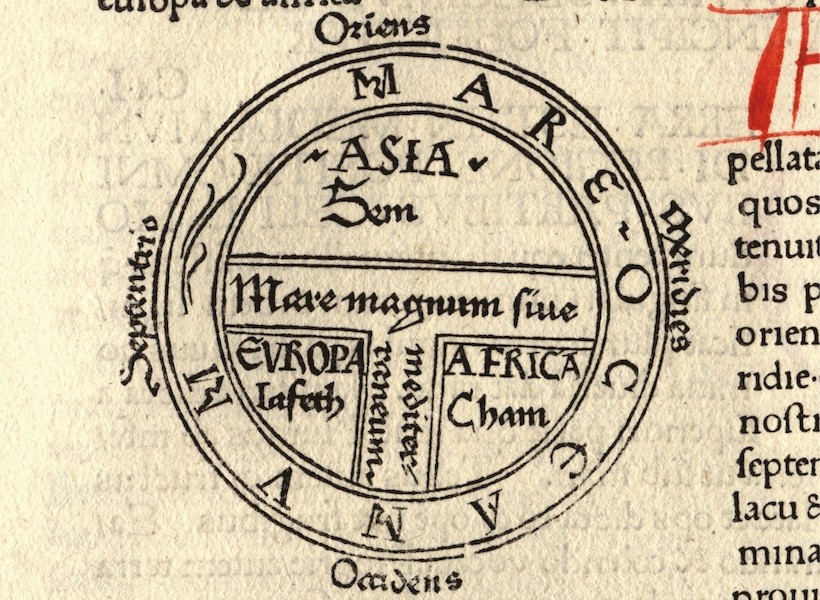
The circular planisphere also follows the medieval T-O schema, first described by Isidore of Seville, with Asia occupying the top half of the circle, and Europe and Africa each occupying the bottom two quarters (Fra Mauro turns the ‘T’ on its side, to reflect a southern orientation).
Around the circle, are many islands, beyond which is the “dark sea” where only shipwreck and misfortune await.

Fra Mauro’s Legacy

Fra Mauro died some time before 20 October 1459, and unfortunately his contributions fell into obscurity soon thereafter; until 1748, it was believed that the Mappa Mundi was a copy of a lost map by Marco Polo.

In 1811, the original was moved from Fra Mauro’s monastery of San Michele to the Biblioteca Nazionale Marciana, following the suppression of religious orders in the Napoleonic era, where it can be viewed today.

Two digital editions have also been produced by the Museo Galileo and the Engineering Historical Memory project, where readers can get a glimpse into a fascinating piece of cartographic history.
 
Links :

Tuesday, October 24, 2023

‘Voice of the sea’ may help albatrosses catch the perfect wind

Wandering albatrosses (Diomedea exulans) may use the inaudible “voice of the sea” to find the best flight paths.

From Science by Elizabeth Pennisi

Low frequencies emitted by crashing waves may guide the birds to wind conditions that keep them aloft on long-distance flights

Given that the wandering albatross can weigh more than a 2-year-old child, it has some heavy lifting to do as it flies over vast swaths of open ocean.
Finding good air currents can help, and these birds may search for them by listening for sounds that humans can’t hear.
Researchers tracking the paths of these long-distance fliers report today in the Proceedings of the National Academy of Sciences that the very low frequency noise made by clashing waves influences the birds’ headings.
The species joins a small but growing list of animals—including elephants, prairie dogs, and homing pigeons—that make use of such “infrasounds.”

The work is “of substantial significance,” says Tim Guilford, a zoologist at the University of Oxford who was not involved in the research.
The technology used to reach these conclusions is “part of a new era in [the] study of animal behavior and ecology.”

Researchers have long wondered how wandering albatrosses (Diomedea exulans), which can fly more than 10,000 kilometers over open ocean in a single trip, make these journeys.
Finding the right wind conditions, such as updrafts, to soar rather than flapping their wings, is key to conserving energy.
Large waves can help generate those critical wind conditions, and may provide the birds with a sonic hint to their presence.

Big waves produce a very low frequency sound, below 20 hertz and beyond the limits of human hearing, that can travel thousands of kilometers, particularly when they collide with long distance swells, such as when storms develop.
Samantha Patrick, an ecologist at the University of Liverpool was curious about whether the birds could key into these infrasounds—the “voice of the sea,” she calls it—to find the perfect wind.

On a previous trip, Patrick, postdoctoral researcher Natasha Gillies, and colleagues had traveled to Crozet Island off the coast of Antarctica, where these albatrosses breed, and outfitted 89 adult birds with GPS monitors that tracked the bird’s travels.
They retrieved the data 1 year later when the birds returned for another breeding season.
For a separate study, they collared the birds with biologgers containing tiny microphones that recorded the sounds, including infrasounds, the animals encountered.

For the new work, the researchers analyzed the GPS tracks, breaking them down according to whether the birds were resting, searching for food, or flying to a new location.
Geophysicists on the team combined the biologger recordings with infrasound monitoring data from Kerguelen Island in the Southern Ocean to build “soundscape” maps on the birds’ journeys.

During their long-distance flights, the birds tended to change course whenever they encountered a loud infrasound, the team reports.
The infrasounds often indicate wave turbulence, even storms—though it’s not yet clear how the birds make use of this information.
The infrasound clearly impacted the birds’ behavior, although the scientists couldn’t identify a clear pattern of whether they avoided or aimed for these low frequencies.

Still, scientists think the sounds provide “a mechanism by which albatrosses may be able to identify favorable areas ‘on the fly,’” says Nathan Putman, an ecologist at environmental research company LGL Ecological Research Associates, who was not involved with the work.
Especially on the open ocean, where there are few landmarks to navigate by, “it certainly seems likely that other birds could make use of this persistent environmental [cue].”

It’s a compelling idea, agrees Lesley Thorne, an ecologist at Stony Brook University who was not involved with the work.
“But I don’t think it can explain everything” about albatross navigation, she says.
“[The birds] are probably using a number of cues to navigate.”

Patrick and colleagues agree more work is needed to test the albatrosses’ hearing and learn how the birds incorporate infrasound into their other navigational tools, such as vision and olfaction.
Guilford would like to see additional work investigate how albatrosses compose mental maps of their environment and whether infrasound plays a key role.
This is “just the first step towards demonstrating that these birds are really using infrasound,” he says.
 
Links :