Every year TeleGeography creates a new global undersea cable map.
TeleGeography's Submarine Cable Map 2015
was a particularly wonderful map.
The 2015 map was inspired by medieval
and renaissance cartography and featured some wonderful map border
illustrations and even a number of beautifully drawn sea monsters.
For the 2016 edition of its Submarine Cable Map
TeleGeography has designed a much more modern looking and information
rich map.
The main map shows 321 undersea cable systems around the
world, while a number of smaller inset maps depict some of the world's
busiest landing stations.
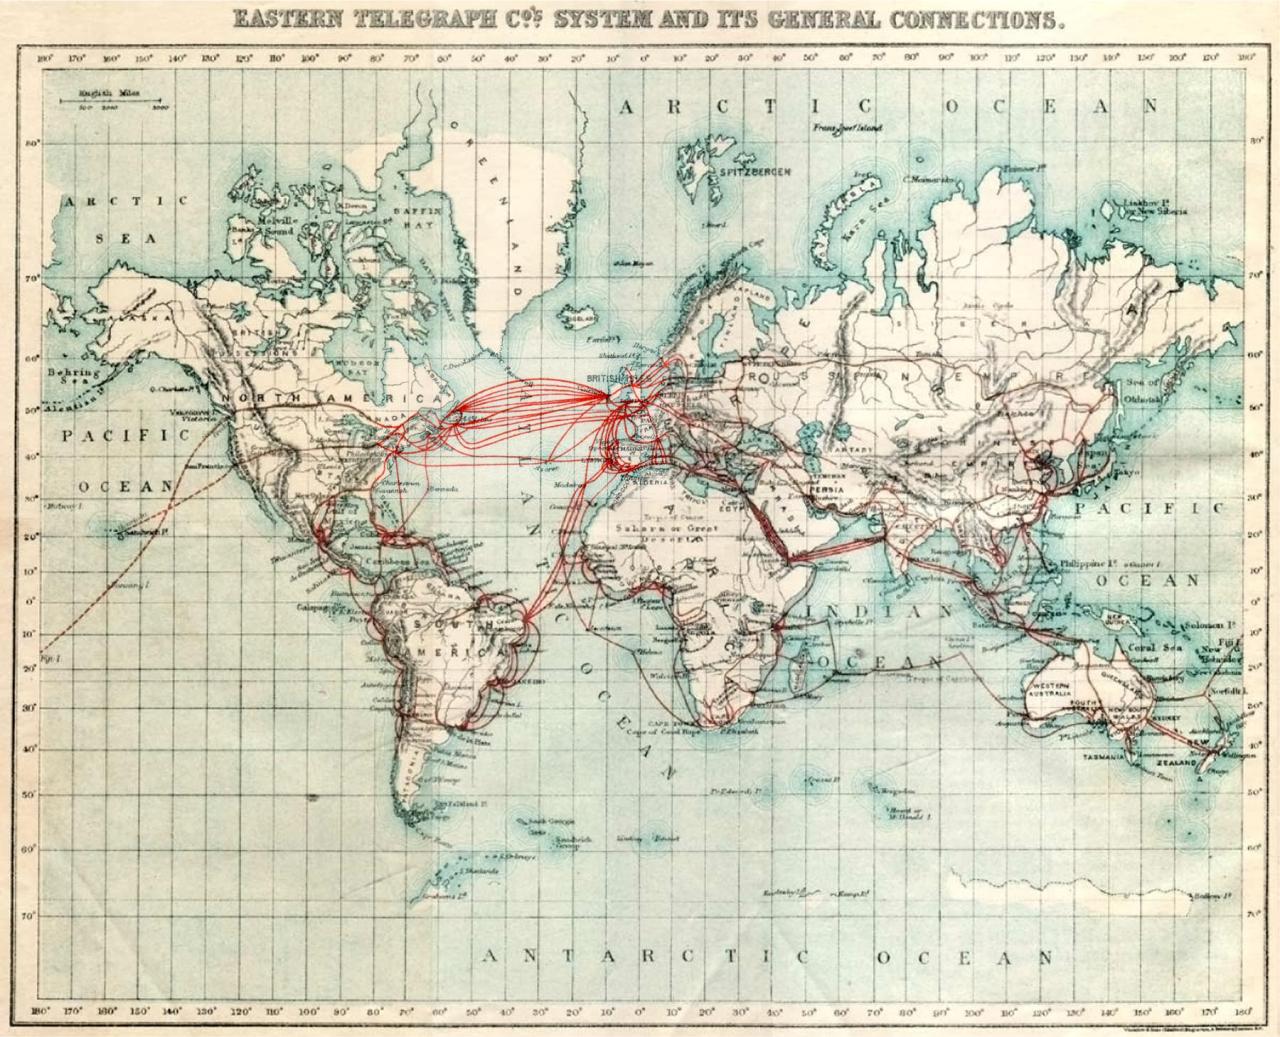
Locations of all copper telegraph cables around the world in 1877.
Countries on the map are colored to show how many submarine cable system
links are connected to each country.
Infographics along the bottom of
the map provide additional information on the capacity of the major
global cable routes around the world.
The Submarine Cable Map 2016 is certainly not as much fun as the 2015
edition.
However TeleGeography's latest map does provide a lot more
information about the world's submarine cable networks and is
consequently a lot more informative.
Hurricane Sandy's near-surface winds are visible in this NASA GEOS-5 global atmosphere model computer simulation that runs from Oct. 26 to Oct. 31, 2012.
When a hurricane, flood, heat wave, or other extreme weather event
strikes, reporters call scientists like me and ask us what human-induced
climate change had to do with this event.
Until recently, most of us
would say something like this: “Climate change is real. It alters the
broader patterns, the statistics of weather. But we can’t attribute any
single weather event to climate change.”
We are starting to
respond differently.
A new area of scientific research, known as
“extreme event attribution”, has emerged to provide more substantive and
quantitative answers.
Our science has reached the point where we can
look for the human influence on climate in single weather events, and
sometimes find it.
Today, the National Academy of Sciences released the report, “Attribution of extreme weather events in the context of climate change“,
which concludes it is now “often possible” to describe how
human-induced climate change altered the likelihood and/or intensity of a
specific extreme weather event.
The report was written by a panel of
climate scientists who have studied linkages between climate change and
extreme weather, in which I was honored to participate.
One
of the questions that motivated this report is: “Did climate change
cause this event?”
This is a question we hear frequently after
devastating instances of extreme weather.
We’ve never been able
to provide a satisfying answer and we still can’t because the question
is ill-posed.
No weather event has a single cause.
Each event has many
causes, and most of them are natural.
Climate change is one influence
among many, and it can be a subtle one.
But the report makes
clear that we now can begin to provide meaningful responses to the
following kinds of questions: “Did climate change make a heat wave like
this more likely to occur, and if so by how much?”
Or, “Given that a
storm like this occurred, did climate change make it more intense?”
Model simulations spanning 140 years show that warming from carbon dioxide will change the frequency that regions around the planet receive no rain (brown), moderate rain (tan), and very heavy rain (blue).
The occurrence of no rain and heavy rain will increase, while moderate rainfall will decrease.
Credit: NASA's
The answers can depend on how they are framed, as much as they depend
on the specifics of the event.
But at least in some cases, substantive,
quantitative answers to these questions are possible.
We obtain
those answers by comparing the event that just happened to a
reconstruction of what might have happened if humans hadn’t changed the
climate.
In one common method, scientists perform many realistic
computer model simulations, over long times (in computer years), of both
the present climate, and the climate of a hypothetical, cooler world
without human influence.
In each climate, they count how often events
occur that are similar to the one that happened in the real world.
If
they happen twice as often (say) in the simulated present climate as in
the hypothetical climate without humans, then we say that human-induced
climate change made the event twice as likely as it would have been
otherwise.
Of course, the results could also show that the event is
about equally likely in both climates, or less likely in the present
climate (as is generally true for extreme cold snaps).
Or the
results could be inconclusive.
Even the best model may not be good
enough to capture some events with sufficient accuracy, and then we just
can’t draw useful results about those events from it.
Or we may not
understand well enough how some kinds of extreme weather are influenced
by climate change, in which case we won’t trust what models tell us even
if it looks plausible otherwise.
The necessary understanding should
depend on multiple lines of evidence, including historical observations
and our knowledge of the basic physics of the events.
As a rule,
we can do better with the events that are the most directly related to
temperature, since then the chain of causality from global warming to
the event is shortest and simplest.
We can make the strongest
attribution statements about heat waves, in particular.
(National Academy of Sciences, 2016)
We can say very little (yet) about the climate change influence on
tornadoes, because our models don’t yet have enough resolution to
simulate them (like a digital camera with too few pixels to see
someone’s face from far away), their relation to temperature is
indirect, and not enough research has been done for us even to be sure
how they should be changing.
Other kinds of events – such as floods,
droughts, and hurricanes – are somewhere in between.
Though
attribution science is advancing quickly, it’s still new, and some
scientists are uneasy about it. Some are concerned that it politicizes
weather disasters by making them into climate change stories.
I have
been concerned, on the other hand, that stories focused on attribution
in the wake of weather disasters can send misleadingly skeptical
messages about climate change as a whole.
Climate science works best with patterns.
Determining climate
change’s role in a single event is usually more difficult than doing so
in global statistics.
It can be hard to be sure that exposure to small
amounts of a chemical caused cancer in a single patient, even when
studies of large populations prove that it is a carcinogen; similarly,
we often can’t make strong attribution statements about an individual
weather event, even when we have a lot of evidence that those kinds of
events overall are influenced by climate change, or will be in the
future.
So media coverage of attribution studies sometimes ends up
focusing more on what we don’t know than what we do.
That can leave the
impression that we know less than we really do, which is unhelpful in a
political climate which already doesn’t take the real one seriously
enough.
But attribution studies help to close the gap between the
widespread notion of climate change as distant and the real need for us
to act on it now.
Real extreme weather events get people’s attention.
Sometimes, some of that attention lands on broader issues around climate
change that are overdue for it.
When “Superstorm” Sandy struck, for
example, it started a critically important public conversation about sea
level rise and other climate change impacts on the New York
metropolitan area.
Now, some of the most important aspects of
this conversation don’t actually require us to say to what extent
climate change influenced Sandy.
(For the record, though,
climate-related sea level rise increased the depth of the flood waters
by about eight inches.)
We should be planning for climate change based
on our best projections of the future, and single events don’t change
those – the fact that Sandy occurred doesn’t change the probability of
the next one.
And even if the evidence doesn’t indicate a
significant human influence on a particular recent event, our lived
experience of that event can provide a needed vision of what changes may
be coming in the future, and an indication of our vulnerability to
those changes.
But it is natural to try to see climate change
through the lens of individual weather events, and to ask straight up
how they are related.
Our ability to answer is improving quickly,
allowing us to grasp more profoundly what is happening to our planet in
real time.
Echo Voyager, Boeing’s latest unmanned undersea vehicle (UUV), can operate autonomously for months at a time thanks to a hybrid rechargeable power system and modular payload bay.
The 51-foot-long vehicle is the latest innovation in Boeing’s UUV family, joining the 32-foot Echo Seeker and the 18-foot Echo Ranger.
Boeing introduced Echo Voyager, its latest unmanned,
undersea vehicle (UUV), which can operate autonomously for months at a
time thanks to a hybrid rechargeable power system and modular payload
bay.
The 51-foot-long vehicle is not only autonomous while underway, but
it can also be launched and recovered without the support ships that
normally assist UUVs.
Echo Voyager is the latest innovation in Boeing’s
UUV family, joining the 32-foot Echo Seeker and the 18-foot Echo Ranger.
“Echo Voyager is a new approach to how unmanned undersea vehicles
will operate and be used in the future,” said Darryl Davis, president,
Boeing Phantom Works.
“Our investments in innovative technologies such
as autonomous systems are helping our customers affordably meet mission
requirements now and in the years to come.”
Echo Voyager is the newest member to join Boeing’s
unmanned undersea vehicle family.
The 51-foot vehicle is designed to
stay underwater for months at a time.
Echo Voyager will begin sea trials off the California coast later
this summer.
Boeing has designed and operated manned and unmanned deep
sea systems since the 1960s.
“Echo Voyager can collect data while at sea, rise to the surface, and
provide information back to users in a near real-time environment,”
said Lance Towers, director, Sea & Land, Boeing Phantom Works.
“Existing UUVs require a surface ship and crew for day-to-day
operations. Echo Voyager eliminates that need and associated costs.”
In 2016 Boeing celebrates 100 years of pioneering aviation
accomplishments and launches its second century as an innovative,
customer-focused aerospace technology and capabilities provider,
community partner and preferred employer.
Through its Defense, Space & Security
unit, Boeing is a global leader in this marketplace and is the world's
largest and most versatile manufacturer of military aircraft.
Headquartered in St. Louis, Defense, Space & Security is a $30
billion business with about 50,000 employees worldwide
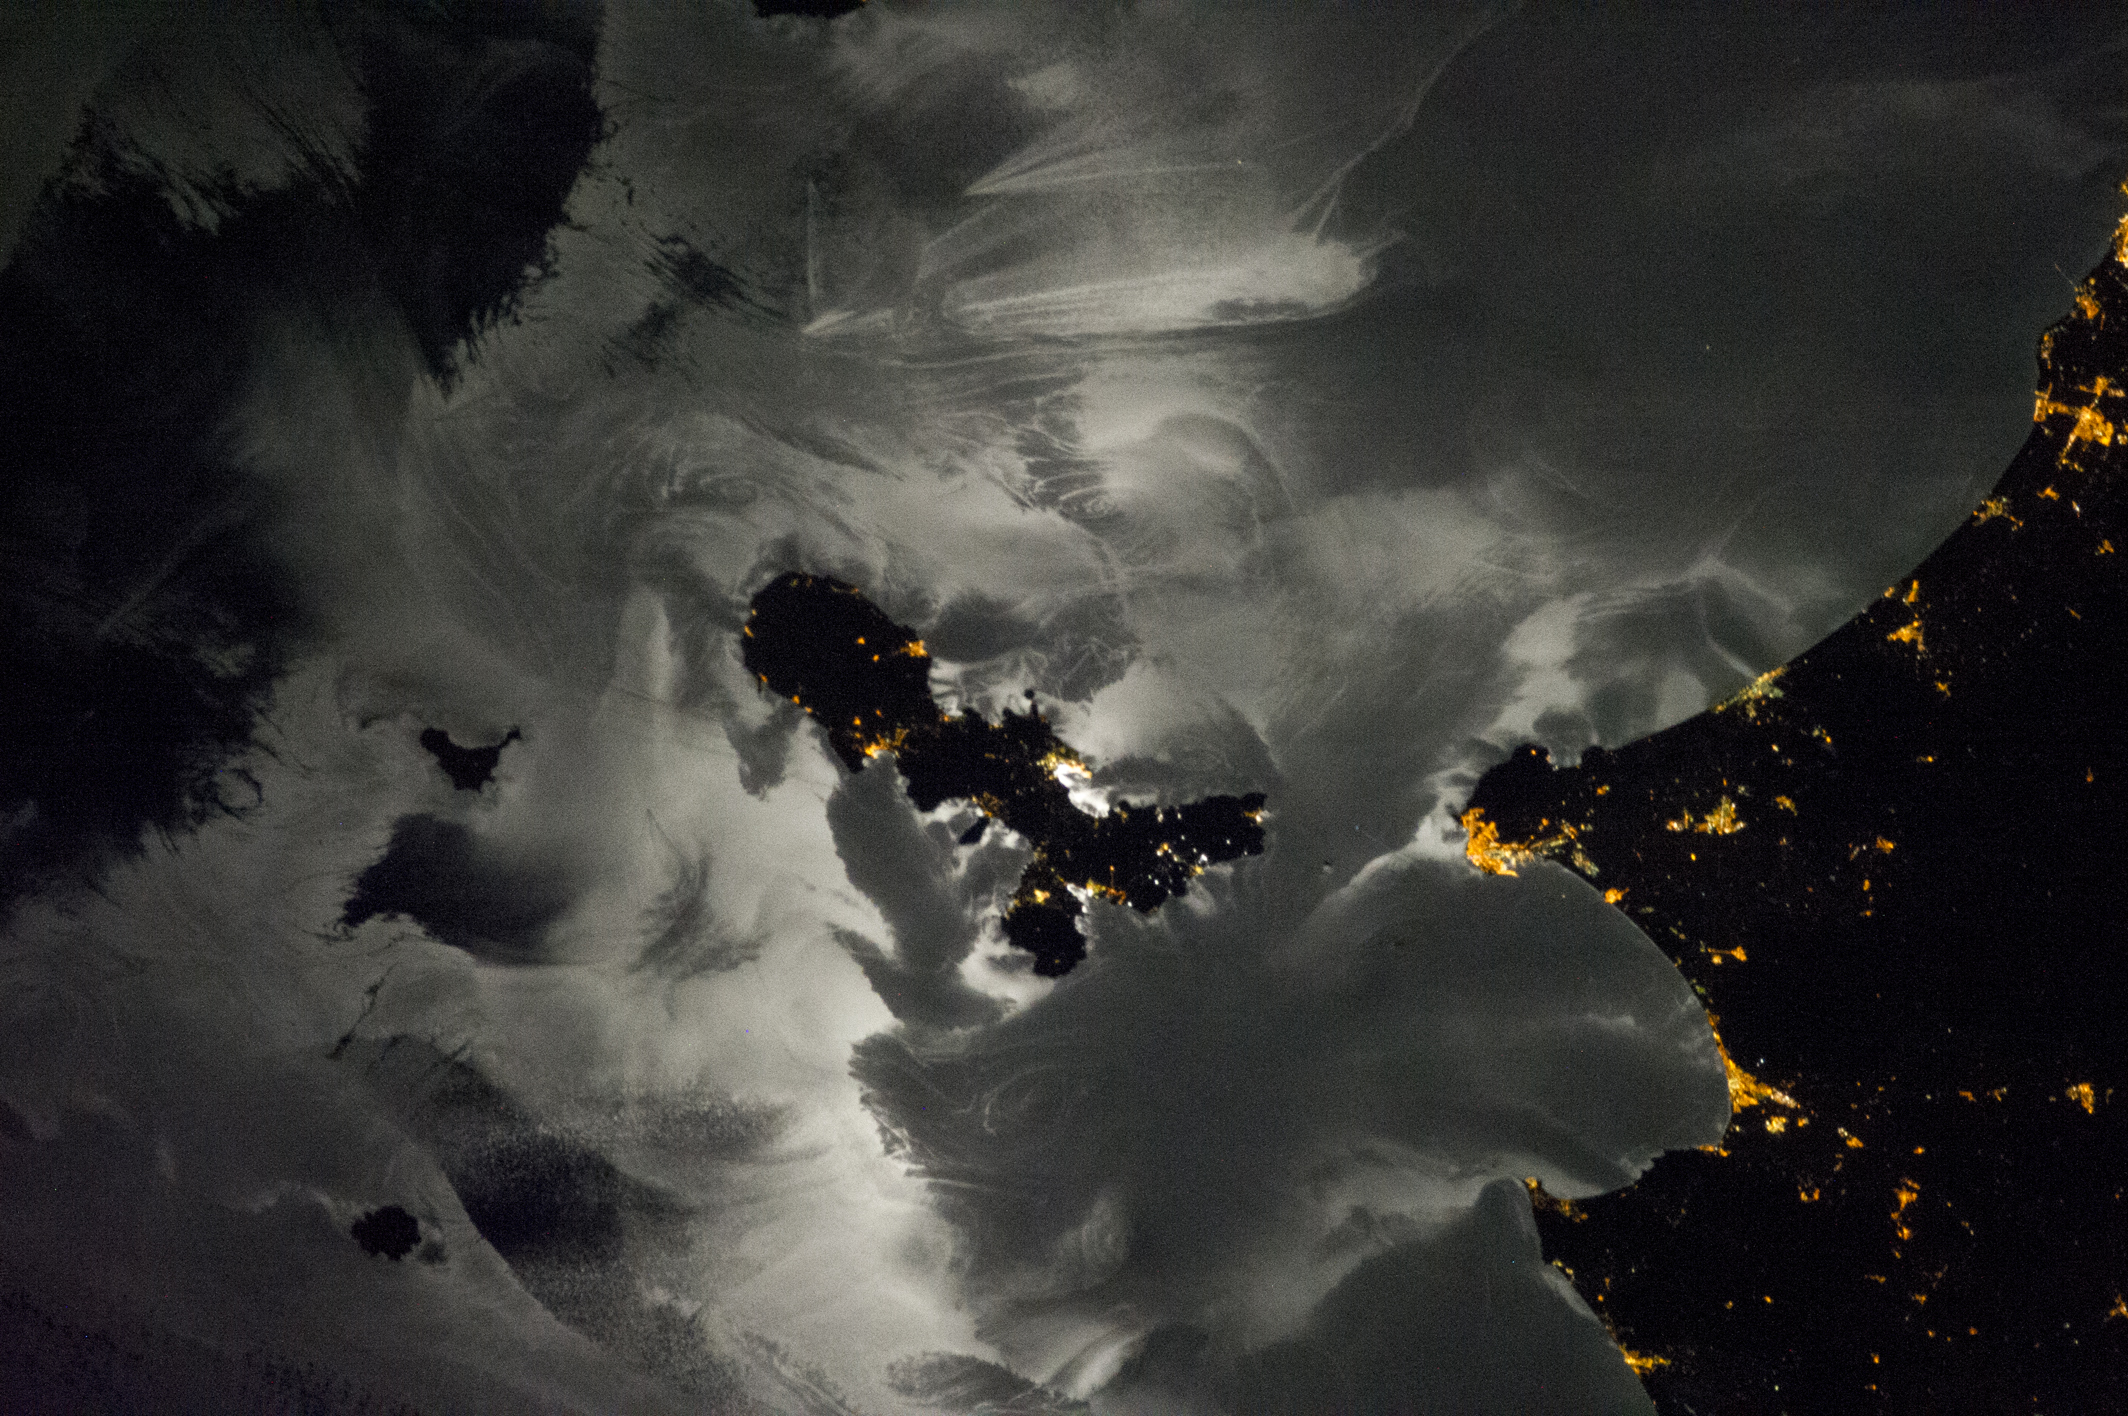
When an astronaut aboard the International Space Station trained a
camera on a picturesque view of the northern Mediterranean Sea, the
space flyer instead captured a unique effect created by the reflection
of the moon on the surface of the water.
The astronaut's "moon glint" photo shows the twinkling lights of
coastal Italian towns and islands of the northern Mediterranean obscured
by what looks like dark brushstrokes reminiscent of sweeping clouds.
Sunlight can reflect off the surface of water or snow, and when the
light hits at a certain angle, it creates a glare on the material's
surface.
This glare is something that scientists call "sun glint," and
it happens according to a mathematical concept called the bidirectional
reflectance distribution function (BRDF), according to NASA's Goddard Space Flight Center in Greenbelt, Maryland.
It turns out that moonlight can do the same thing.
When light from the
moon reflects off the surface of a large body of water or ice at
particular angles, it also creates a glare (or glint) of light, according to a blog post from the Cooperative Institute for Research in the Atmosphere (CIRA) at Colorado State University.
When moonlight reflects from the sea, as it has done in this image, it can reveal complex patterns on the sea surface, NASA said.
These patterns typically come from a combination of different natural
processes and traces left behind by human activities, the agency said.
In this image, for example, it is possible to see wave patterns
trailing behind passing ships in a characteristic V-shaped pattern north
of the island of Elba, NASA said.
A meandering line coming off
Montecristo island is an "island wake," which results from alternating
masses of whirling air that develop on the downwind side of the island.
Dark areas of the sea surface — indicating rougher water, in this case —
can sometimes make islands, such as Montecristo and Pianosa, harder to
see, NASA said.
In contrast, areas protected from wind and turbulence
usually appear brighter because their smoother surfaces act as a better
mirror for moonlight, the agency explained.
The sea surface also
displays numerous tight swirls known as gyres, which show large
water-circulation patterns in the sea, NASA said.
The astronaut's image is made all the more compelling by the sprinkling
of lights from nearby cities, such as Piombino and Punta Alta.
The
cities' golden glow turns this already otherworldly picture of Earth's
Mediterranean Sea at night into something truly magical.