Saturday, July 30, 2022

Mysterious seafloor holes stump ocean scientists


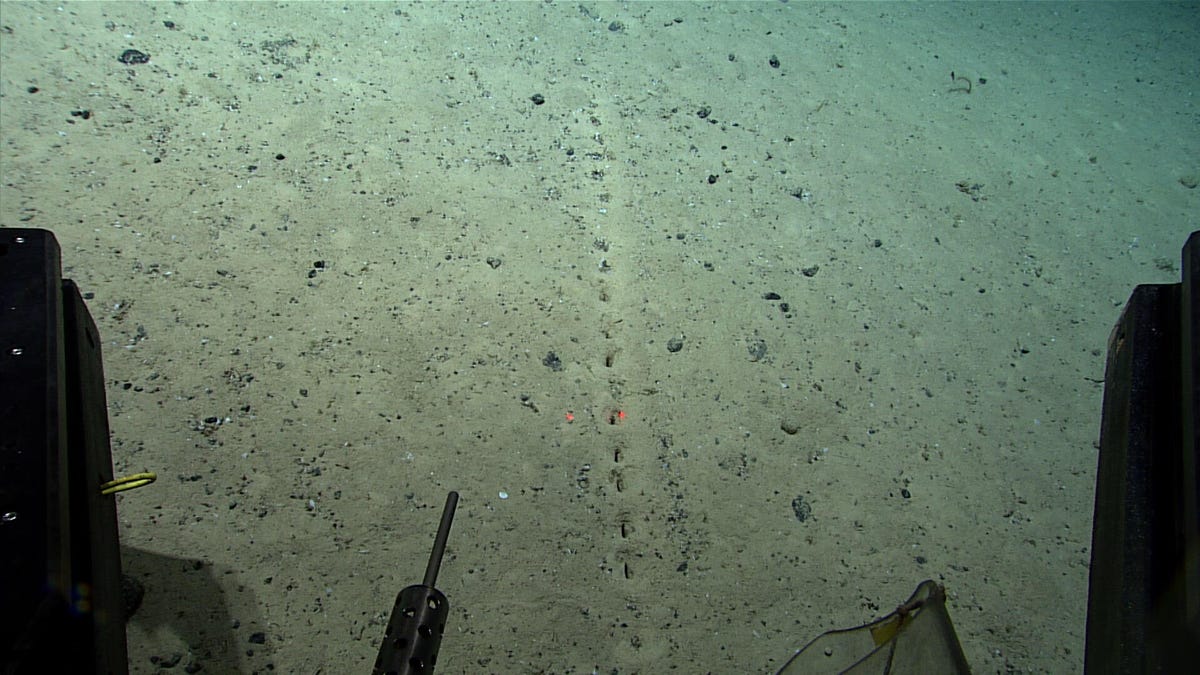
NOAA's ocean explorers spotted these regular, perforation-like holes in the seafloor.
NOAA


From CNET by Amanda Kooser

Sea monster? Aliens? Humans? Give it your best guess.

Talk about the mysteries of the deep.
The crew of the National Oceanic and Atmospheric Administration's Okeanos Explorer vessel caught sight of some weird hole formations on the Atlantic seafloor over the weekend.
 
What caused them?
Even NOAA's scientists aren't sure.

Okeanos Explorer is investigating the Mid-Atlantic Ridge, a largely unexplored area of seafloor that's home to a massive underwater mountain range.
The team is mapping the ocean bottom and studying coral and sponge communities.
NOAA often livestreams the ship's remote-operated vehicle dives.

"On Saturday's Okeanos dive, we saw several sublinear sets of holes in the seafloor.
The origin of the holes has scientists stumped," the NOAA ocean team tweeted on Monday.
"The holes look human made, but the little piles of sediment around them suggest they were excavated by...something."
NOAA asked for Twitter users to chime in with their own ideas to explain the holes.
 

NOAA said similar holes had been reported in the region before.
Twitter users naturally had some thoughts on the matter, suggesting the perforation-like holes could be from fishing gear, a hidden crack in the seafloor or a piece of buried pipe.
On the animal-related front, some suggested a burrowing or swimming critter might have left the small marks.

Here's a closer look at some of the indentations, which seem to be almost rectangular.
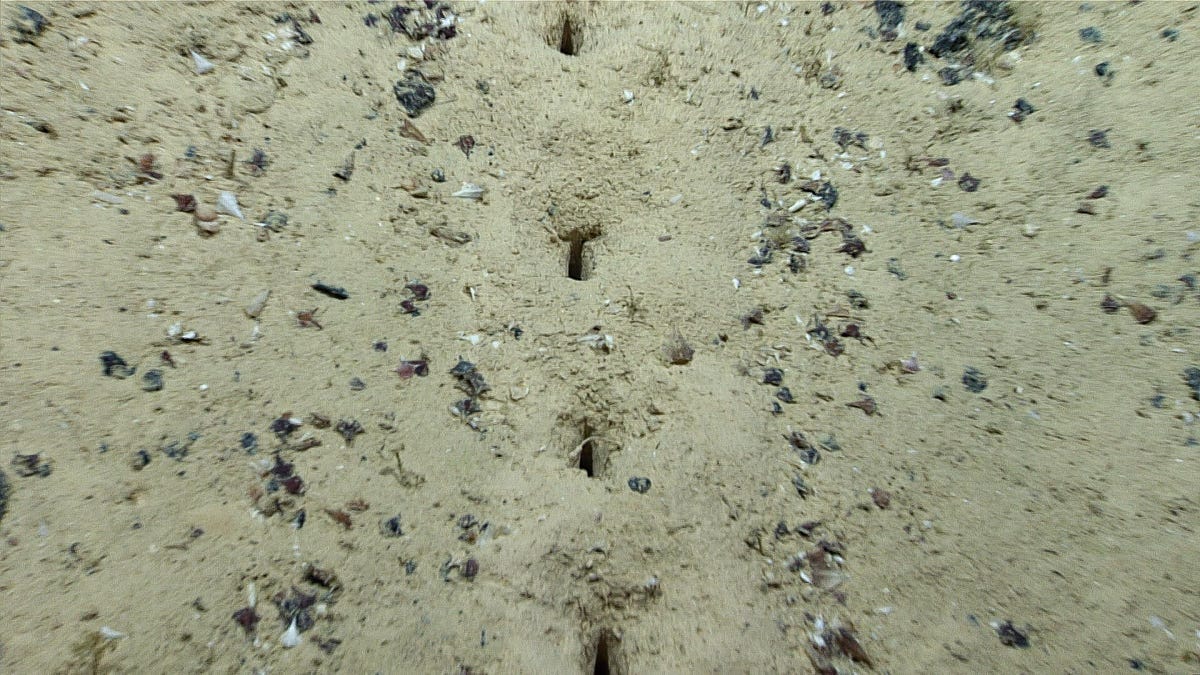

Here's a closer look at those mysterious seafloor holes.NOAA

There were some more fanciful responses, like "a really big graham cracker" and "ants." One person joked it might be aliens.

The intrigue is reminiscent of when a different exploration vessel spotted a "yellow brick road" formation on the seafloor of the Pacific earlier this year.
That one had a good explanation connected to volcanic action.

The Atlantic holes will remain an enigma for now, but maybe it's time for an underwater X-Files division.
A deep-sea Scully should be able to sort this out.
 
Links :

Friday, July 29, 2022

How a satellite found a tiny island—and made Canada a bit bigger

Landsat 1, launched in July 1972, was the first satellite designed to study Earth from orbit.
The spacecraft is seen here in flight configuration with its solar panels deployed at the former GE plant in Valley Forge, Pennsylvania.

From National GeoGraphic / NG by Nadia Drake
 
Discovered only about 50 years ago, Landsat Island off the country's Atlantic coast bears the name of the world's first Earth-observing satellite program.

Squint closely at a map of the North Atlantic, off the eastern coast of Canada’s Newfoundland and Labrador Province, and you’ll see … well, nothing.
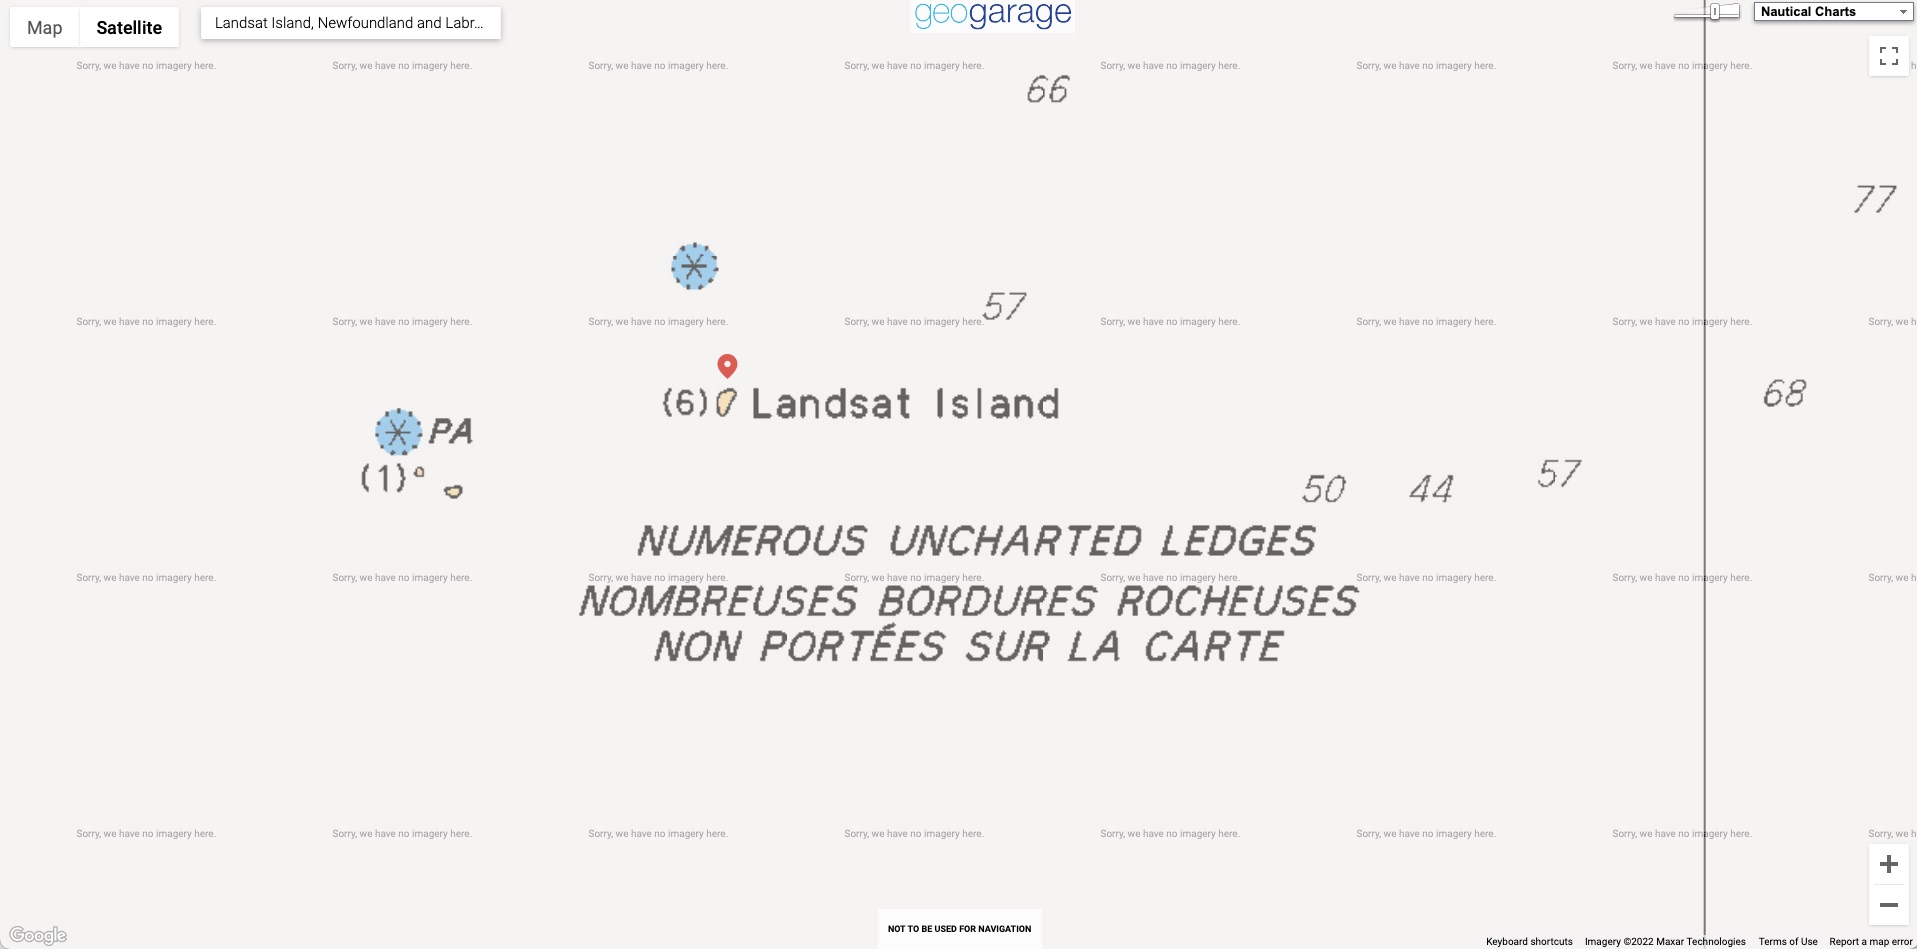
The uninhabited island that should be there is too tiny for even Google Maps to display.

not viewable on Google Maps or Google imagery
but viewable with the GeoGarage platform with CHS nautical raster chart
In 1976, a Canadian coastal survey was carried out using data from the Landsat 1 satellite.
Analysis of the data revealed several previously uncharted features; this includes Landsat Island, which was subsequently named after the satellite.
Verification of the island's existence fell to Dr. Frank Hall of the Canadian Hydrographic Service:
[Dr. Hall] was strapped into a harness and lowered from a helicopter down to the island.
This was quite a frozen island and it was completely covered with ice.
As he was lowered out of the helicopter, a polar bear took a swat at him.
The bear was on the highest point on the island and it was hard for him to see because it was white. Hall yanked at the cable and got himself hauled up.
He said he very nearly became the first person to end his life on Landsat Island.
— From Scott Reid's account of Dr. Hall's Landsat Island expedition given to the Canadian Parliament on October 30, 2001.
Following Dr. Hall's encounter with the polar bear, it was suggested that the island be named "Polar Island,"but the present name was retained.
Landsat Island marks the easternmost point of the Canadian land mass along this section of the Labrador coast.
As such, its discovery increased Canada's maritime territory by 68 square kilometres (26 sq mi). 
 
or with CA476682
ENC from CHS
 

But nearly 50 years ago NASA’s first Earth-observing satellite, a joint project with the U.S. Geological Survey, picked up the island’s spectral signature from more than 500 miles high. The discovery increased Canada’s territorial area by 26.25 square miles—a modest expansion that nonetheless heralded an exciting accomplishment for the program today known as Landsat.
In 1979 the outcrop was officially named Landsat Island, after the revolutionary eye-in-the-sky that had spotted it.

“It just totally changed the field of cartography,” Terry Sohl, a researcher with the USGS Earth Resources Observation and Science Centre, says of the program.

NASA might be better known for looking up at the stars, but the space agency’s satellites have also been staring down at our home world for half a century.

Inspired by the space-based imagery of Earth returned during the Mercury and Gemini flights, the Earth Resources Technology Satellite took flight on July 23, 1972.

A few years later, it would become known as Landsat 1. Still managed by NASA and the USGS, the Landsat program has become the longest-running Earth-observation enterprise in history.


Landsat Island, as photographed from a Canadian Coast Guard helicopter in 1997.
Photograph by David Gray


“If you think back to the mid-60s, the space race was going on, the U.S. public was enamoured with what was happening, and it was a unique idea to use that technology not only for military applications but to turn those cameras around and look at what’s happening on the Earth’s surface,” Sohl says. “People really didn’t know what to expect.”

Since 1972, nine Landsat satellites have populated Earth’s skies (although one—Landsat 6—didn’t reach orbit).
Today three of them loop around the planet in polar orbits, staring at 115-mile-wide swaths of land and making highly detailed measurements.
Every 16 days the same spots get another look by the same satellites.
So over five decades of Earth-gazing, Landsat has compiled the most detailed record ever of our planet’s changing face.

“It has been a great program of discovery,” says NASA’s James Irons, who’s been a leader of the Landsat program for decades.
“At the time of the Landsat 1 launch, not all of Earth was well mapped—the data were quite thin.”

And that set the stage for cartographer and pilot Elizabeth Fleming to use Landsat data to make an unusual mark on history.

The pixel that expanded Canada


In 1973 a Canadian coastal survey decided to use Landsat data to better map the country’s sparsely charted northern coasts.
While inspecting the satellite’s data, Fleming spotted a telltale signature in the spectrum of light bouncing off Earth’s surface.
She concluded that it came from an island, not an iceberg.

Measuring just 82 feet wide by 148 feet long, the rocky atoll reflected infrared light rather than absorbing it like the surrounding seawater.
The island was too tiny to be properly resolved, but it significantly altered the average reflectance of the pixel it occupied.

“For that one pixel, it’s a mix of water and a mix of land,” Sohl explains.
“So you see a sharp contrast with the surrounding area.”

In 1976 a team from the Canadian Hydrographic Service took to the skies above Northern Labrador to verify the island’s existence and fix its position on the map; after all, it had only been seen in one pixel of satellite data.
About 12 miles offshore, the desolate hunk of rock protruded from the froth in an area known as the fringe—a treacherous assemblage of reefs, shoals, and undersea rocks that mariners avoid. Fleming’s discovery held: The island existed.

As recounted to the Canadian Parliament, when hydrographer Frank Hall was lowered from a helicopter to the ice-covered island, he narrowly escaped a lethal swat from an obscured polar bear.

“I can still remember listening to the radio as a small boy and hearing with some excitement, because I had dreams of being an explorer when I grew up, of the discovery of the new island off Canada's east coast,” Scott Reid, a member of Parliament, said in 2001.
“It was a discovery of practical importance to Canada because it allowed Canada to expand its territorial waters.”

The Landsat legacy

The newest members of the Landsat fleet—Landsat 9 launched in September 2021—are more advanced iterations of Landsat 1.
They study our planet in more wavelengths of light, their eyes are sharper, and they have thermal imagers aboard.

From their perches in orbit, these satellites measure receding coastlines, characterise urban heat islands, surveil an Amazon gold rush, and even track the amount of water consumed over 20,000 acres of California wine country.

“The applications for remote sensing, whether it’s vineyards or agriculture, or helping people fight fires in the West—it is just cool to be involved,” Sohl says.

Today Landsat is joined by hundreds of Earth-observing satellites, both government and commercial. This constellation makes crucial observations that help guide decisions about managing our planet’s increasingly strained resources.

“In all of our Earth observations, we are observing the impacts of a growing population,” Irons says. When Landsat 1 launched, fewer than four billion humans lived on planet Earth, a number that has since doubled.
“It becomes increasingly difficult for the resources of the Earth to sustain us under those conditions,” he says. 
“But I try to be optimistic, and my hope is that given accurate information, that people will be better positioned to make wise decisions.”
 
Links :

Wednesday, July 27, 2022

Mass mortality events linked to marine heatwaves could become the new norm in the Mediterranean Sea

MHWs, marine heatwaves : SST anomalies in Mediterranean Sea
 
From Phys by ICM-CSIC

Mass mortality events linked to marine heatwaves could become the new norm in the Mediterranean Sea

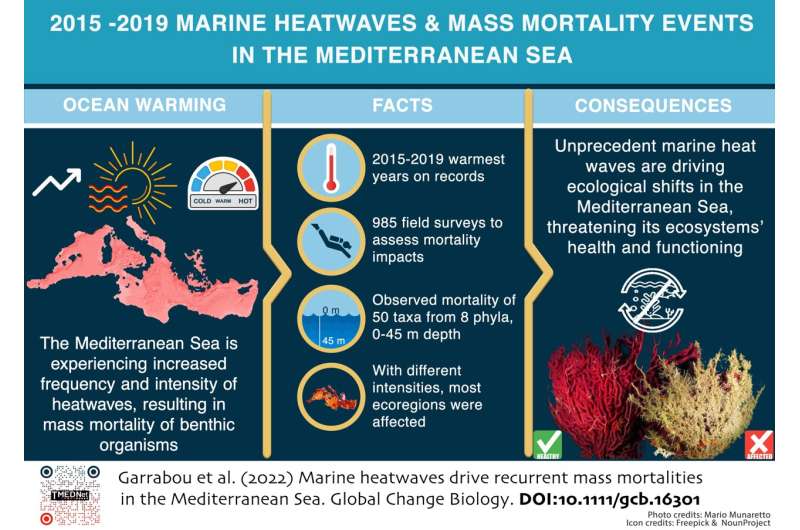
Marine heatwaves drive recurrent mass mortalities in the Mediterranean Sea.
Credit: Garrabou et al 2022
 
An international team of researchers led by the Institut de Ciències del Mar (ICM-CSIC) has proven that, between 2015 and 2019, the Mediterranean experienced a series of marine heat waves that affected all regions of the basin, which resulted in recurrent mass mortality events throughout the period analyzed.
The details are reported in a study recently published in the journal Global Change Biology.

According to the work, that has also involved experts from the Centre d'Estudis Avançat de Blanes (CEAB), the Institut Mediterrani d'Estudis Avançats (IMEDEA), the Instituto Español de Oceanografía (IEO), the Universitat de Barcelona (UB), the Universidad de Alicante (UA), the Universidad de Sevilla (US) and the Museo del Mar de Ceuta, as well as other international centers, populations of some 50 species (including corals, sponges and macroalgae, among others) were affected by these events along thousands of kilometers of Mediterranean coasts, from the Alboran Sea to the Near Eastern coasts.

"Specifically, the impacts of mortalities were observed between the surface and 45 meters' depth, where the recorded marine heat waves were exceptional, affecting more than 90% of the Mediterranean surface and reaching temperatures of more than 26ºC," explains the ICM-CSIC researcher Joaquim Garrabou, one of the authors of the study.


Key species, the most affected

Some of the most affected species are key to maintaining the functioning and biodiversity of the main coastal habitats.
These include Posidonia oceanica meadows or coral assemblages, two of the most emblematic habitats in the Mediterranean.

This is the first study to assess the effects of mass mortalities on a Mediterranean scale over five consecutive years.
In total, more than 30 research groups from 11 countries have participated, which has made it possible to note the incidence and severity of mortality in every corner of the basin.
In fact, this is the most complete picture yet of the impacts of extreme warming events on marine organisms and ecosystems in the Mediterranean.

"Unfortunately, the results of the work show that the Mediterranean Sea is experiencing an acceleration of ecological impacts associated with climate change, posing an unprecedented threat to the health and functioning of its ecosystems," regret Cristina Linares and Bernat Hereu, from the Faculty of Biology and the Biodiversity Research Institute (IRBio) of the UB.

From the exception to the norm

The climate crisis is severely affecting marine ecosystems around the world and the Mediterranean is no exception.
Specifically, the associated marine heat waves are causing massive mortality events in all coastal ecosystems of this basin as a result of their increased frequency, intensity and extent.

"Given this scenario, it is essential to know the relationship between the different biological responses of marine biodiversity and different levels of heat exposure," points out the US professor Free Espinosa. For their part, David Díaz and Emma Cebrián, researchers at the IEO and the CEAB, respectively, explain that "the high variability of observed responses among species and populations at very different spatial and temporal scales has undermined our ability to explore this relationship."

Now, thanks to the temporal and spatial resolution addressed, it has been possible to demonstrate that there is a significant positive relationship between the duration of heat waves and the incidence of mortality events.

"Mass mortality events in the Mediterranean are equivalent to the bleaching events also observed consecutively in the Great Barrier Reef, suggesting that these episodes are already the norm rather than the exception," highlights the UA professor Alfonso Ramos.

For all these reasons, the authors urge to strengthen coordination and cooperation at regional, national and international levels, as has been done in this work, in order to reach more effective management decisions to cope with the ongoing climate emergency.


Links :

It’s a Race Against Heat, and Humanity Is Losing

Plastic in the depths: how pollution took over our oceans

Plastic pollution in the Red Sea, Egypt, 23 Jun 2022.
Photograph: Andrey Nekrasov/ZUMA Press Wire/REX/Shutterstock

From The Guardian by Chris Michael

So much plastic pours into the sea every year that species are now endemic to it.
A new Guardian series looks at where it comes from, the harm it does and what can be done about it


By now, it is well known that the oceans swirl with plastic.
More than 8m tonnes pour into the seas every year, spewed out via rivers, dumped along coastlines or abandoned by fishing vessels.
Plastic even contaminates ocean air, where particles are kicked up by spray and then blown about the planet by the wind.
In many places on Earth, it is literally raining – and snowing – plastic.

While most images of ocean pollution show plastic bottles bobbing on the surface or straws being yanked from turtles’ noses, these are misleading: bottles and straws make up only a fraction of the total.

That is why, in the coming months, the Guardian’s Seascape project will take a microscope to the ocean to find out exactly what is in this plastic avalanche, where it comes from, what harm it is doing – to marine life and to us – and what can still be done about it.

The type of plastic that proliferates through the different levels of the ocean ecosystem depends in large part on where you look.
While bags and food wrappings dominate the shoreline, further out to sea it is abandoned fishing gear and plastic lids that choke the deeper waters.


Some of the sources of plastic are surprising, too: cigarette butts – yes, the filters are made largely of plastic – or sachets, those little packets for individual servings of ketchup or soap.
Sachets, as Seascape reporter Karen McVeigh has exposed, are a huge pollution problem, particularly in Asia where they were presented by companies such as Unilever as a convenient way to dispense affordable products for those on low incomes.
They have proved to be an intractable pollutant – tiny, difficult to collect and all but worthless to recycle.

Then there’s the vast, unseen churn of microplastics – trillions of tiny fibres, beads and shards.
Plastic is now so fully integrated into the Earth’s water system that every week most people drink a credit card’s worth of it.

Microplastic itself has many sources.
It comes from clothes fibres, swirling into the drain from washing machines.
It comes from nurdles, the “Lego blocks” for bigger plastics that are frequently spilled accidentally in their billions from container ships, causing as much damage as oil spills (though still not yet classified as hazardous).

And it comes, in huge quantities (representing more than a quarter of all microplastic in the ocean), from tyre dust, the residue generated from synthetic rubbers, fillers and softeners as people drive their cars (or , to a lesser but still notable degree, bicycles) down the street.

 
Lest we get too bogged down, we will also look at what can be done about all this plastic – how to clean it up, how to stop it getting there in the first place, and what you can do to help.

There’s now so much plastic in the ocean that scientists are treating it as a new biome: the plastisphere.
The species that live there are now endemic to it.
Plastic is their forever home, but it doesn’t need to be ours.
 
Links :

Tuesday, July 26, 2022

UKHO announces intention to withdraw from paper chart production

UKHO sets out transition plan for fully digital chart portfolio by end of 2026

UKHO sets out transition plan for fully digital chart portfolio by end of 2026 

The UK Hydrographic Office (UKHO) has announced its intention to develop options for the withdrawal from global paper chart production by late 2026 to increase focus on its digital navigation products and services.

Plans to withdraw the UKHO’s portfolio of ADMIRALTY Standard Nautical Charts (SNCs) and Thematic Charts are in response to more marine, naval and leisure users primarily using digital products and services for navigation.
The ADMIRALTY Maritime Data Solutions digital navigation portfolio can be updated in near real-time, greatly enhancing safety of life at sea (SOLAS).

The phased withdrawal of paper charts from production will take place over a number of years and is anticipated to conclude in late 2026.
In parallel, we will develop viable, official digital alternatives for sectors still using paper chart products.
This will be a carefully managed process, conducted in close liaison with all customers and stakeholders, including the Maritime and Coastguard Agency (MCA) as well as other regulatory bodies, hydrographic offices, industry partners and distributors.

Peter Sparkes, Chief Executive of the UKHO, said:
“The decision to commence the process of withdrawing from paper chart production will allow us to increase our focus on advanced digital services that meet the needs of today’s seafarers. As we look to the future, our core purpose remains the safety of shipping operations and delivering the best possible navigation solutions to achieve that. Whether for the Royal Navy, commercial vessels or other ocean users, our focus is on developing and delivering ADMIRALTY digital services that promote safe, secure and thriving oceans.
“We understand the significance of this announcement, given the distinguished history of the UKHO’s paper chart production and the trust that mariners have placed in ADMIRALTY charts over the generations. We will support users of SNCs during the withdrawal of our paper chart portfolio and work with our distributors to help users switch to digital alternatives between now and our planned date of 2026.”

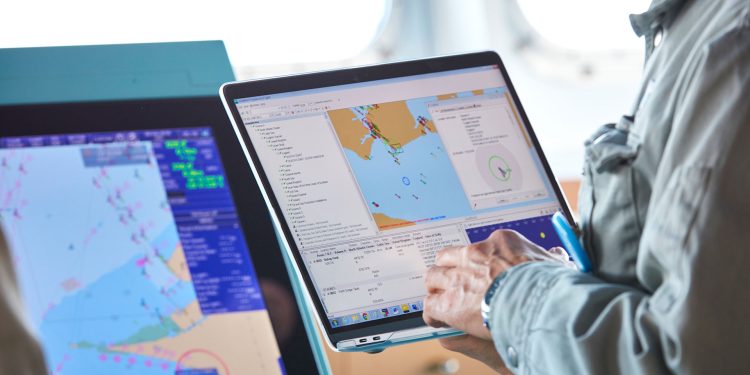
The move to digital navigation solutions has been accompanied by a rapid decline in demand for paper charts, driven by the SOLAS-mandated transition to ECDIS and the wider benefits of digital solutions, including the next generation of navigation services, Peter Sparkes explained.
“Shipping is moving quickly towards a future underpinned by digital innovations, enhanced satellite connectivity at sea and optimised data solutions, supporting the next generation of navigation. The UKHO aims to be at the vanguard of this digital transition, continuing to provide the assured and globally trusted ADMIRALTY navigation services that seafarers the world over depend on.”

Baroness Goldie, Minister of State at the UK government’s Ministry of Defence, said:
“The world has changed unrecognisably in recent years, driven by digitalisation and rapid technological advancement. When it comes to maritime, one of our priorities at the Ministry of Defence is to make shipping as safe as possible; to achieve this, the industry must continue transitioning to digital tools and technology that share data almost instantly from ship-to-ship or ship-to-shore.
“As one of the world’s leading authorities on navigational charts, the UKHO is well positioned to recognise the need to deliver a range of digital solutions that enhance safety and data accuracy. The decision to focus on digital products and services makes strategic and commercial sense, helping usher in a new era of maritime navigation, which will be powered by digital innovations.”

Richard Bell, Assistant Director for UK Technical Services Navigation at the MCA, said:
“The MCA recognises the benefits of official digital navigation products for safe navigation, at a time when paper products make up a minority of navigation products being used at sea. This announcement by UKHO represents a clear vision for the future of navigation, which will need to be supported by official equipment and data suited to the needs of the different maritime end users.

“We are committed to working closely with the UKHO, stakeholders and industry to make this vision a reality. Close liaison will be essential, to ensure that the technical and legislative barriers to the proposed change are overcome in advance of the UKHO’s 2026 timeline.”

More information on UKHO’s carefully managed approach for the phased withdrawal of paper chart production can be found on the ADMIRALTY website.
 
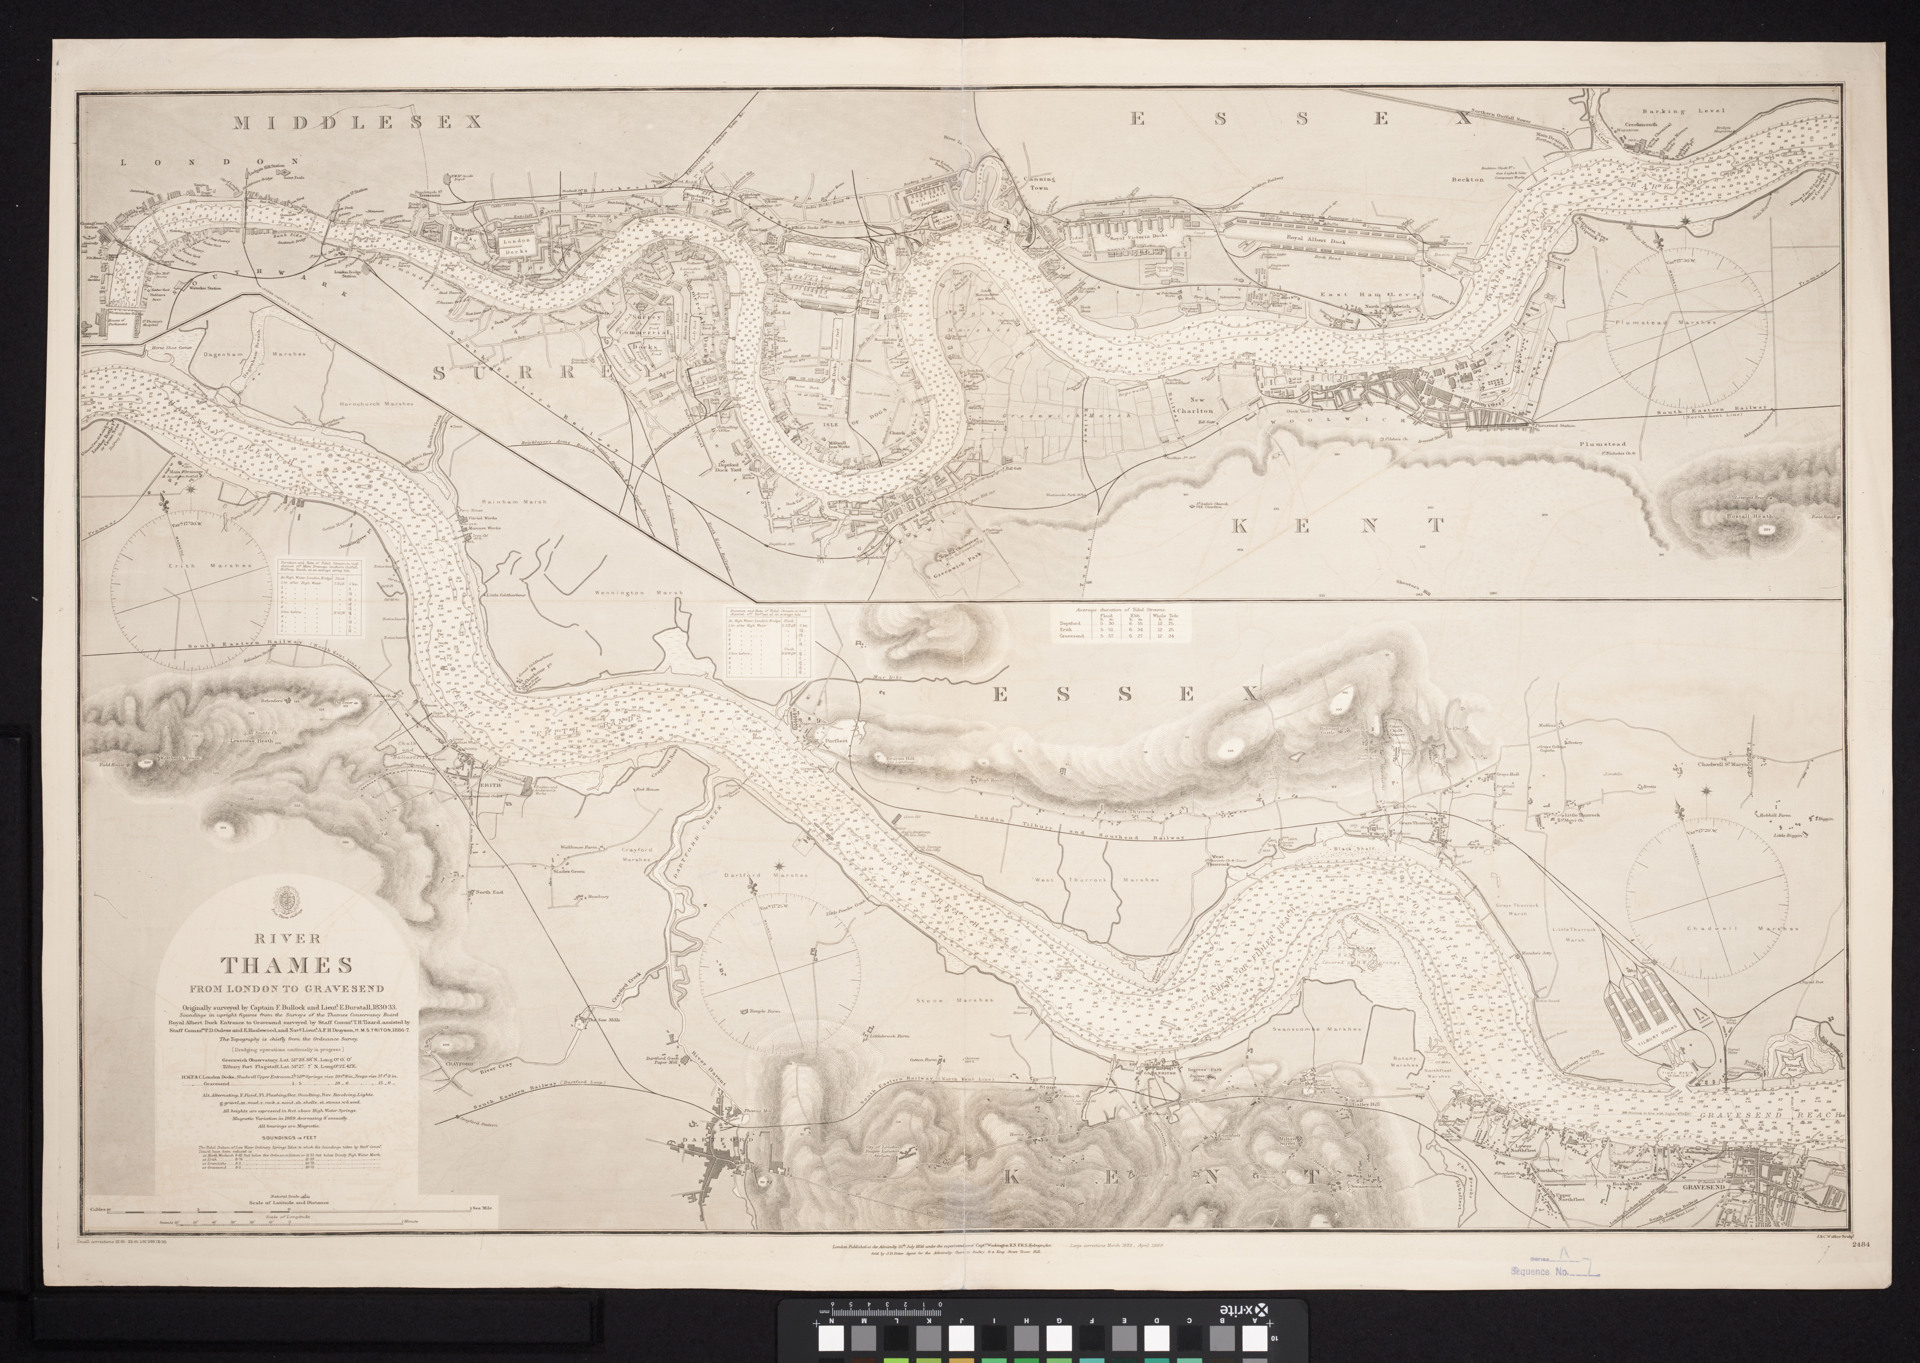
in 1856, this @ADMIRALTYOnline chart of the River Thames was published, showing London to Gravesend.

Modern paper charts in the GeoGarage platform (UKHO raster paper chart)

 Links :