During the first dive of the Okeanos Explorer 2016 Hohonu Moana: Exploring Deep Waters off Hawaii expedition to explore on the northeast side of Necker Island, the Deep Discoverer remotely operated vehicle encountered this octopus, which confused several of our shore based scientists who have never seen anything like it. Upon further review, this ghostlike octopod is almost certainly an undescribed species and may not belong to any yet-described genus.
This tiny octopus, whose body measured about five centimeters across, was spotted swimming along at a depth of 825 meters as we explored Whiting Seamount on April 29, 2015.
A satellite image shows damage at Fukushima I Nuclear Power Plant In Fukushima Prefecture. The damage was caused by the offshore earthquake that occurred on March 11, 2011. Photo credit: Greenpeace
With the help of my colleagues in Japan and around the world, I’ve spent the past five years piecing together the impacts
that radioactive releases from Fukushima have had on the ocean, marine
life, and the people who live on both sides of the Pacific.
In the
process of sharing our insights with scientists and the public, I’ve
become frustrated with both sides of the nuclear power debate for
embracing either overly alarmist or dismissive attitudes toward the
problem.
In addition, I’ve grown concerned over the lack of oversight
for radioactive contamination in U.S. waters.
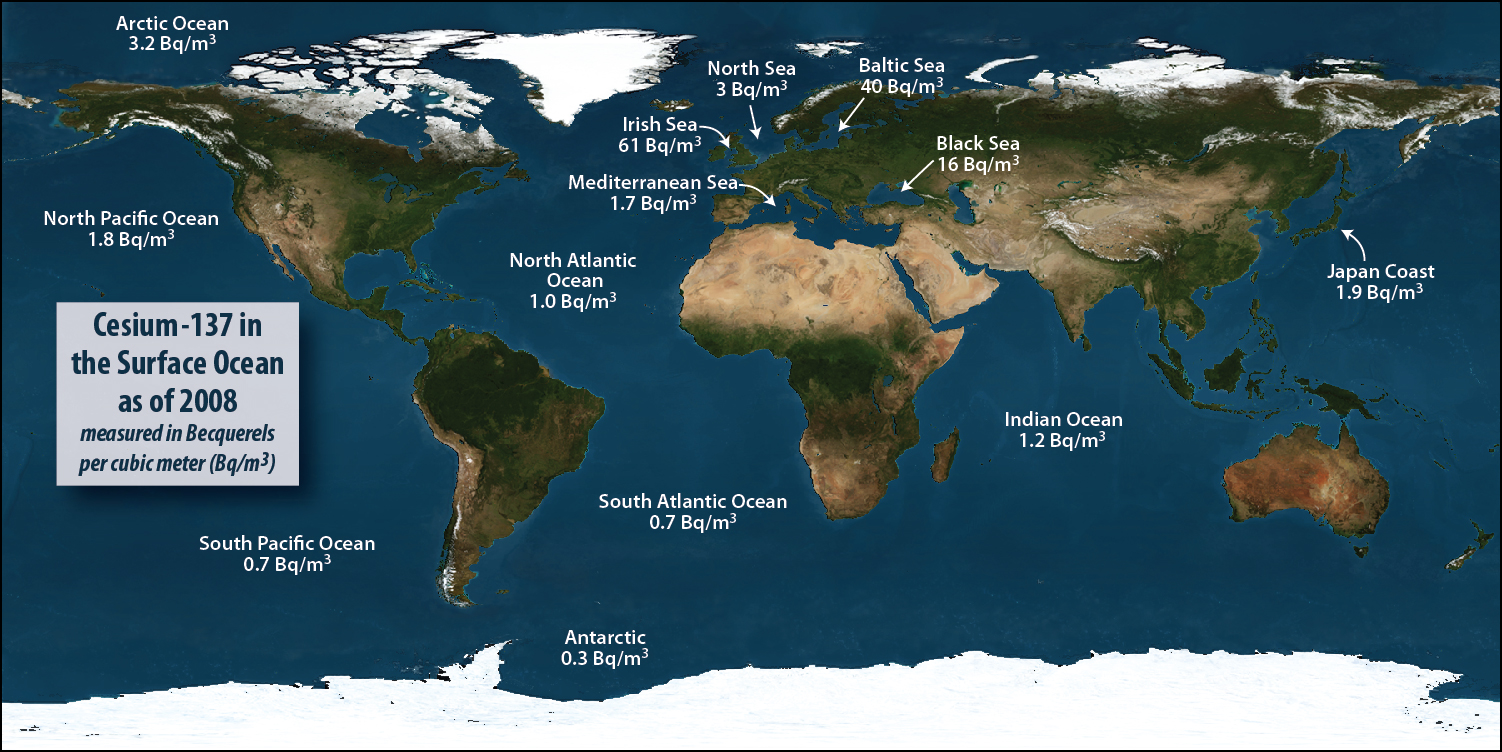
Cesium-137 in the surface oceans as of 2008 (pre-Fukushima)
In the 1960, immediately after the end of testing on the Pacific atolls, the concentration of radioactive cesium in the Pacific off the coast of Japan was about 50 Becquerels per cubic meter (Bq/m3) and 10 Bq/m3 off California.
By 2011 immediately before the earthquake and tsunami, that had fallen throughout the Pacific to about 2 Bq/m3 as a result of radioactive decay.
Today, the highest we have seen off the coast of North America is 6 Bq/m3.
Off the coast of Japan after the accident, (aside from the extremely high levels detected at the source of release from the reactors) we recorded a high of 4,500 Bq/m3.
source : whoi.edu
On March 11, 2011, the devastation in Japan after the earthquake and
tsunami provided a stark lesson in nature’s power.
But in the days that
followed, another disaster unfolded at the Fukushima Daiichi nuclear
power plant that continues to underscore how human activities can leave a
discernible imprint on something as large as the Pacific Ocean and on
people and organisms thousands of miles away.
Our Radioactive Ocean: The Impacts of Fukushima on the Pacific
WHOI chemist Ken Buesseler discusses radiation in the ocean and the impacts of Fukushima across the Pacific--from Japan to North America (2014)
Five years later, the story from the Japanese side of the Pacific is
this: Overall, things are under control with the construction of an “ice
wall” to prevent the continued releases of contaminated water into the
ocean, and fishing has resumed in all regions except those within 10
kilometers of the reactors.
However, these milestones obscure the fact
that the Japanese will be wrestling with the cleanup for decades and
will spend trillions of yen in the process.
It also minimizes the
threats posed by millions of gallons of highly contaminated water on the
power plant grounds and the likelihood that storms and other natural
events will continue to mobilize contaminants currently trapped in soils
and ocean sediments near shore.
More than 80 percent of the radioactivity from the damaged reactors
ended up in the Pacific — far more than reached the ocean from Chernobyl
or Three Mile Island. Of this, a small fraction is currently on the
seafloor — the rest was swept up by the Kuroshio current, a western
Pacific version of the Gulf Stream, and carried out to sea where it
mixed with (and was diluted by) the vast volume of the North Pacific.
These materials, primarily two isotopes of cesium, only recently began
to appear in the eastern Pacific: In 2015 we detected signs of
radioactive contamination from Fukushima along the coast near British
Columbia and California.
Radioactivity In Our Ocean: Fukushima & Its Impact On The Pacific
As expected, the topic of radiation leaking into the Pacific Ocean and threatening marine life and public safety is receiving a lot of attention.
Our intent with this lecture was to bring forth the most up to date information from American and Canadian scientists that are involved in measuring the levels of radiation so the public can be more informed.
The information collected, analyzed and shared by our speakers was done scientifically.
Levels of Fukushima cesium off the west coast of North America were measured independently by WHOI, Canada Fisheries and Kelp Watch 2015.
They all agree on levels of cesium isotopes in waters along the coast and offshore.
Although just barely discernible by our most sophisticated
instruments, these signs, and the many more signs from samples we’ve
collected on both sides of the Pacific, show that releases have
continued, but that at current rates, it would take 5,000 years to equal
the amount of cesium released in the accident’s first few months.
Despite this, the fact remains that this event is unprecedented in its
total release of radioactive contamination into the ocean.
Nevertheless,
we often struggle to detect signals from Fukushima above the background
radiation that surrounds us every day.
So what’s the middle ground?
First, it is incorrect to say that
Fukushima is under control when levels of radioactivity in the ocean
indicate ongoing leaks, caused by groundwater flowing through the site
and, we think, enhanced after storms.
At the same time, it is also wrong
to attribute to Fukushima events like recent die-offs of seal, whale,
and starfish along the West Coast rather than see that they are far more
complex and have been happening for far longer than we’d like to admit.
Recently, I’ve begun to see a much more serious threat to U.S.
waters.
With our nearly 100 reactors, many on the coast or near inland
waterways that drain to the ocean, you might expect a federal agency to
be responsible for supporting research to improve our understanding of
how radioactive contamination originating from one of these sites would
affect our marine resources.
Instead, the response we receive from an
alphabet-soup of federal agencies is that such work “is in the national
interest,” but ultimately “not our job.”
As a result, we have turned to
crowd funding to help us build data along the West Coast to address
immediate public concerns and to keep a watchful eye out to sea.
That is no longer sufficient.
As the EPA runs RadNet, which monitors
radioactivity in the air we breathe, we need an OceanNet to do the same
for our nation’s waters.
We also need to do a better job of educating
the public about radioactivity to lessen the impact of both inflammatory
and dismissive rhetoric.
Fortunately, accidents on the scale of Fukushima are rare, but there
is a great deal more we can and should do to prepare should something
similar happen here.
We can’t simply cast our lot on good fortune.
Instead, we need to do everything we can to fill the knowledge gaps that
have the potential to do great harm in the wake of disaster.
Harmony
of the Seas, the newest addition to Royal Caribbean's award-winning
Oasis Class fleet, under construction at Chantiers de l'Atlantique
shipyard is starting her first sea trials viewable in live on Weather 4D 2.0 mobile app.
This visualization shows total sea level change between 1992 and 2014, based on data collected from the TOPEX/Poseidon, Jason-1, and Jason-2 satellites. Blue regions are where sea level has gone down, and orange/red regions are where sea level has gone up. Since 1992, seas around the world have risen an average of nearly 3 inches. The color range for this visualization is -7 cm to +7 cm (-2.76 inches to +2.76 inches), though measured data extends above and below 7cm(2.76 inches). This particular range was chosen to highlight variations in sea level change.
The oceans have heaved up and down as world temperatures have waxed
and waned, but as new research tracking the past 2,800 years shows,
never during that time did the seas rise as sharply or as suddenly as
has been the case during the last century.
The new study, the culmination of a decade of work by three teams of
farflung scientists, has charted what they called an “acceleration” in
sea level rise that’s triggering and worsening flooding in coastlines
around the world.
The findings also warn of much worse to come.
The scientists reported in a paper published Monday in
Proceedings of the National Academy of Sciences that they have greater
than 95 percent certainty that at least half of more than 5 inches of
sea level rise they detected during the 20th century was directly caused
by global warming.
“During the past millennia, sea level has never risen nearly as fast as during the last century,” said Stefan Rahmstorf,
a physics professor at Potsdam University in Germany, one of 10 authors
of the paper.
“That was to be expected, since global warming inevitably
leads to rising seas.”
By trapping heat, rising concentrations of atmospheric pollution are
causing glaciers and ice sheets to melt into seas, lifting high tides
ever higher.
Globally, average temperatures have risen about 1°C (nearly 2°F) since the 1800s.
The expansion of warming ocean water was blamed in a recent study for about half of sea level rise during the past decade.
Changes in sea level vary around the world and over time, because of
the effects of ocean cycles, volcanic eruptions and other phenomenon.
But the hastening pace of sea level rise is being caused by climate
change.
“The new sea level data confirm once again just how unusual the age
of modern global warming, due to our greenhouse gas emissions, is,”
Rahmstorf said.
“They also demonstrate that one of the most dangerous
impacts of global warming, namely rising seas, is well underway.”
Were it not for the effects of global warming, the researchers
concluded that sea levels might actually have fallen during the 20th
century.
At the very least, they would have risen far less than was
actually the case.
A report published by Climate Central on Monday, the result of an
analysis based in part on the findings in Monday’s paper, concluded that
climate change was to blame for three quarters of the coastal floods
recorded in the U.S. from 2005 to 2014, mostly high tide floods.
That
was up from less than half of floods in the 1950s.
“I think this is really a first placing of human fingerprints on coastal floods, and thousands of them,” said Ben Strauss,
vice president for sea level and climate impacts at Climate Central.
Strauss led the analysis, which also involved government and academic
researchers.
Governments and communities have been slow to respond to the crisis
of rising seas, though efforts to adapt to the changes underway are now
being planned around the world.
“There’s a definite recognition among people who weren’t talking
about sea level rise 5 years ago that it’s something to be concerned
about,” said Laura Tam, a policy director at SPUR, which is an urban
planning think-tank based in San Francisco.
“And something that needs to
be planned for.”
A high-profile effort to track long-term changes in sea levels was
based on analysis of sediment layers at a single location in North
Carolina. Published in 2011,
that study produced a chart of sea levels that bounced up and down over
time, changing with global temperatures, and then ticked sharply upward
as industrialization triggered global warming.
“North Carolina basically showed us that this could be done,” said Andrew Kemp, a sea level scientist at Tuft’s University.
He was a co-author of both Monday’s paper and the paper published in 2011.
Monday’s paper combined the data from North Carolina with similar
analyses from 23 other locations around the world plus data from tide
gauges. Rob DeConto,
a professor at UMass Amherst who researches prehistoric climates, and
who was not involved with the study, described the report as a “nice
job” that “used a lot more data than anybody else has used in a study
like this.”
The analysis goes further than explaining historical sea level rise.
It includes worrying projections for the future.
By extending their findings to future scenarios, the scientists
showed that the amount of land that could be inundated in the coming
years will depend heavily on whether humanity succeeds in slashing
pollution from fuel burning, deforestation and farming.
The Paris Agreement negotiated in December aims
to do just that, with nations agreeing to take voluntary steps to
reduce the amount of pollution they release after 2020.
It could take
decades, though, before that untested approach is revealed to have been a
success, a failure, or something in between.
Coastal cities will face greater threat than anticipated
Even If humans quickly stop polluting the atmosphere, potentially
keeping a global temperature rise to well below 2°C (3.8°F) compared
with preindustrial times — a major goal of the Paris climate agreement —
seas may still rise by an additional 9 inches to 2 feet this century,
the study concluded. That would trigger serious flooding in some areas,
and worsen it in others.
Under the worst-case scenario investigated, if pollution continues
unabated, and if seas respond to ongoing warming by rising at the
fastest rates considered likely, sea levels could rise more than 4 feet
this century alone, wiping out coastal infrastructure and driving
communities inland.
The problem would be made far worse if the Antarctic or Greenland ice sheets collapse — something that’s difficult to forecast.
Their projections for future sea level rise were similar to those published in 2013 by scientists convened by the United Nations, following the Intergovernmental Panel on Climate Change’s most recent assessment of climate science.
They also closely matched projections that were coincidentally published in a separate paper in the same journal on Monday.
The similarity of the other papers’ projections “strengthens the confidence” in the findings, said Robert Kopp, a Rutgers University climate scientist who led the analysis.
The convergence of the findings in Monday’s papers was a “nice result,” said Matthias Mengel,
a researcher at at Potsdam University who coauthored the other sea
level rise study released Monday. He led a team of sea level scientists
who took a different approach than Kopp’s team to projecting future sea
levels.
Mengel’s team projected future sea levels by combining the results of
models that anticipate changes to icebergs, ice sheets and ocean
expansion in the years ahead, and used those findings to predict sea
levels.
For years, different approaches to projecting future sea level rise
have arrived at different results, but the gap has recently been
closing, which Mengel described as “a really good sign for sea level
science” — even if it’s ominous news for humanity.