Tuesday, November 7, 2023

A new layer in the GeoGarage platform : Netherlands nautical charts based on rasterized ENC material from NLHO

Availability of a new dedicated layer for Netherlands with NLHO rasterized ENCs (full catalogue)
 
The layer also contains charts for the Caribbean islands managed by NLHO
so 19 ENC for : Saint Martin (NL part) / Saba / Sint Eustatius / Aruba / Curaçao / Bonaire
 
Until today, the GeoGarage platform used the raster chart material (RNC) provided by NLHO display nautical charts for the Netherlands areas.

For internal management reasons specific to NLHO, the Netherlands Hydrographic Office has made some technical changes to deliver updates to their commercial licensees (whose GeoGarage) causing us problems to deliver updates for our customers in our chain of processes.

The GeoGarage platform was already in the capacity to deliver a rasterized visualization of Electronic Navigation Chart (vector ENC) through their web services (WMTS) for their B2B customers involved in webmapping and other onshore GIS activities.

Today, the GeoGarage platform is ready to propose the visualization of official ENC to their customers using mobile navigation apps (non SOLAS) so Weather 4D Routing and Navigation on iOS and SailGrib on Android.
 
In consequence, the GeoGarage platform no longer offers a subscription to Netherlands Raster maps for Netherlands on its e-commerce platform for mobile apps.
However, the Netherlands RNC subscription will continue for their current mobile customers until its expiry date (visible on your W4D R&N/Sailgrib application) but will not be automatically renewed on this date.

The RNC plan is replaced by a new layer based on ENC type maps edited by the Netherlands Hydrographic Office (NLHO), and rasterized for W4D/Sailgrib : Netehrlands (derived from NLHO ENC)
The price of the annual subscription (24.99 EUR) remains the same. 
 
So Weather4D R&N and Sailgrib users (with last updated versions) can right now display the whole catalogue of NLHO ENC (166 ENC at this time), with a half-yearly updating process : see GeoGarage news

Today, in this first version, the vector ENC are displayed using a graphical rendering similar to the one used in official ECDIS (s-52 IHO specifications) : they are not to be used for shipping navigation (IMO SOLAS), but only for recreative use, not as a primary tool for navigation.
Effectively, in contrast to the use in ECDIS, there is no possibility -today with the W4D/SailGrib current version- to ask for text info and details regarding any navigational objects (beacon, buoy, marks...).
 
View of Amsterdam harbor with RNC chart
 
Same view of Amsterdam harbor with ENC chart

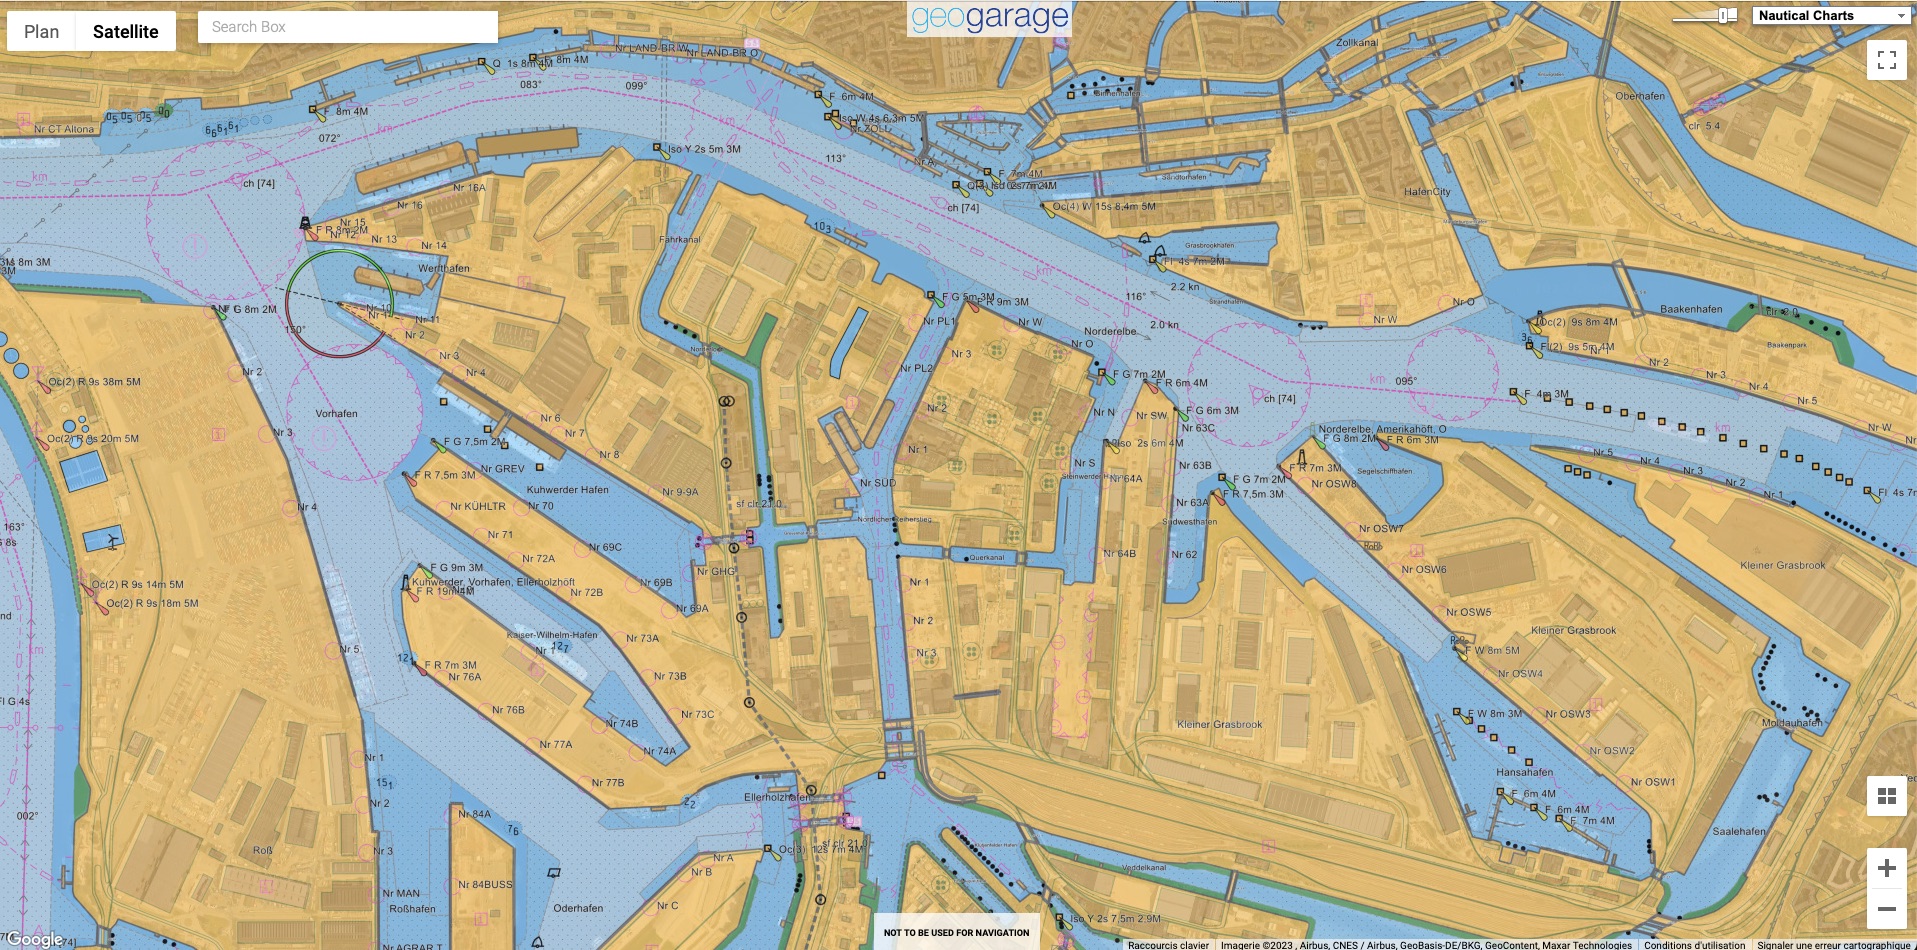
A new layer in the GeoGarage platform : Germany nautical charts based on rasterized ENC material from BSH

 Nautical charts for Germany today which leads to the availability of a new dedicated layer for Germany with BSH rasterized ENCs

Until today, the GeoGarage platform used the raster chart material (RNC) provided by BSH to display nautical charts for the German areas.

For internal management reasons specific to BSH, the Hydrographic Institute of Germany has made some technical changes to deliver updates to their commercial licensees (whose GeoGarage) causing us problems to deliver updates for our customers in our chain of processes.

The GeoGarage platform was already in the capacity to deliver a rasterized visualization of Electronic Navigation Chart (vector ENC) through their web services (WMTS) for their B2B customers involved in webmapping and other onshore GIS activities.

Today, the GeoGarage platform is ready to propose the visualization of official ENC to their customers using mobile navigation apps (non SOLAS) so Weather 4D Routing and Navigation on iOS and SailGrib on Android.
 
In consequence, the GeoGarage platform no longer offers a subscription to BSH Raster maps for Germany on its e-commerce platform for mobile apps.
However, the Germany RNC subscription will continue for their current mobile customers until its expiry date (visible on your W4D R&N/Sailgrib application) but will not be automatically renewed on this date.

The RNC plan is replaced by a new layer based on ENC type maps edited bythe German Hydrographic Service (BSH), and rasterized for W4D/Sailgrib : Germany (derived from BSH ENC)
The price of the annual subscription (24.99 EUR) remains the same. 
 
So Weather4D R&N and Sailgrib users (with last updated versions) can right now display the whole catalogue of BSH ENC (298 ENC at this time), with a half-yearly updating process : see GeoGarage news

Today, in this first version, the vector ENC are displayed using a graphical rendering similar to the one used in official ECDIS (s-52 IHO specifications) : they are not to be used for shipping navigation (IMO SOLAS), but only for recreative use, not as a primary tool for navigation.
Effectively, in contrast to the use in ECDIS, there is no possibility -today with the W4D/SailGrib current version- to ask for text info and details regarding any navigational objects (beacon, buoy, marks...).
 
View of Hamburg harbor with RNC chart

Same view of Hamburg harbor with ENC chart

Seals show scientists an unknown Antarctic canyon


Seals with helmets are helping scientists with climate research in Antarctica
 
From Scientific American by Ethan Freedman
 
Charting the seafloor with deep-diving animals can help scientists predict glacial and ice-sheet-melting physics
 
Humans have sailed the oceans' surfaces for millennia, but their depths remain effectively uncharted.
Only about a quarter of the seafloor has been mapped at high resolution.
Maps of most regions display only approximate depths and often miss entire underwater mountains or canyons.

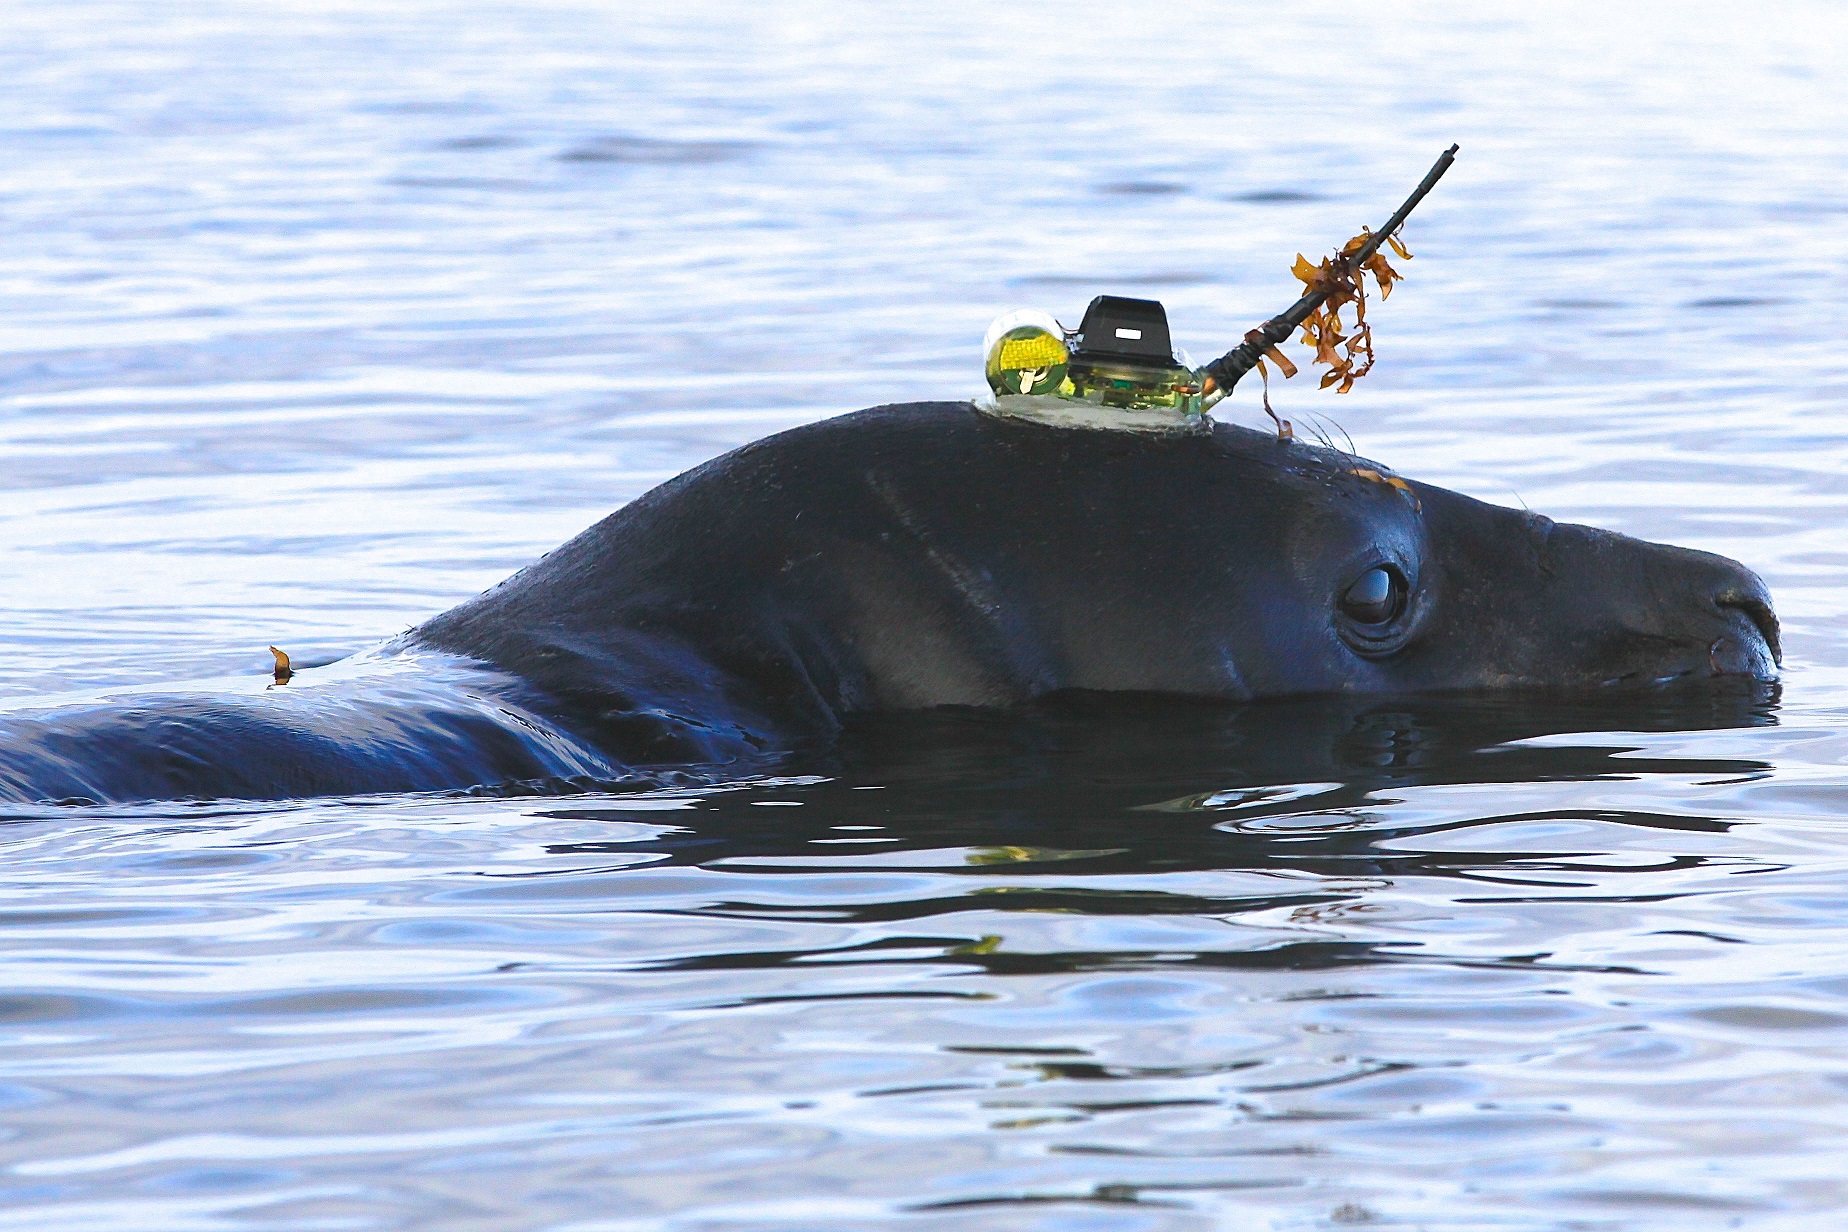
The tracker measures temperature, depth and salinity and beams that data back to base via satellite.(Supplied: Clive McMahon)

So a group of researchers has recruited some deep-diving experts: Elephant Seals and Weddell Seals.
Scientists have been placing trackers on these blubbery marine mammals around Antarctica for years, gathering data on ocean temperature and salinity.
For a new study, the researchers compared these dives' location and depth data with some of the less detailed seafloor maps.
They spotted places where the seals dove deeper than should have been possible according to the maps—meaning the existing depth estimates were inaccurate.
 
Vincennes Bay with the GeoGarage platform (NGA nautical raster chart)

In eastern Antarctica's Vincennes Bay, the diving seals helped the scientists find a large, hidden underwater canyon plunging to depths of more than a mile.
An Australian research ship called the RSV Nuyina later measured the canyon's exact depth using sonar, and the researchers have proposed naming their find the Mirounga-Nuyina Canyon—honoring both the ship and the involved Elephant Seals, genus Mirounga.

“The seals discovered the canyon, and the ship confirmed it,” says Clive McMahon, a researcher at the Integrated Marine Observing System in Australia and a co-author of the new study, published in Communications Earth & Environment.

Elephant seals fitted with tracking devices.
Credit: Clive McMahon, IMOS and SIMS
 
But seals can't map the entire ocean floor.
The trackers used in the study could pinpoint a seal's geographical location only within about 1.5 miles, which allows for useful but not exactly high-resolution data.
Plus, because the seals don't always dive to the bottom of the ocean, they can reveal only where the bottom is deeper than in existing maps—not shallower.
McMahon notes that scientists could improve on these data by using more precise GPS trackers and analyzing the seals' diving patterns to determine whether they have reached the seafloor or simply stopped descending.

The current seal-dive data can still be valuable for an important task, says Anna Wåhlin, an oceanographer at the University of Gothenburg in Sweden, who was not involved in the new research.
The deep ocean around Antarctica is warmer than the frigid waters at the surface, and seafloor canyons can allow that warmer water to flow to the ice along the continent's coast, Wåhlin explains.
To predict how Antarctica's ice will melt, scientists will need to know where those canyons are and how deep they go.

 Links :

Monday, November 6, 2023

A landslide triggered the 1650 tsunamigenic eruption of Kolumbo in the Aegean Sea

A new study using 3D seismic data confirms the hypothesis that a flank collapse triggered the explosive eruption that caused damage across the Aegean Sea.

From EOS by Dave Petley,

In 1650, a destructive tsunami occurred in the Aegean Sea, which is an embayment of the Mediterranean sea, located between the modern Greece to the west and Turkey to the east.
There is a nice presentation about the tsunami and its effects online.
It is documented that the tsunami destroyed farmland, boats, trees and churches on the island of Santorini.
There is clear archaeological and geological evidence for this tsunami.

 
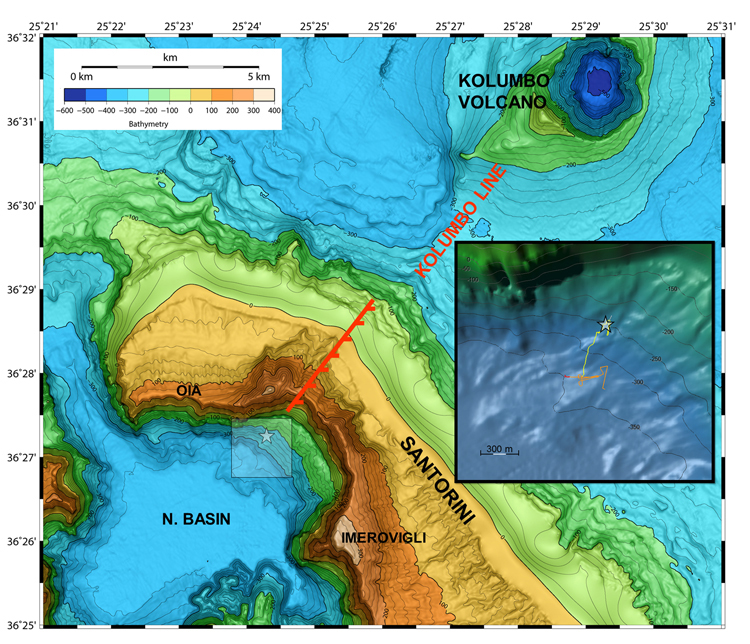
The source of the tsunami is known to be an underwater volcano, known as Kolumbo, located about 7 km northeast of Santorini.
The volcano was erupting for several weeks ahead of the tsunami.
On the 29 September 1650, a huge explosion was heard up to 100 km from Santorini as the volcano erupted catastrophically.
The resultant tsunami waves were up to 20 m high, striking islands across the southern part of the Aegean Sea, as well as the north coast of Crete.

It has long been speculated that the trigger for the catastrophic eruption might have been the collapse of the volcanic cone triggered by a submarine landslide.
This hypothesis has been investigated by a team that has just published their research in the journal Nature Communications (Karstens et al.
2023
– available open access).
The researchers have mapped Kolumbo with 3D seismics, generating profiles of the crater and the surrounding seabed.

 GR4APP06 Thira island (scale 1:450000) ENC with zoom on the North East for Kolumbo

source : NOAA
 
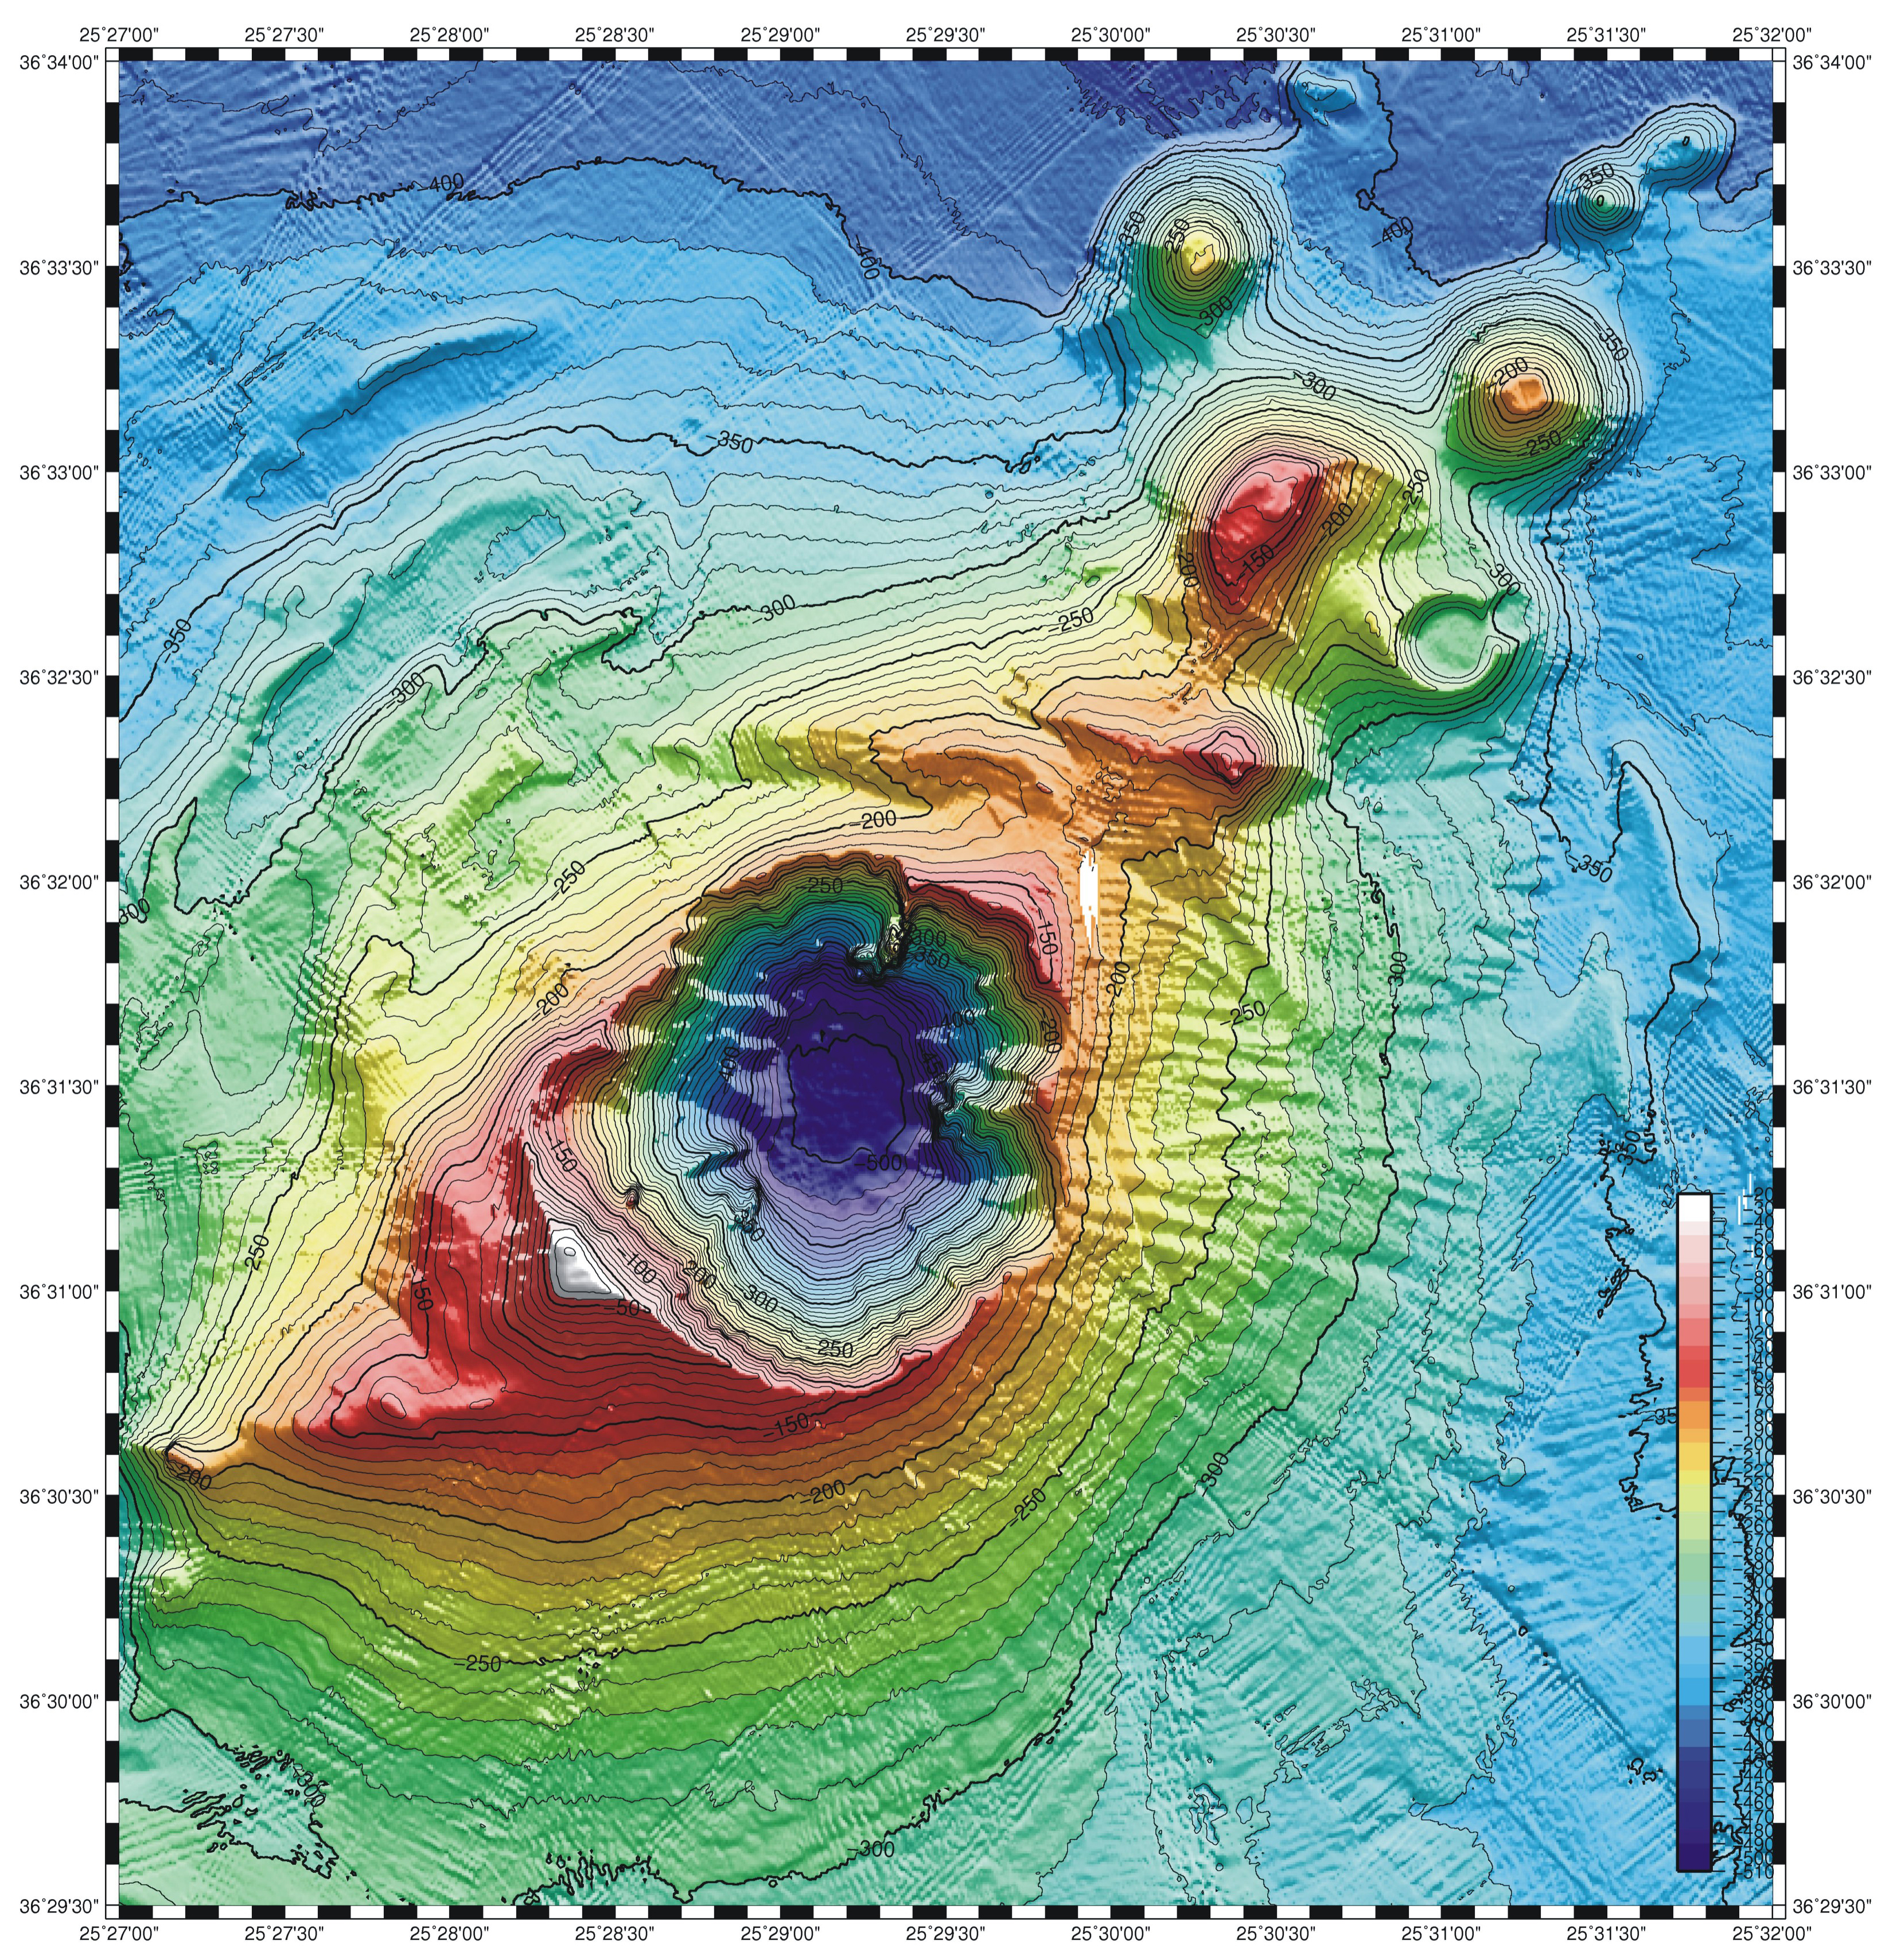
The paper includes the following perspective view of the bathymetry data, showing the crater, the landslide deposit and the clear detachment surface – the shear surface in landslide parlance:
 
 
3D bathymetry data for Kolumbo volcano, showing the volcanic cone, the landslide deposit and the shear plane.

The seismic profile through the hypothesised landslide deposit clearly demonstrates that thus was a flank collapse event:
 
 
A seismic profile line through Kolumbo volcano, showing the volcanic cone, the landslide deposit and the shear plane.

Thus, the sequence of events was that during the eruption, the flanks of the volcano destabilised and slipped in a very large landslide – the estimated volume is 1.2 cubic kilometres.
This then removed the cap from the magma chamber, which contained a large volume of gas under pressure.
This generated a huge explosion that created the crater that is seen in the images above.
The crater is 2.5 km in diameter and 500 m deep.

The team has modelled the tsunami that would result from a landslide event of this sequence of events – a flank collapse followed by an explosives’ eruption – and have compared it with the modelled tsunami from an explosion alone.
They found that the former sequence fits the observed tsunami rather better.

It is interesting that in recent weeks we have seen a large GLOF that was triggered by slope instability into the glacial lake and now clear evidence that a volcanic eruption and tsunami were caused by a landslide.
I have long argued that slope instability is under-appreciated as the trigger mechanism for major hazards across a broad range of types.

Links :

Sunday, November 5, 2023

Transat Jacques Vabre Normandie Le Havre 2023

Class 40 departure
 

Ultim departure for SVR Lazartigue trimaran