Monday, December 26, 2022

Did the Piri Reis map show Antarctica before its discovery?


The Piri Reis world map, 1513. Artist: Piri Reis (1470-1553)
 
From HistoryDefined by Carl Seaver

While the first confirmed mainland sighting of Antarctica wasn’t until 1820, there are suggestions that a Turkish cartographer by the name of Hagii Ahmed Muhiddin Piri, also known as Piri Reis, actually included Antarctica on a map in the early 1500s.

But how accurate is this assumption?
And how could Piri have included the undiscovered continent over three centuries before it was actually seen?

 

Who Was Piri Reis?

While his exact birthdate is unknown, Piri Reis was born between 1465 and 1450 in Gallipoli, a peninsula in eastern Turkey.
At the time, it was part of the Ottoman empire.
At an early age, Reis began navigating and sailing the seas with his uncle Kemal Reis.Statue of Piri Reis

In 1494, Piri Reis officially joined the Ottoman Navy as a commander, leading the charge between the Ottoman Empire and Venice.
When his uncle died in 1511, Piri returned to Gallipoli and began drawing his maps and books as he began to develop an esteemed reputation for map-making.
 
Piri (Reis is a title meaning "admiral") did not draw Antarctica, he drew the Terra Australis which was depicted on pretty much every map during the 1400s to early 1700s.
 
A Whole New World


His most famous map, the 1513 World Map, and the Book of Navigation remain among the most studied pieces of early maritime navigational techniques.
His 1513 World Map wasn’t discovered until 1929 and is known as one of the oldest maps of America that exists.

The map, centered on the Sahra, was drawn on a small piece of preserved gazelle skin.
Only one-third of the map survived, but was discovered at the Topkapı Palace in Istanbul, where it is today — though not on public display.

Controversy

While the map was discovered in the 1920s, it wasn’t until later, in 1965, when Charles Hapgood published a paper about the history of Antarctica.
Hapgood, a University of New Hampshire professor, studied Piri’s map in his research and included many theories about it in his book, Maps of the Ancient Sea Kings.

His research found some interesting results that are hard to find modern explanations for.
For one, it appears that Piri Reis’ map in 1513 was drawn using a Mercator Projection — a cartography technique developed by the Flemish geographer in 1563 that is used today as the standard map projection.

This method illustrates how Earth’s cylindrical shape impacts the illustration of maps.
Since this methodology was undiscovered until the late 16th century, researchers are baffled by Piri’s apparent use of the Mercator Projection.

One possible explanation points to Piri’s different source documents that he used to create his own maps.
It was known that Piri studied 20 different maps and charts, including Greek, Portuguese, and Arabic, and Christopher Columbus even draws one.

With Piri’s in-depth study of these maps, his use of the Mercator Projection is possibly explained by the Greeks, who also used astrological and geological calculations, including latitude and longitude, to draw maps.

However, it continues to be impressive, as this type of spheroid trigonometry wasn’t widely used until the middle of the 18th century.
This proved that early map makers not only knew that Earth was round, but they were accurate within 50 miles of its actual circumference.

Piri Reis’ maps have baffled scientists and researchers as they look for answers to explain how accurate a cartographer in the 1500s was.
And even with a possible explanation for his mapping style, one aspect of Piri’s 1513 World Map remains unsolved — How did he know to incorporate Antarctica centuries before it was even discovered?

Antarctica Uncovered

As Professor Hapgood and others studied Piri’s maps, they noticed that Antarctica was included in the drawings — but was drawn without its ice caps.
This astonished scientists, as 97.6% continent today is covered in ice — and has been for over a million years, according to most estimates.
How could he have included a map without Antarctica’s ice caps?

Piri’s map is so accurate that even the in-lands and topographical representation are identical to today’s modern-day maps of Antarctica.

Some have speculated this could have resulted from alien civilization or other strange, unknown supernatural occurrences without a clear explanation.
How else could Piri Reis’s source maps accurately illustrate a continent without aerial surveying from 600,000 years ago?

One theory is that Piri Reis used a source document with information older than 4,000 BCE.
But, this would mean that an ancient civilization would have had the sophistication to navigate the world and chart the lands before any well-known language or technology.

Others who have studied Piri Reis’ map believe that aliens aren’t to thank for the early discovery of Antarctica.
But instead, theorize that a shift in the Earth’s axis caused part of South America to break off, forming what is known today as Antarctica.
The representation of Antarctica on Piri’s map is also a close representation of South America’s coastline, where Uruguay and Argentina are joined.

In his research, Hapgood offers that the shift in the Earth’s axis could have caused the piece of land now known as Antarctica to break off from South America and move thousands of miles south, where it is now covered with ice.
Scientists have dispelled this theory, though, and say it is impossible to occur.

—

From what we know about Piri Reis cartography, he included that he didn’t conduct the original surveying shown in his maps.
But instead, compiled a large number of source maps that date back to the 4th century BC or earlier.

While the historical depiction of the map is impressive, some would argue that humankind’s ability to pass down information from century to century with great accuracy is even more impressive.

While maps earlier than Piri Reis have either been destroyed or undiscovered, some argue that Piri’s map points to a lost civilization with technology greater than what mankind knows today.
Scholars generally dismiss these claims, but others argue that we should view history more openly.

The inclusion of Antarctica is yet to be explained.
But one thing is for sure — Piri Reis’ 1513 World Map is a stunning example of unsolved mysteries of our world and how much more there is to uncover.

Links :

Saturday, December 24, 2022

Incredible collapse triggered by glacier calving

An incredibly large chunk of the Grey Glacier's ice-sheet breaks off and flips over in a spectacular way in Southern Patagonia, Chile.
The ice-sheet of the Grey Glacier is currently declining due to increasing temperatures and changes in rainfall. It is part of the 'Southern Patagonian Ice Field', the world's 2nd largest contiguous extrapolar ice field and the largest freshwater reservoir in South America.
The Grey Glacier is famous for insane glacier wall collapses during the summer when large icebergs – often up to 100 feet in height – are breaking off the glacier and collapsing into the water of the 'Lago Grey'.
In the right time of the year big blocks of ice break off the glacier and drop into the water.
The waves created by such glacier calving events often splash dozens of meters through the air.
The glacier itself is about 6 km (3.7 mi) wide and has an average height of over 30 m (100 ft) above the surface of the water.
Thankfully, no-one was injured as boats stay at a safe distance from the glacier (for a good reason). Glacier calving, also known as ice calving, or iceberg calving, is the breaking of ice chunks from the edge of a glacier.
The sudden release and breaking away of a mass of ice from a glacier or iceberg often causes large waves around the area and can result in a "shooter" which is a large chunk of the submerged portion of the iceberg surfacing above the water.
The ice that breaks away can be classified as an iceberg, but may also be a growler, bergy bit, or a crevasse wall breakaway.
The entry of the ice into the water causes large, and often hazardous waves.

Friday, December 23, 2022

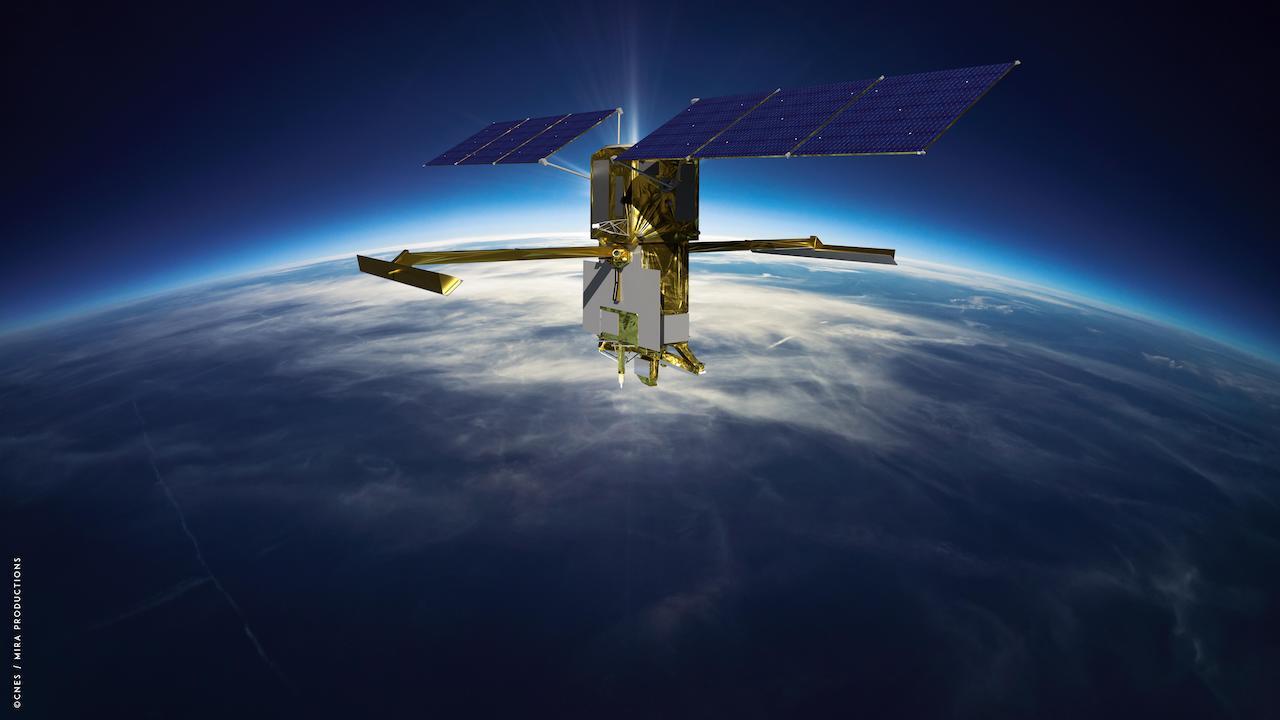
SWOT satellite: bringing Earth's coastlines into focus


Artist's rendering of the Surface Water and Ocean Topography (SWOT) satellite with solar arrays fully deployed.
Credit: CNES


From NASA y Pat Brennan, NASA's Sea Level Change Team

The SWOT satellite’s sharper, clearer view of water levels around the world promises to fill a stubborn observational gap: coastal sea level, the information that can help coastal communities plan for the potentially devastating effects of rising seas.

Once deployed in space after its launch from Vandenberg Space Force Base on Dec.
16, the Surface Water and Ocean Topography (SWOT) satellite will make measurements of sea-surface height with higher spatial resolution than any previous orbital platform.
That means currents and eddies larger than 10 miles (16 kilometers) across, a 10-fold improvement in satellite resolution.
The satellite will be capable of measuring sea-surface height close to the coast and even within estuaries and river deltas worldwide.

“It’s going to revolutionize coastal science,” said Marc Simard, a senior scientist at NASA’s Jet Propulsion Laboratory in Southern California and a member of the SWOT science team.
“SWOT will also provide us with reliable tools to support management of our coastal landscape.”

The turbulent and variable coastal zone remains largely mysterious because it’s so difficult to measure.
But it’s also essential to anticipate climate-driven changes where land meets water: increased flooding, storm surge and altered topography.
These kinds of changes will bring profound consequences for coastal communities and ecosystems.

SWOT’s higher resolution is the key to closing observational gaps.
Tide gauges, instruments on the surface that keep track of sea levels, can have long records but spotty coverage on many of Earth’s coastlines.

And previous satellites using altimeters – which bounce signals, usually radar, off surface features to measure their height – track too broad a swath to clearly resolve complex coastal features.

“Satellite altimeters measure to within a few tens of kilometers of the coast,” said Ben Hamlington, a NASA sea level scientist at JPL.
“SWOT will get even closer, to less than 10 kilometers. So it’s going to fill that satellite observation gap. And it will be a potential bridge between open-ocean altimetry and tide gauges at the coast.”

The key to gaining such a high-resolution picture of Earth’s ocean is SWOT’s Ka-band Radar Interferometer (KaRIn) instrument.
The radar pulses it bounces off the surface are captured on their return by two antennas, mounted at opposite ends of a 33-foot (10 meter) boom.
That allows the antennas to scan two parallel swaths of Earth’s surface on either side of the satellite, each swath some 30 miles (50 kilometers) wide.
This, in turn, helps to precisely triangulate the height of water.

SWOT will cover the entire surface of Earth between 78 degrees north and 78 degrees south latitude at least once every 21 days.
That will provide a far more complete picture than previous satellites, including of the tumultuous coastal zone.

New Tools to Anticipate Coastal Change

As sea levels rise in the decades ahead, coastal managers, civil engineers and others will have to make difficult – and potentially expensive – decisions: building barriers against the surf, siting new development projects at higher elevation, engineering new drainage and channel systems.

Mitigation work will be needed to protect coastal infrastructure such as homes, energy facilities, and military installations.

Planning such projects relies on computer models that preview their possible effects.
But at the moment, satellite data on the coastal zone lacks the precision accurate modeling requires.

“We don’t have the measurements, so the hydrodynamic models that we’re building are wrong,” Simard said.
“We need measurements to calibrate and validate the model.
SWOT will provide that globally.”

Not only coastal infrastructure but agriculture and natural ecosystems will likely see significant alteration.

“You might have rice fields or shrimp farms or whatnot,” Simard said.
“We can use those models to manage the situation, or prevent unforeseen issues.
Or at least, foresee the issues.”

Major concerns include loss of biodiversity as coastal wetlands vanish, or perhaps become salinity as seawater penetrates farther inland.

Even decisions about human health could be influenced by SWOT’s observations.
These are expected to help researchers understand how – and where – the ocean absorbs heat and carbon, which affects global temperature and the pace of climate change

“SWOT will finally zoom in on our coasts and bring into focus issues related to both water quantity, like coastal sea level rise and flooding, and water quality that impacts eco- and human systems,” said Nadya Vinogradova Shiffer, SWOT Program Scientist and Manager at NASA HQ, Science Mission Directorate in Washington.
 
More About the Mission

SWOT is a collaboration between NASA and the French space agency, Centre National d’Études Spatiales (CNES), with contributions from the Canadian Space Agency (CSA) and the UK Space Agency.
NASA’s Jet Propulsion Laboratory leads the U.S.
component of the project.

For the flight system payload, NASA is providing the Ka-band Radar Interferometer (KaRIn) instrument, a GPS science receiver, a laser retroreflector, a two-beam microwave radiometer, and NASA instrument operations.
CNES is providing the Doppler Orbitography and Radioposition Integrated by Satellite (DORIS) system, the dual frequency Poseidon altimeter (developed by Thales Alenia Space), the KaRIn radio-frequency subsystem (together with Thales Alenia Space and with support from the UK Space Agency), the satellite platform, and ground control segment.
CSA is providing the KaRIn high-power transmitter assembly.
NASA is providing the launch vehicle and associated launch services.
To learn more about SWOT, visit: https://swot.jpl.nasa.gov/. 
 
Links :

Thursday, December 22, 2022

For humpbacks, bubbles can be tools


From Hakai Mag by Doug Perrine

A lungful of air is like a multifunction toolkit for humpback whales.

On a breezy winter day in Hawai‘i, a team of researchers from Whale Trust Maui watched as a group of humpback whales cavorted around their boat.
The wind-rippled ocean surface distorted the view through the ocean–air interface, but one whale repeatedly swished its fins at the surface to produce a vortex that flattened the chop, creating a smooth spot where it placed its eye to look up at the scientists.
Photographer and researcher Flip Nicklin, having never seen vortices used in this way, dubbed them “whale windows.” At the end of the encounter, the whale used a different method to construct the window—it blew a perfect air ring from its blowhole, much like a smoker puffs a smoke ring, which again smoothed the surface.
Then, as before, the whale turned its head and looked up, meeting the researcher’s eye.
Was the whale using a bubble as a tool?

When primatologist Jane Goodall informed her mentor, anthropologist Louis Leakey, that she had observed a chimpanzee utilizing grass blades to extract termites from their mounds, he famously replied “now we must redefine tool, redefine man, or accept chimpanzees as human.”
Prior to Goodall’s 1960 observation, tool use had been considered a sharp line demarcating humans from animals.
Since that time, reports have emerged of tool use by birds, fish, reptiles, insects, crustaceans, cephalopods, and mammals, including dolphins and whales.

Just what defines a tool has nuance, but it’s generally agreed that it is a physical object other than the animal’s own body that is manipulated or oriented to affect something in the animal’s environment.
Studies over the past few decades suggest that water, like a spitting archerfish’s jet of water, and air, like a humpback’s bubbles, can be tools, too.

The first bubbles to be accepted as tools by scientists, back in 1989, were the spiral bubble nets deployed by humpback whales to corral and concentrate small fish or invertebrates.

Fred Sharpe, head of the Alaska Whale Foundation and a researcher who’s studied bubble-net feeding behavior for over two decades, says that humpbacks release bubbles in many other contexts, too, including as social signals such as when a male humpback blows a giant blast of air out of his mouth to intimidate a rival.
“Technically,” he says, “that [bubble] is kind of a tool.”
And Meagan Jones Gray, researcher and executive director at Whale Trust Maui, notes that bubbles are used on the breeding and feeding grounds in multiple ways by multiple individuals, including in male–male and male–female interactions.
“Bubble use is complex,” she says.

In over three decades of observing and photographing humpbacks, and participating in research projects, I’ve also observed these creative and adaptive whales using bubbles in various ways in different situations—some of which were previously unreported.
I’m tempted to describe the air in a humpback’s lungs as a Swiss army knife because I’ve seen whales do so many different things with it.
It is not actually a tool collection though, but a storehouse of raw construction material with which the whale can fashion a variety of tools.
Lacking free fingers and opposable thumbs, whales are unable to create and use tools in the same way as humans, but reveal their intelligence through the manner in which they utilize other body parts for tool production and use.


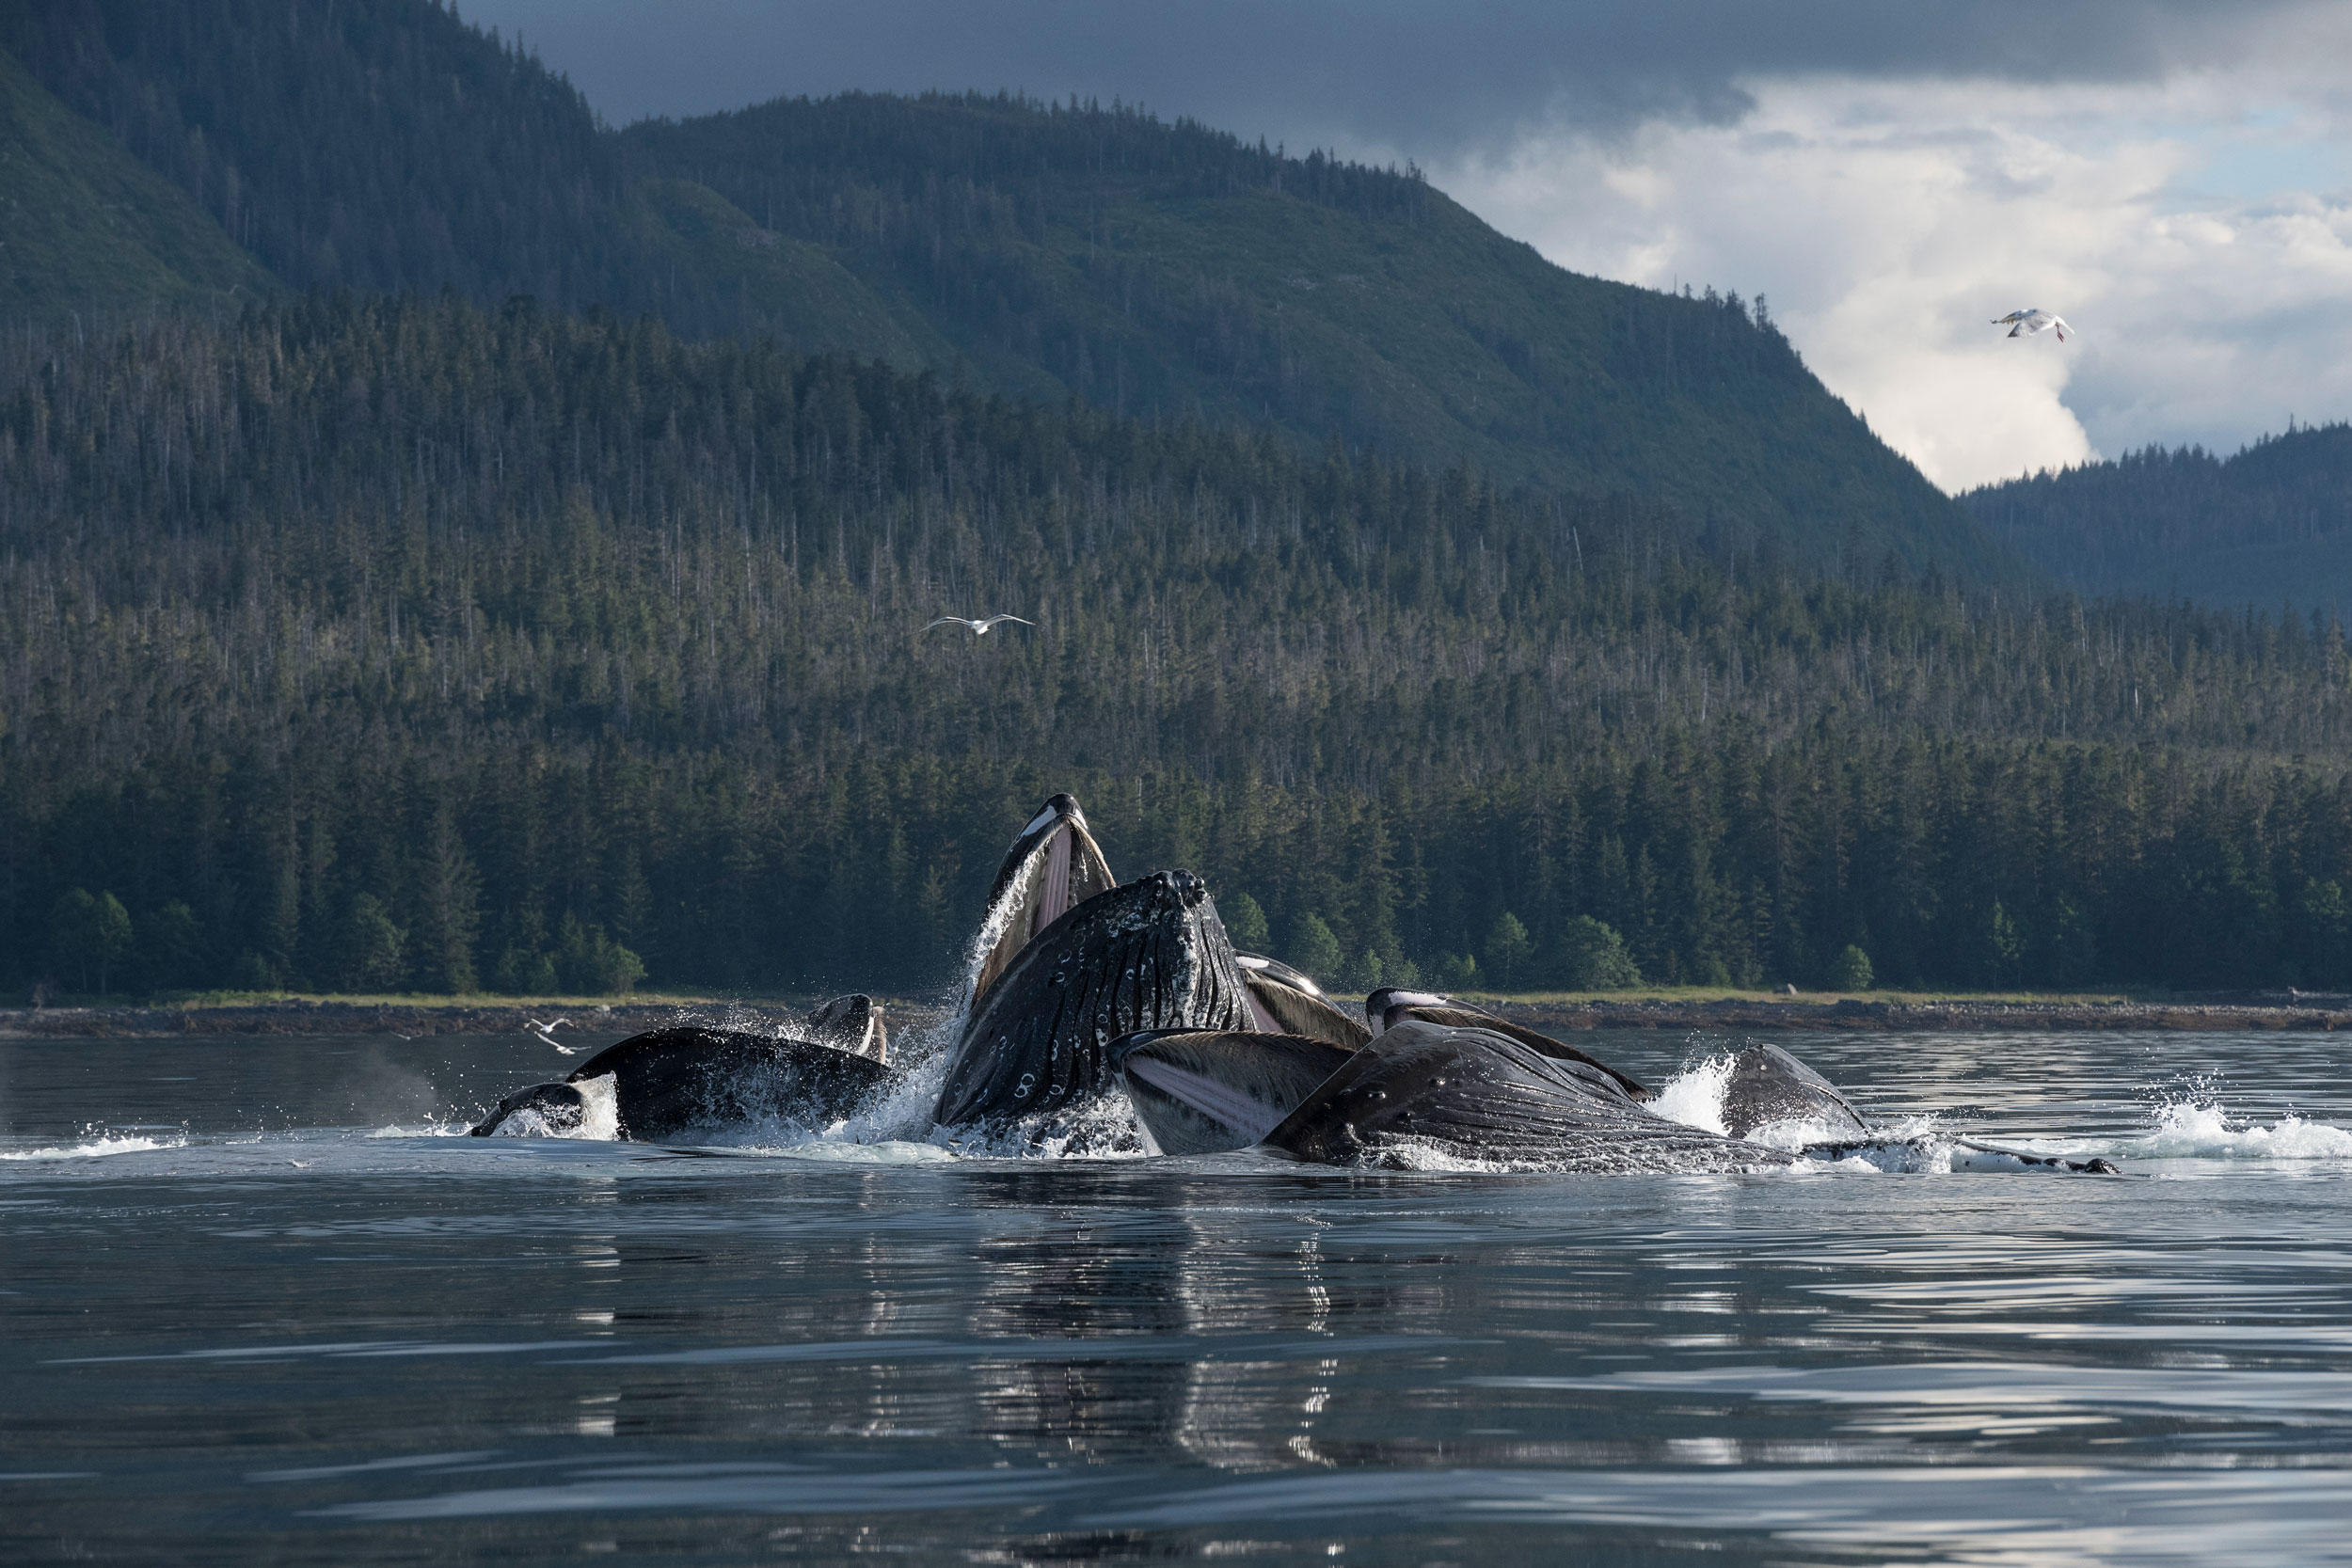
Photo by Paul Souders

In the first photo, a group of humpback whales surfaces in the middle of a bubble net in Alaska.
Mouths agape, the whales gorge on the herring trapped inside the spiral curtain of bubbles.
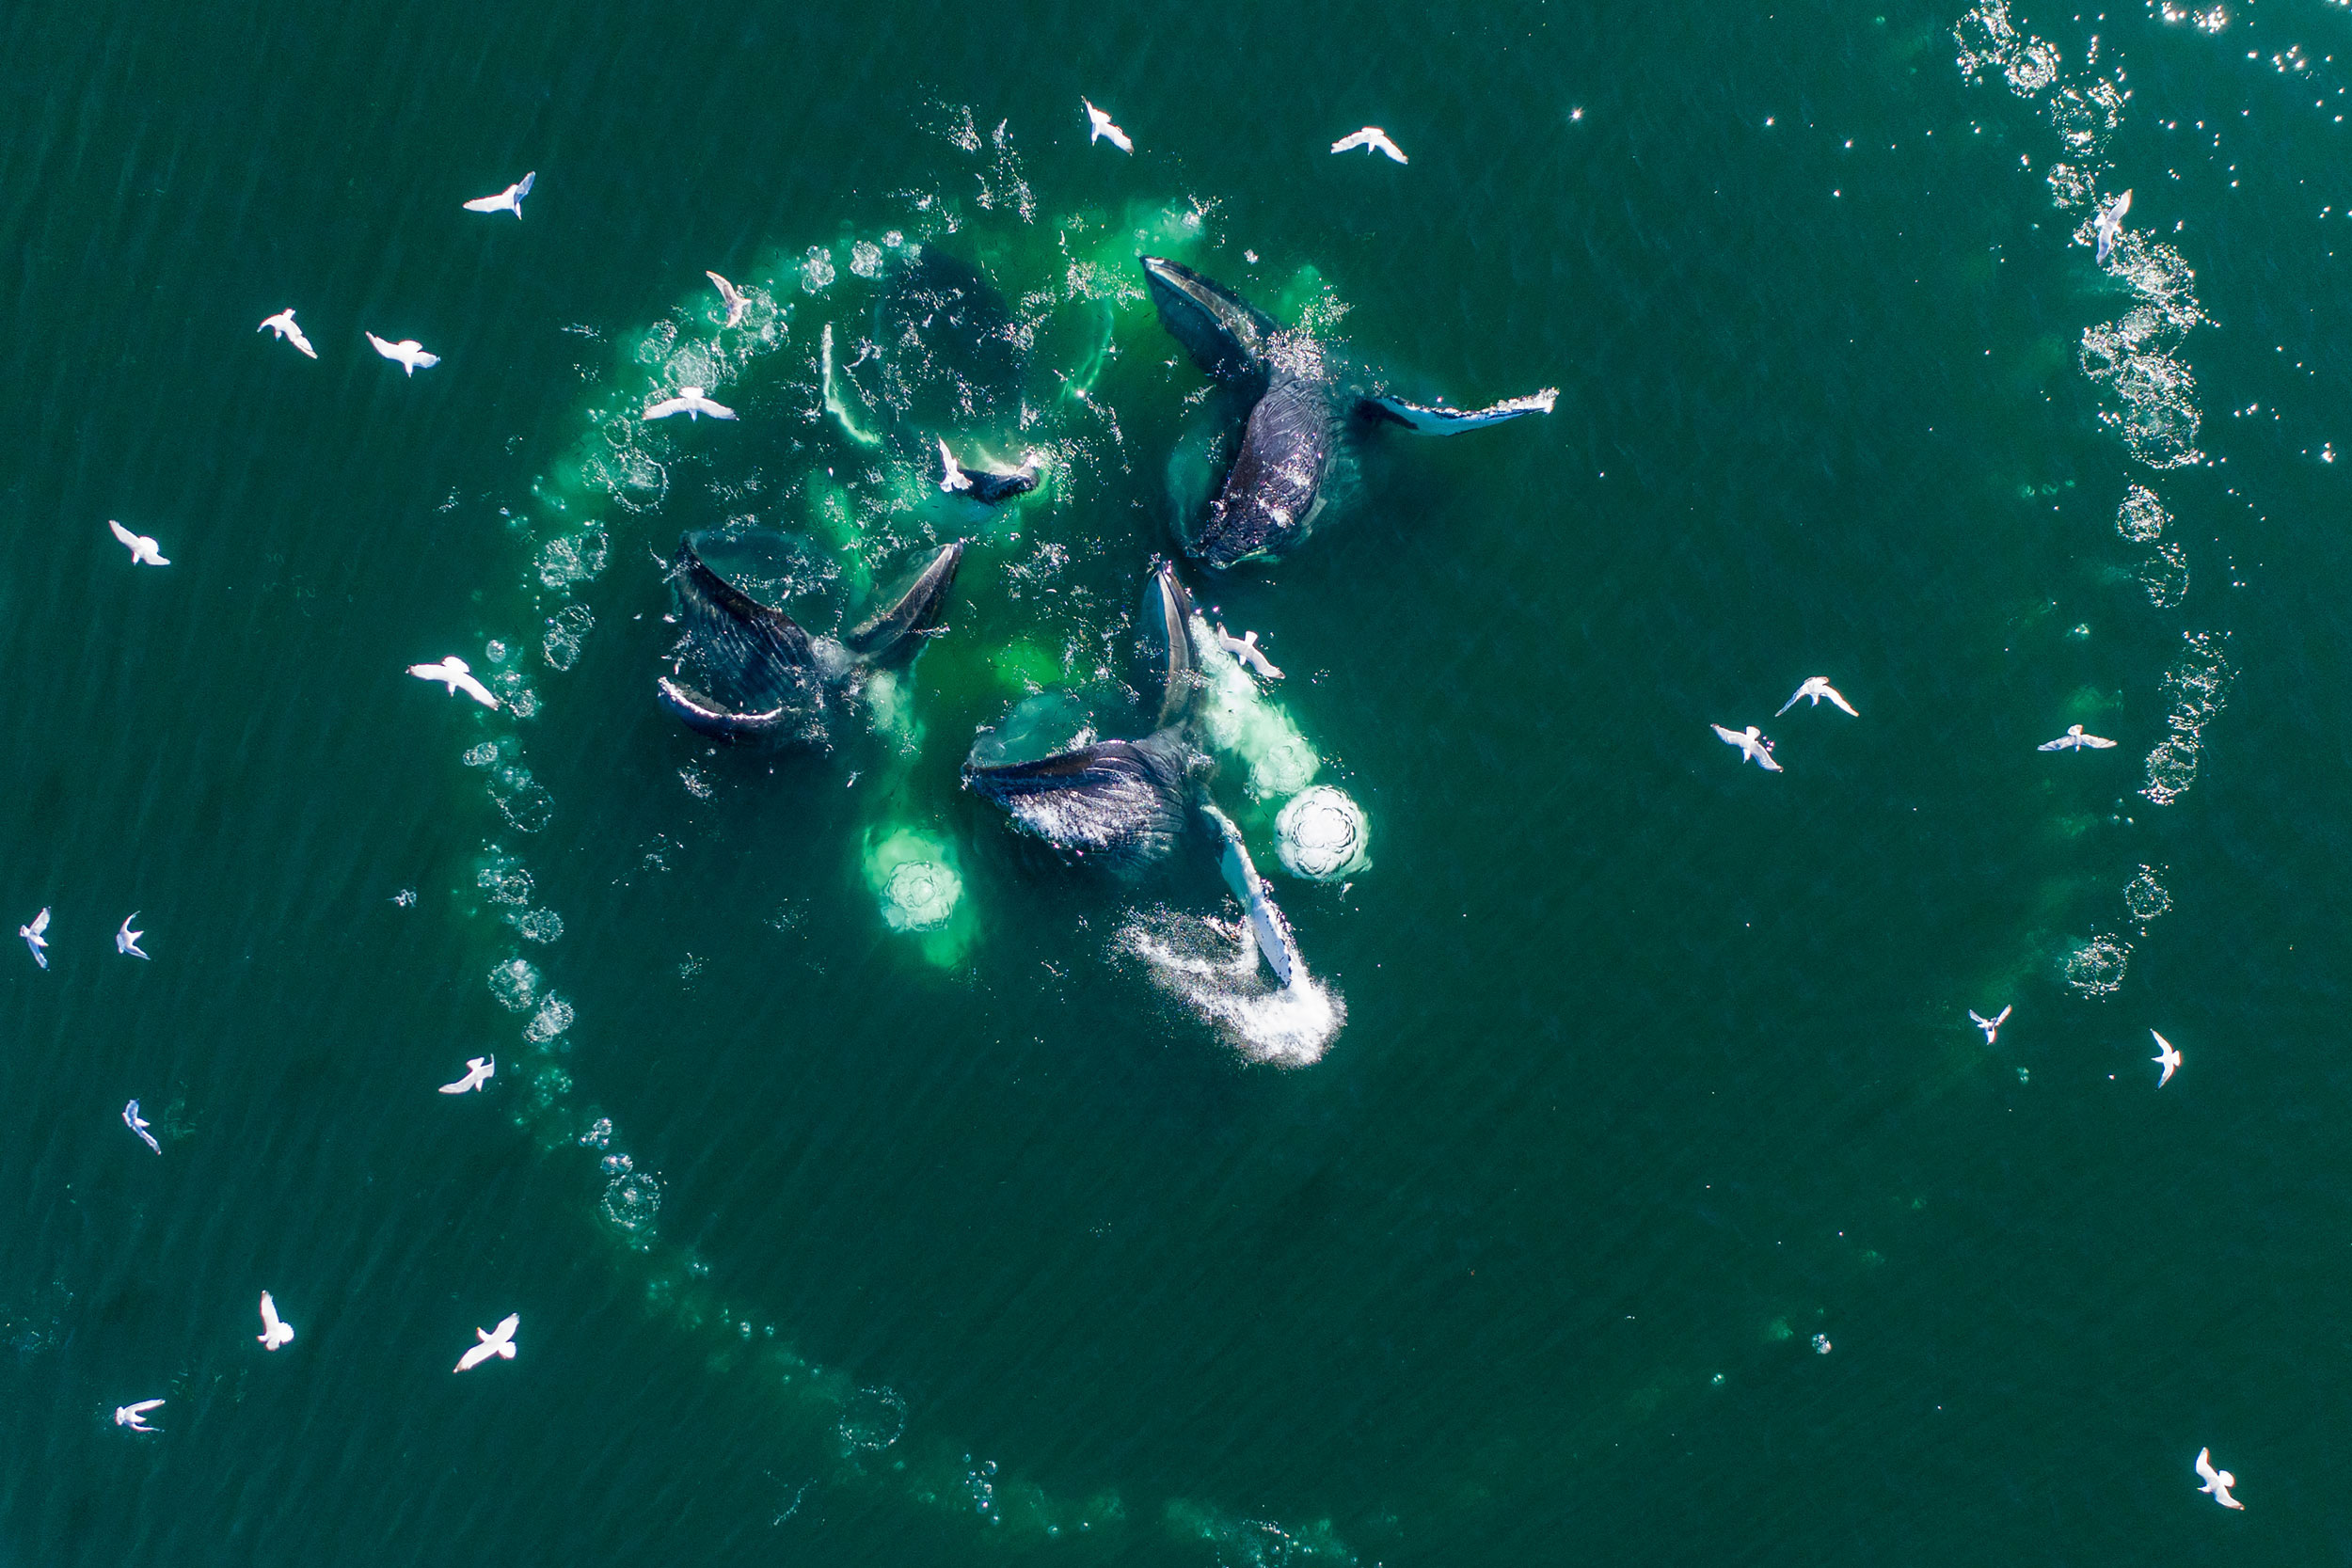
To create the wall of bubbles, one whale—or occasionally two or even three—circles a school of fish in ever-tightening loops while releasing a steady stream of air.
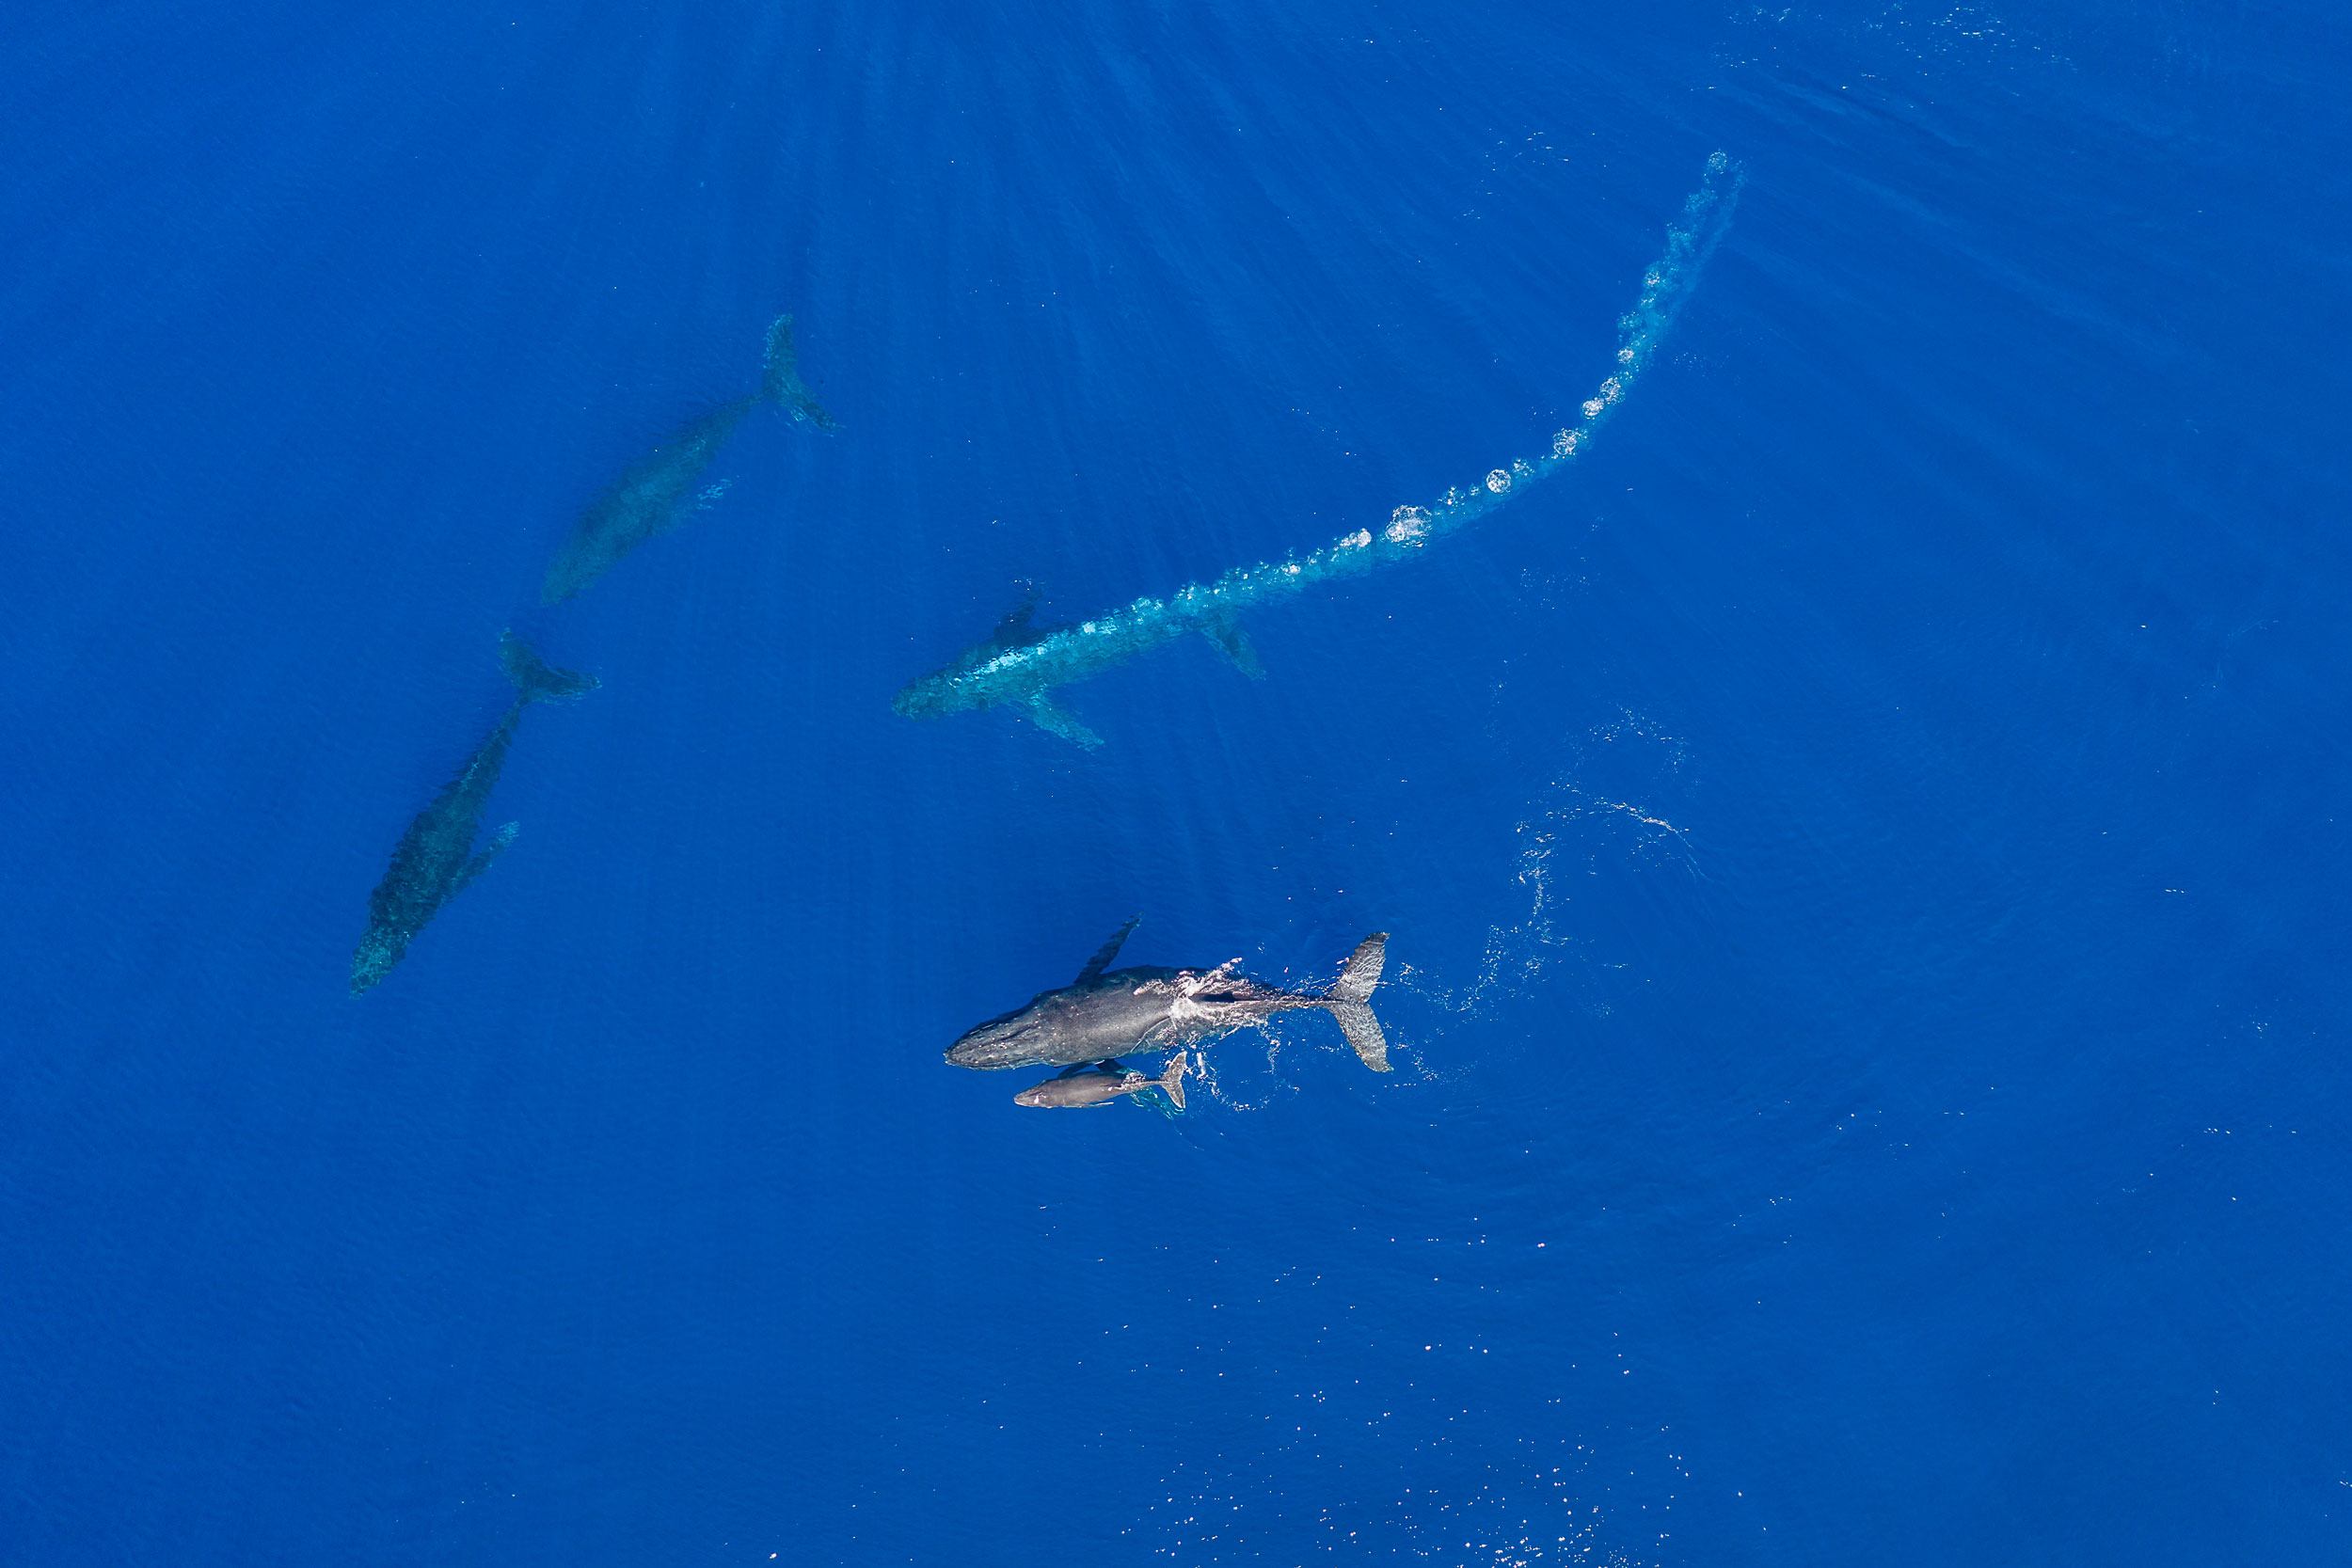
(The second photo gives an aerial view of a bubble net made by a different group of whales.) As the bubble net is created, other members of the group perform specialized herding maneuvers that increase the efficiency of the prey capture.


In this encounter, I watched a female swim with her young calf (lower center) and a male escort off her right side.
As two male challengers moved in to intercept her, the escort charged between the female and the two challengers while blowing a massive bubble trail.
Perhaps the bubbles served to partially obscure the female from the challengers or to visually disorient them, but they may have also advertised the escort’s dominance and aggression.
Sometimes a challenger responds to such an encounter with a bubble trail of its own.
Aggressive males may also release blasts of air bubbles from the mouth.

Christine Gabriele, a researcher with the Hawai‘i Marine Mammal Consortium, agrees that this use of bubbles could be considered use of a tool.
“Absolutely,” she says.
“They’ve created a structure out of nothing and are using it in a particular context for what seems to be a purpose that is clear to us.”


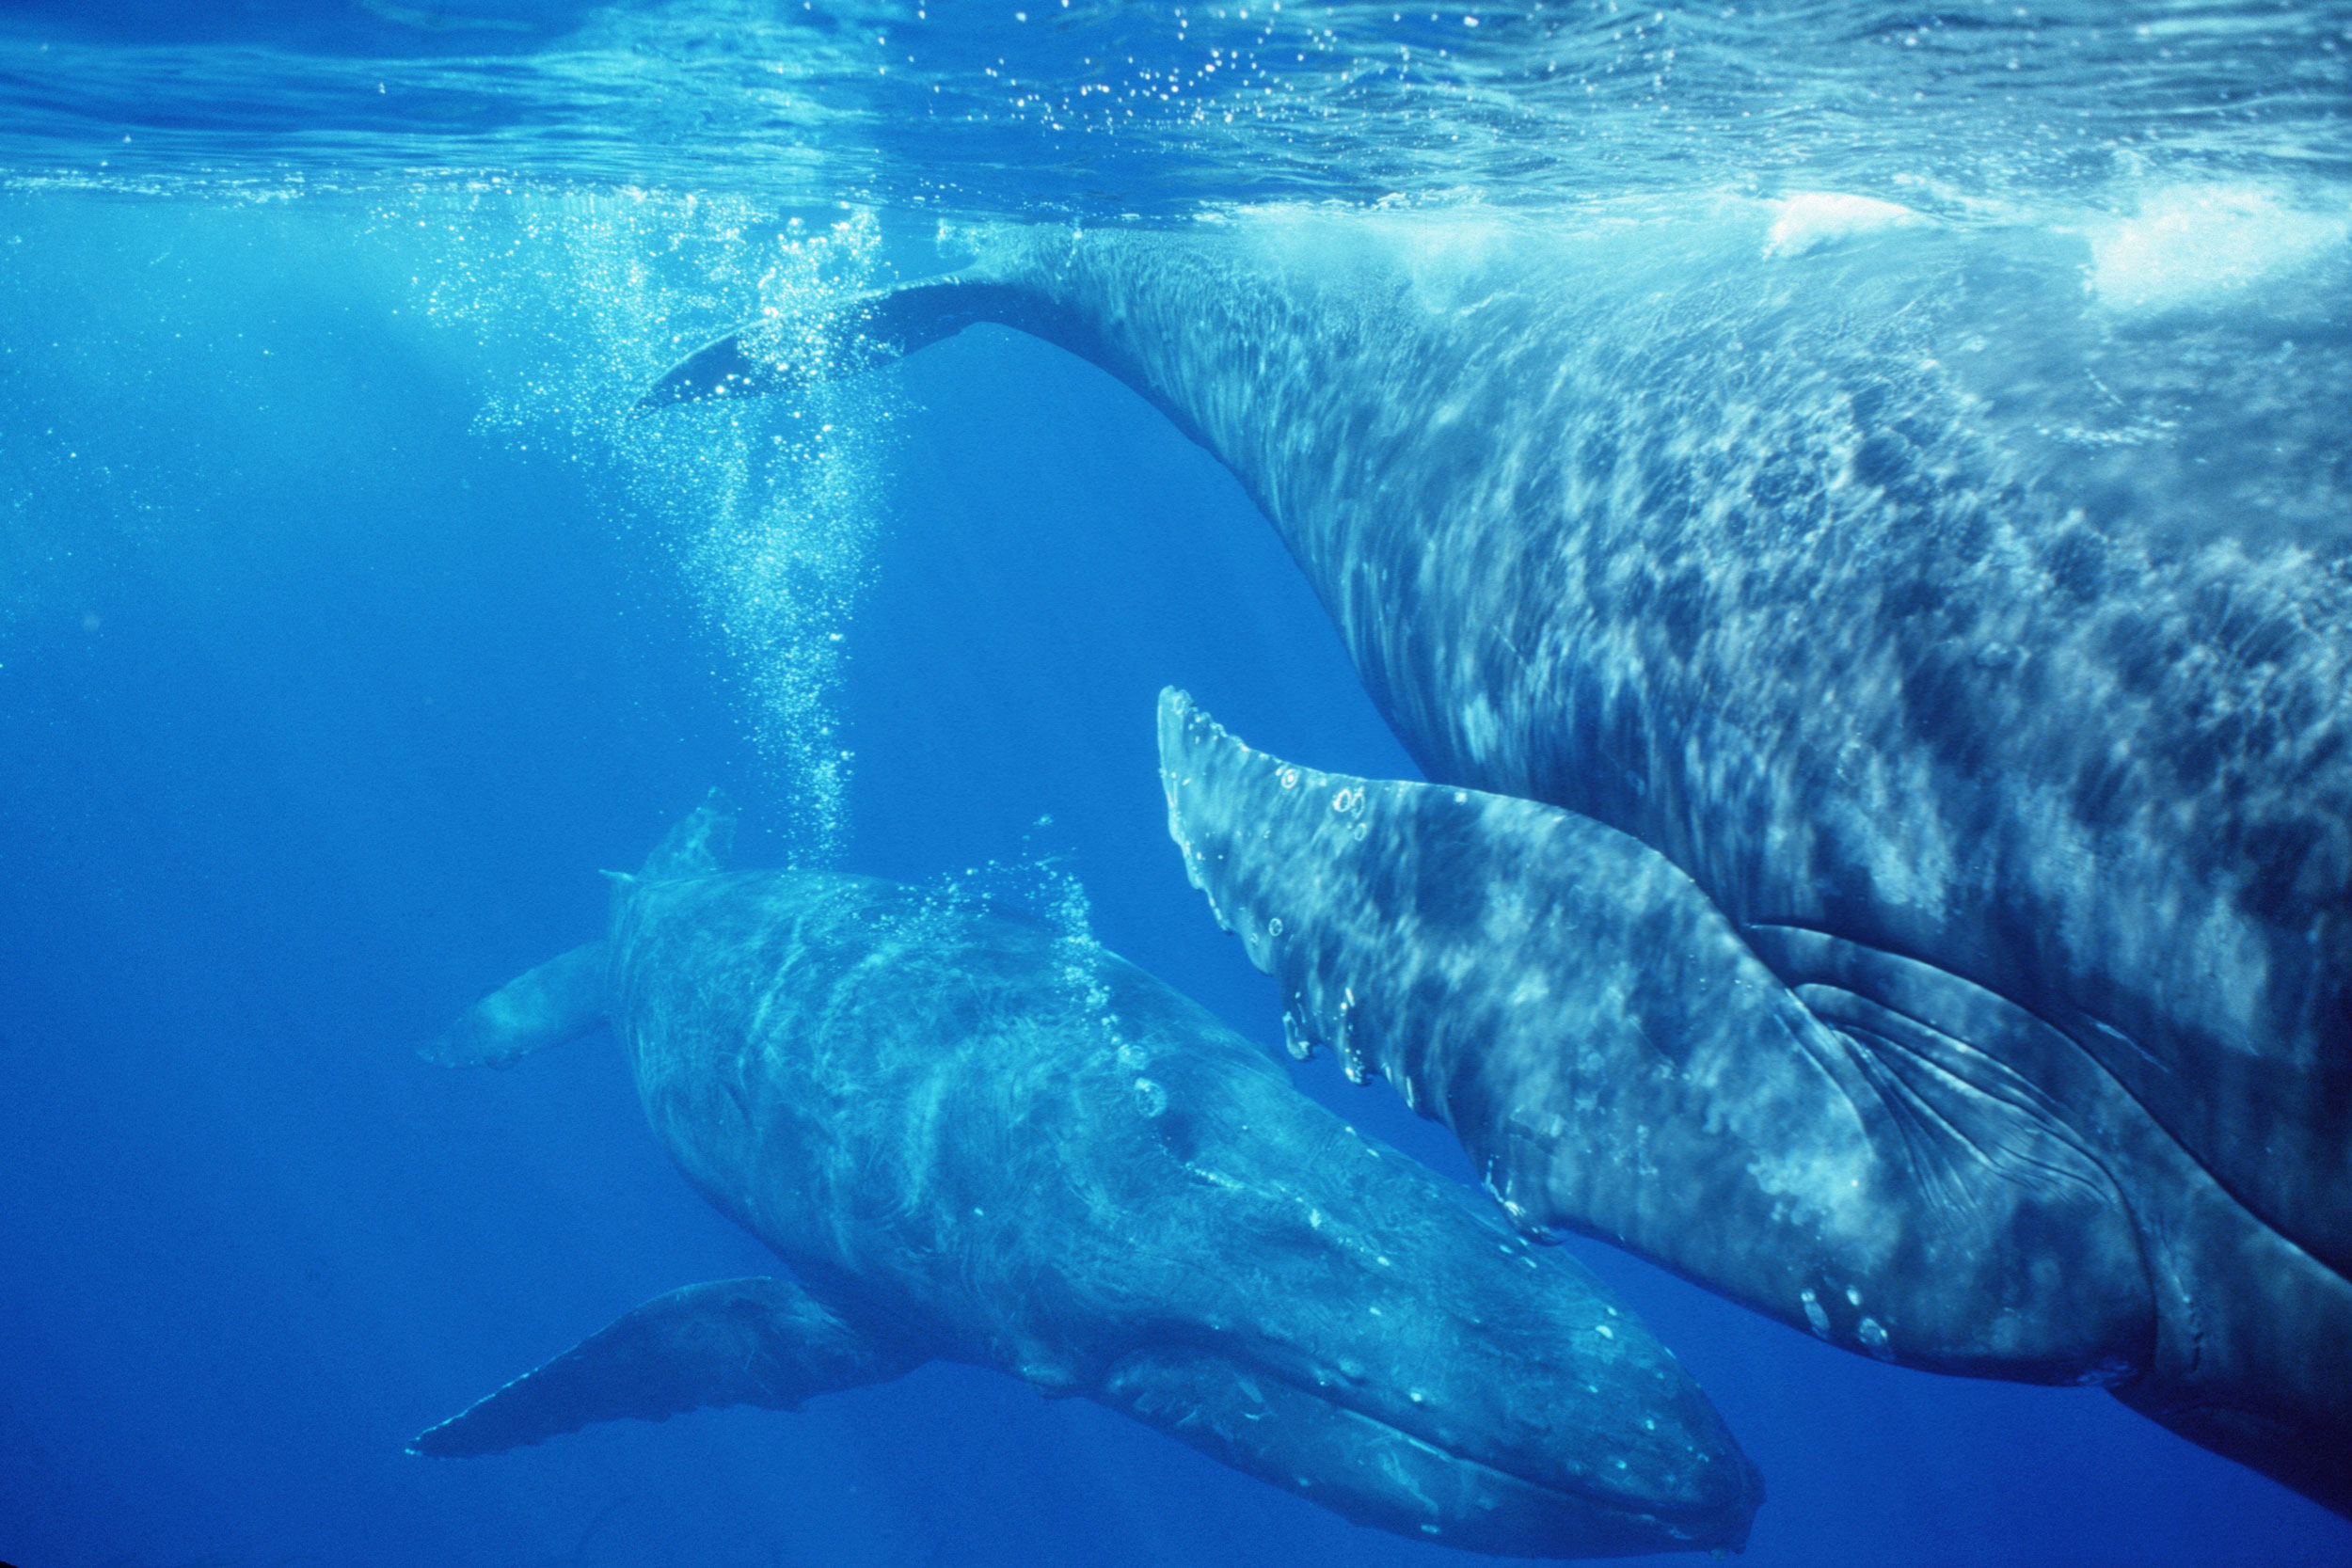
In this underwater view, a male escort blows a bubble stream while following a female with two male challengers in pursuit (out of frame).
Such a case is “clearly … an antagonistic signal,” says Sharpe.
“He’s saying, Back off or I’m gonna wallop you! It’s a tool signaling that you’re willing to escalate or you’re pissed or you’re coming in.” And it’s not an idle threat.
Competition between male humpbacks for access to females sometimes leads to injury, and, on the rare occasion, to death.


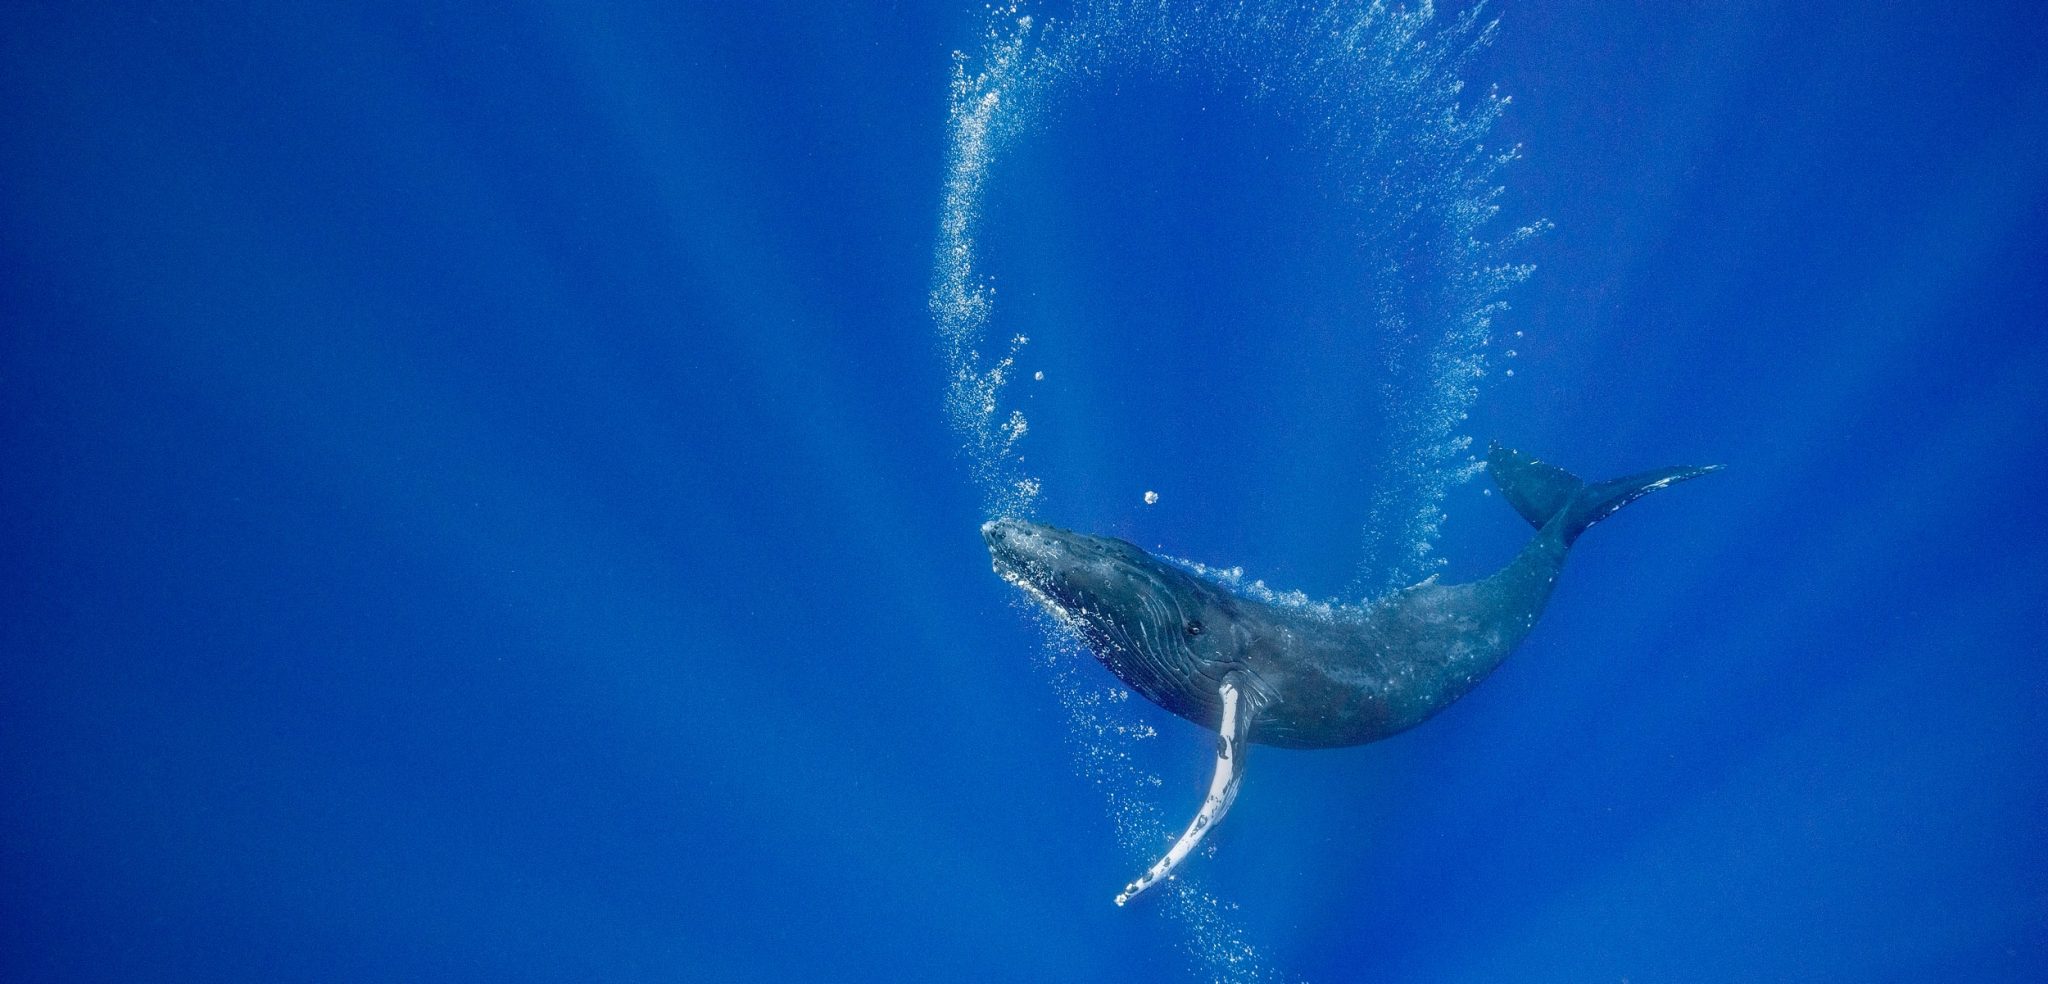
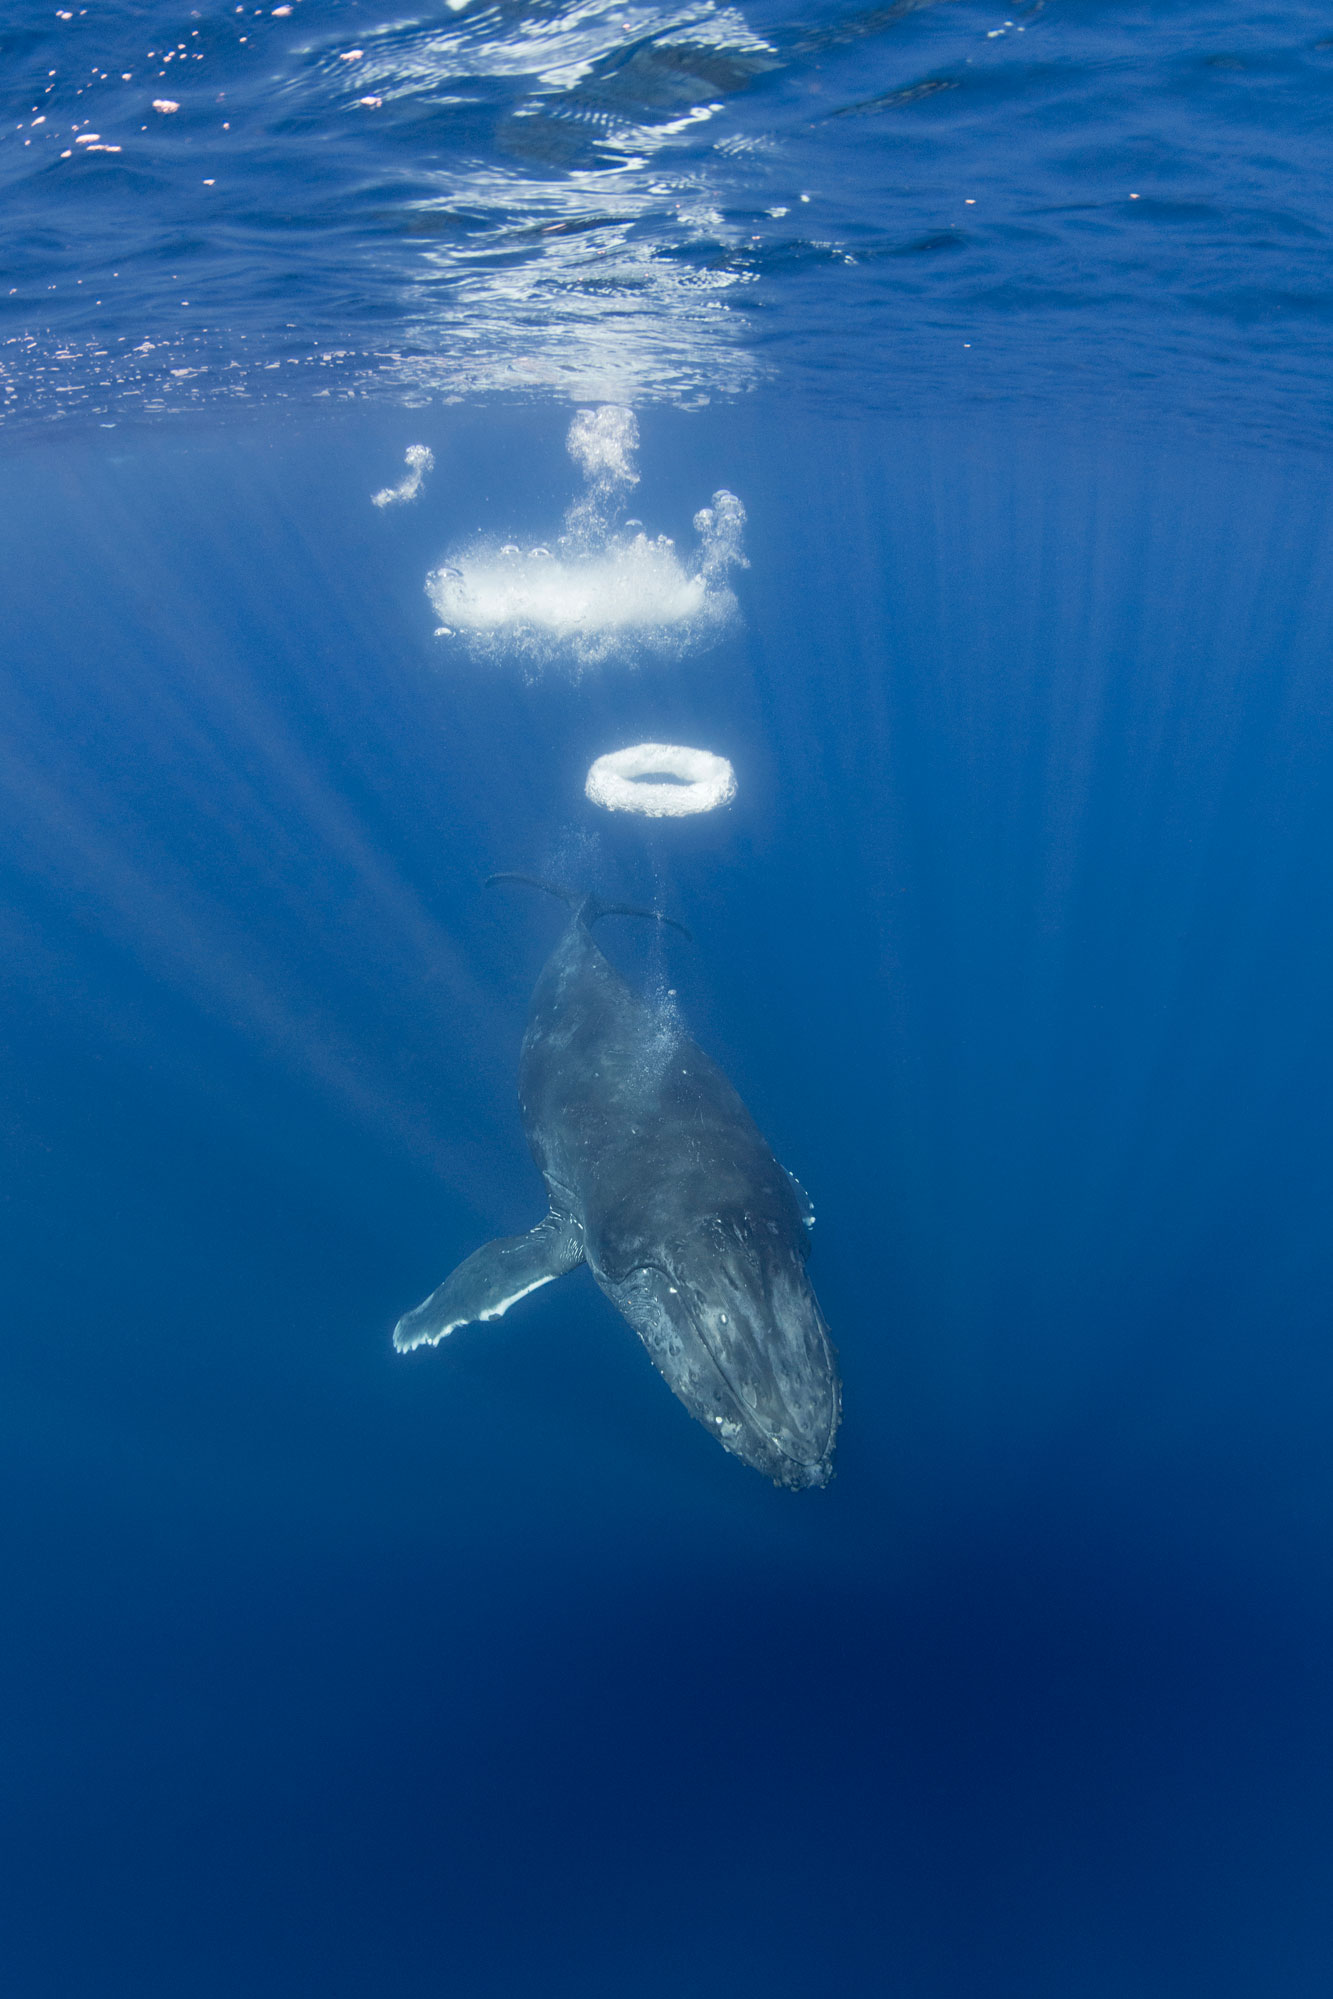
This yearling female humpback approached my boat repeatedly over a period of more than an hour, often blowing sequences of perfectly formed bubble rings.
Was she attempting to communicate?
Did she want to play? Why did she blow bubble rings only when approaching the boat?

Sharpe notes that in thousands of hours of drone observations of humpbacks interacting only with each other, his pilots have never seen a bubble ring.
“Humans trigger this behavior,” he says.
“It’s a play object but it also has an uncanny interspecies component to it.” Humpbacks have only rarely been reported making bubble rings in the northern hemisphere—and there are no reports of it in the southern hemisphere.
I feel very fortunate to have seen this behavior twice, 19 years apart.


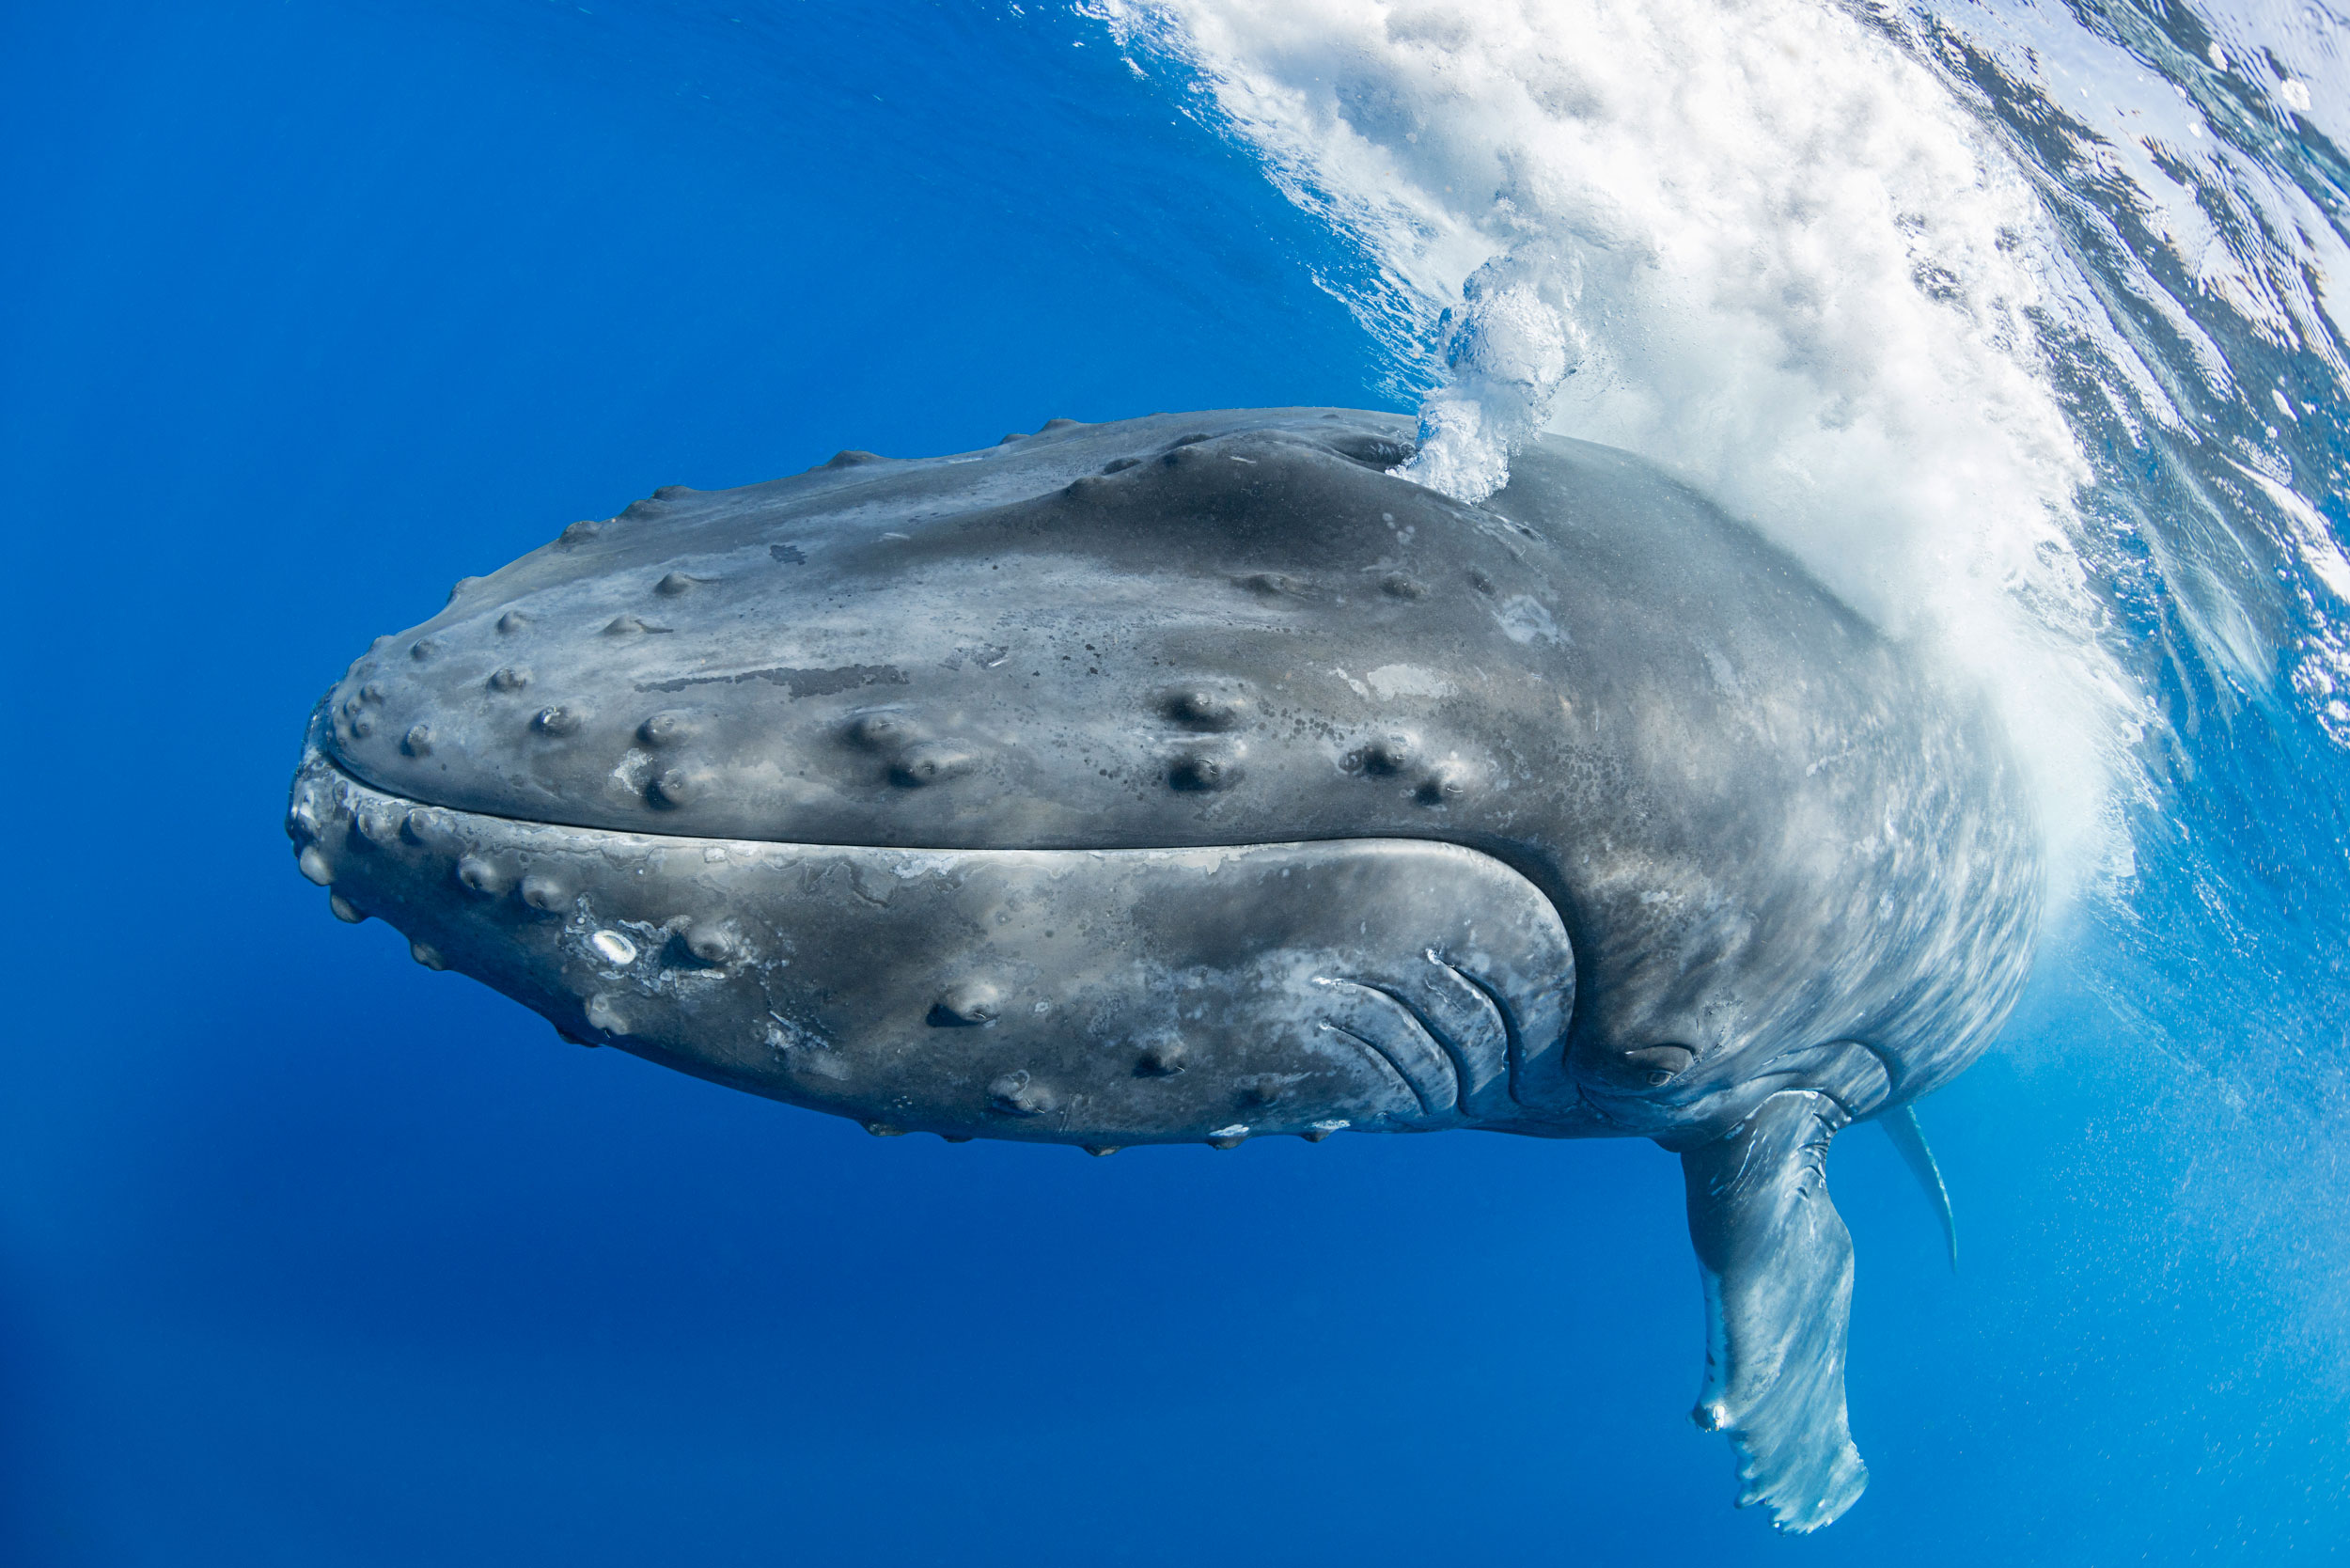
The same yearling female who created the bubble rings also released massive air clouds a couple of times when approaching our boat.
Humpbacks are known to release bubble blasts both from their mouths and from their blowholes.
However, these displays are usually produced by adult males during competition for a female.
Was this loud and forceful exhalation aggression or play?

California State University Channel Islands professor emeritus Rachel Cartwright, who studies humpback whale mothers and calves in Hawai‘i as lead researcher for the Keiki Kohola Project, says that seen from the air, the use of bubbles “seems very orchestrated and purposeful.” Given how often adults use bubbles, she thinks that skill with bubbles would carry an advantage.
“And that’s often seen by behavioral ecologists as a justification for the costs of ‘play,’” she says.


The female on the right of the frame was being followed by two males when she parked herself next to our research vessel.
One of the males slowly approached her from behind, and when he was beneath her started to release a slow, thin stream of bubbles that rose up under her genital area as she floated motionless.
Whale Trust Maui researchers Gray, Nicklin, and Jim Darling have documented near-identical behaviors.
They propose that bubbles could be used in courtship, mating, and/or during the birthing process.
Bubbles, for instance, might provide precopulatory stimulation, or, if the female is pregnant, could stimulate the release of birthing hormones such as oxytocin.
(Photo taken under NMFS research permit #633 issued to Hawaii Whale Research Foundation.)


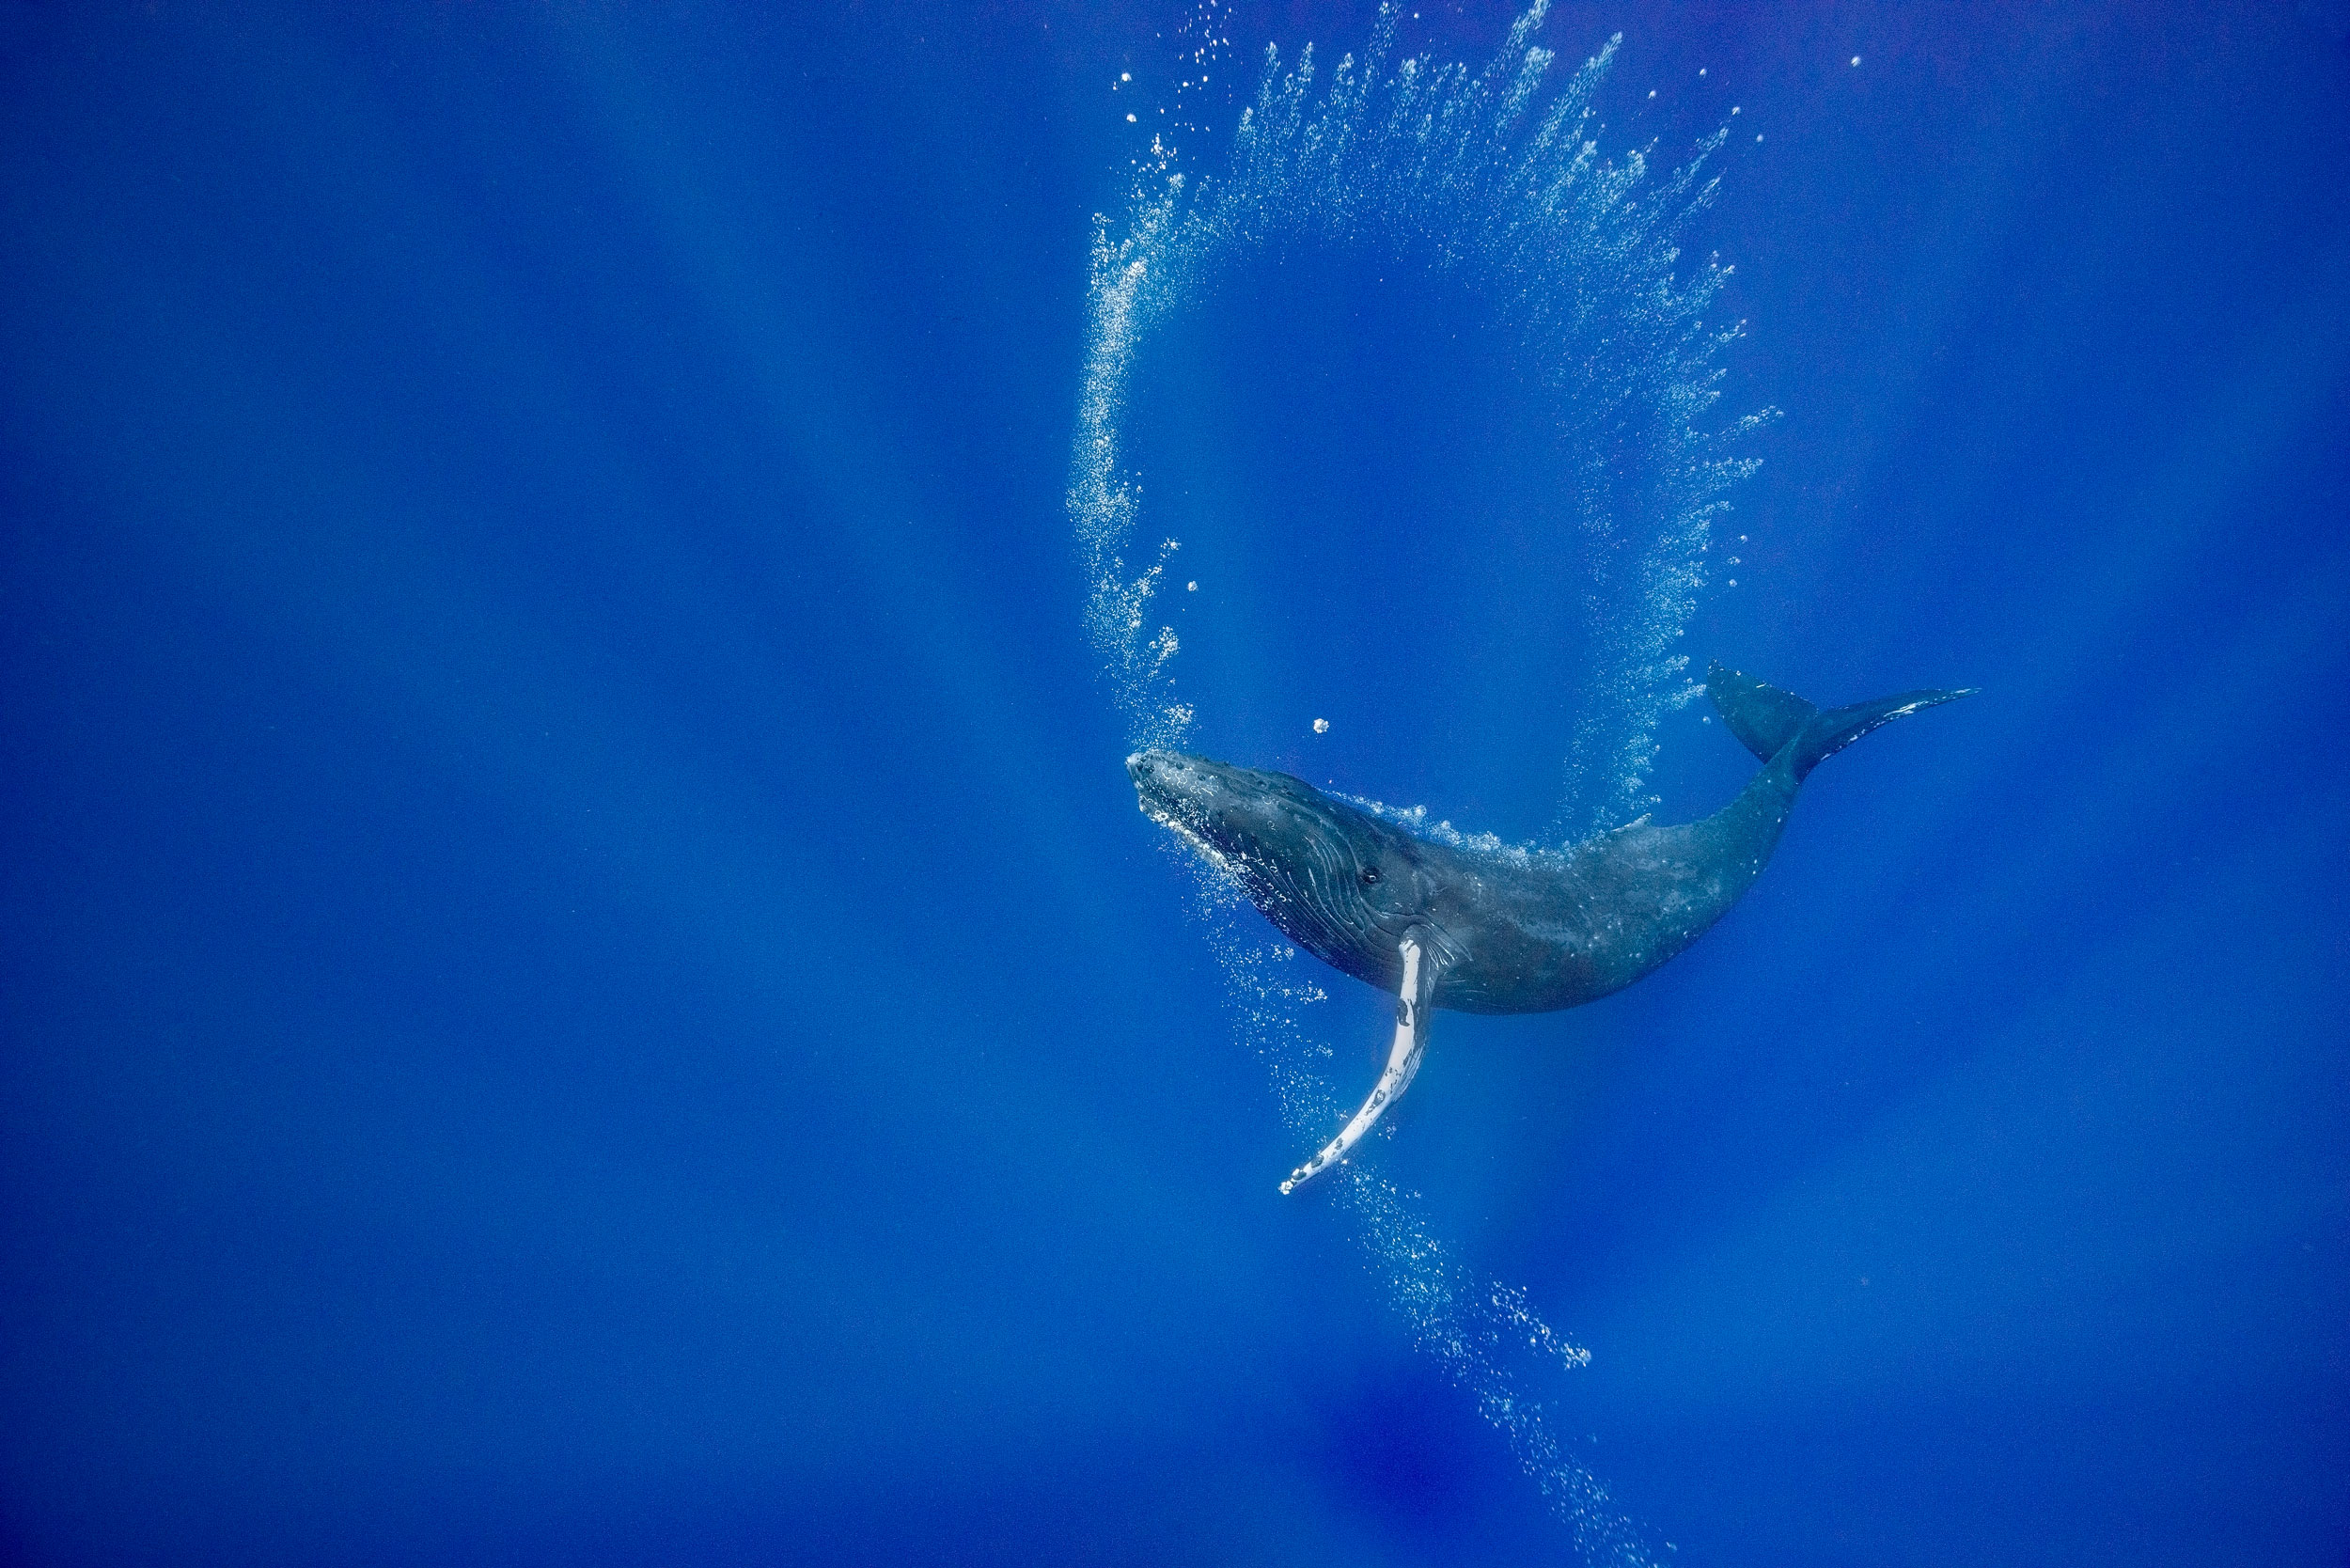
This young female whale approached my boat, then dove and began “drawing” with bubble curtains released in a thin stream from her blowhole.
There was no food around and no other whales in sight.
She rolled to one side so that she could look upward to admire her handiwork.
Was she practicing making bubble structures that could be useful tools on the feeding grounds, or was she just enjoying the visual beauty of the scintillating bubble spirals?
Was it art for art’s sake?
Certainly, other animals, including captive dolphins, sea lions, rhinos, and elephants have learned to paint with brushes, and both wild bowerbirds and pufferfish produce visual art to impress potential mates.

Play in animals often facilitates the practice of behaviors that are developed into useful survival skills later in life.
Perhaps this young whale’s play with bubble production was an adaptive behavior as bubble-blowing skills will be useful to her as an adult.
I like to think that she may have just been satisfying a creative urge and enjoying her display as much as I did.

Links :