Wednesday, December 21, 2022

What happened to the lighthouse of Alexandria?


A drawing of the Pharos of Alexandria by Prof. H. Thiersch (1909).


From HistoryDefined by Carl Seaver

Between the third century BC and the fifth century AD, the city of Alexandria, named after Alexander the Great and sitting at the mouth of the River Nile Delta in northern Egypt, was one of the greatest cities in the world.

While Rome grew to become the political center of the Mediterranean world, Alexandria was its intellectual heartland and the economic hub of the Eastern Mediterranean.

Hundreds of thousands of visitors visited the city yearly to trade, conduct politics or visit the famed Library of Alexandria, the most excellent repository of learning in the ancient world.

As a result, dozens of ships would have sailed in and out of Alexandria’s harbor every day.
As they did, they would have passed by an enormous lighthouse built on the island of Pharos in the harbor, casting light over the waters at night-time.

Standing over 100 meters tall, this tower was the famed Lighthouse of Alexandria, one of the Seven Wonders of the Ancient World. 

Map of Pharos Island and the Eastern Harbor. (Forster, 1961)

The Lighthouse of Alexandria

The Lighthouse of Alexandria was said to have been built by a Greek architect and engineer named Sostratus of Cnidus.

Sostratus is believed to have been hired by the Greek ruler of Egypt, Ptolemy I Soter.
He was employed early in the third century BC. Still, such was the enormous task of erecting the Lighthouse, the second tallest manufactured structure in the ancient world, that it took until around 280 BC to complete.

By that time, Ptolemy I Soter was dead, and his son Ptolemy II was the new ruler of Egypt.
We are lucky to have several detailed surviving accounts of the Lighthouse’s design and appearance, which ancient writers produced.

These authors, who include the first-century BC Roman geographer Strabo and the first-century AD writer and geographer Pliny the Elder, indicate that the Lighthouse was built across three levels.

At the bottom was a broad, square section that formed the main support for the thinner upper layers and rose to forty or so meters.
The second level was effectively an octagonal tower that rose to about 70 meters from the base of the Lighthouse, which was in turn followed by the third and final thin layer.

This was a circular tower, at the top of which was mounted a giant statue.

One used a broad spiral ramp to ascend the Lighthouse, which led up to the top where the light emitted.

The light was produced by a huge furnace in which a fire was kept burning almost continuously.
Next to this was a huge mirror that could reflect the sun’s rays to send messages to ships entering and leaving the harbor during the daytime when the furnace could not be used.

The nature of the statue atop the Lighthouse has been a source of endless debate. 
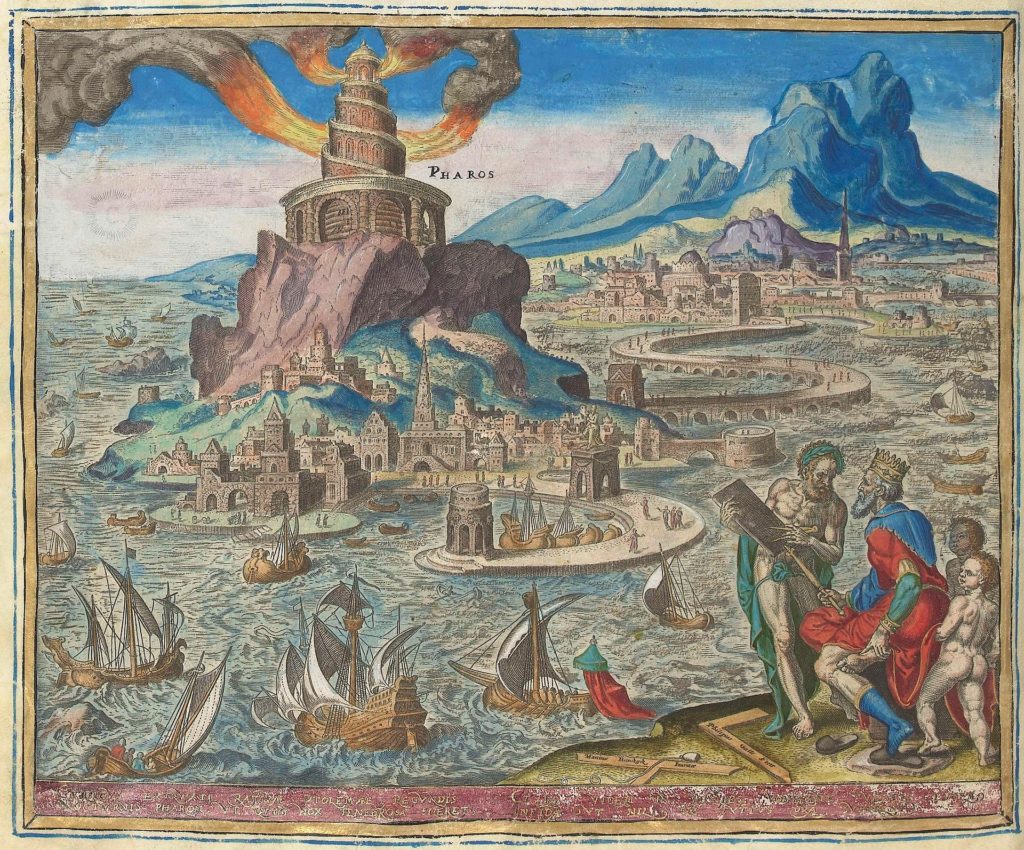
 
Lighthouse of Alexandria by Philip Galle; 1572

Some accounts suggest that the individual depicted was Alexander the Great.
In contrast, others contended that it was built to honor Ptolemy I Soter, who had patronized the construction of the Lighthouse.

Yet evidence from Roman coinage centuries later suggests that the statue here depicted either the King of the Gods in the Greek pantheon, Zeus, or the Greek God of the Sea, Poseidon.

There is also a possibility that four smaller statues of Triton, a lesser Greek maritime deity, were erected at the four corners of the roof of the Lighthouse. 

The Destruction of the Lighthouse

Unlike several of the other Seven Wonders of the Ancient World, the Lighthouse of Alexandria survived through antiquity and beyond.

It suffered some degradation in the ninth century when Ahmad ibn Tulun, the Arab ruler of Egypt from 868 AD to 884 AD, had the beacon house containing the furnace and giant mirror removed, presumably along with the statues above as well.

This was done for a mosque to be erected at the top of the Lighthouse.
However, as much damage as Tulun inflicted on it, the Lighthouse would ultimately meet its demise in the same way three of the other seven wonders did. It succumbed to earthquakes.

One in 956 AD damaged it badly, with the top twenty meters comprising most of the top layer collapsing into the harbor.

Then in 1303 AD, an enormous earthquake that emanated from the island of Crete and caused damage throughout the Eastern Mediterranean destroyed most of what was left of the Lighthouse.

Whatever fragments of it were left standing after that were gradually removed and used for other building projects by the Mameluke rulers of Egypt.

The Lighthouse was the fifth Wonder of the Ancient World to be destroyed and was soon followed by the Mausoleum of Halicarnassus in Turkey, leaving the Pyramids at Giza as the only Wonder of the Ancient World to have survived down to the present day.

The Ruins of the Lighthouse Today

A French underwater excavation team in the 1960s first recorded that they had identified large masonry blocks lying in the harbor of Alexandria.

However, it was not until 1994, when underwater excavation and marine archaeology methods had developed considerably, that the site was further studied in the waters around Pharos Island.

Marine archaeologists identified approximately 2,500 large stone blocks, which they believe were once part of the Lighthouse of Alexandria.
Additionally, they found pieces of what may be the statue that once stood at the structure’s peak.

Some of these blocks have since been lifted from the sea floor and placed in museums in Egypt. However, most remain confined to their watery grave, as these are extremely large and difficult to resurrect.

For many years there have been plans to construct an underwater museum near Pharos Island that will bring to life the remains of one of the Seven Wonders of the Ancient World.
However, progress in developing this has been slow. 

Tuesday, December 20, 2022

New tech frontiers for ocean gliders

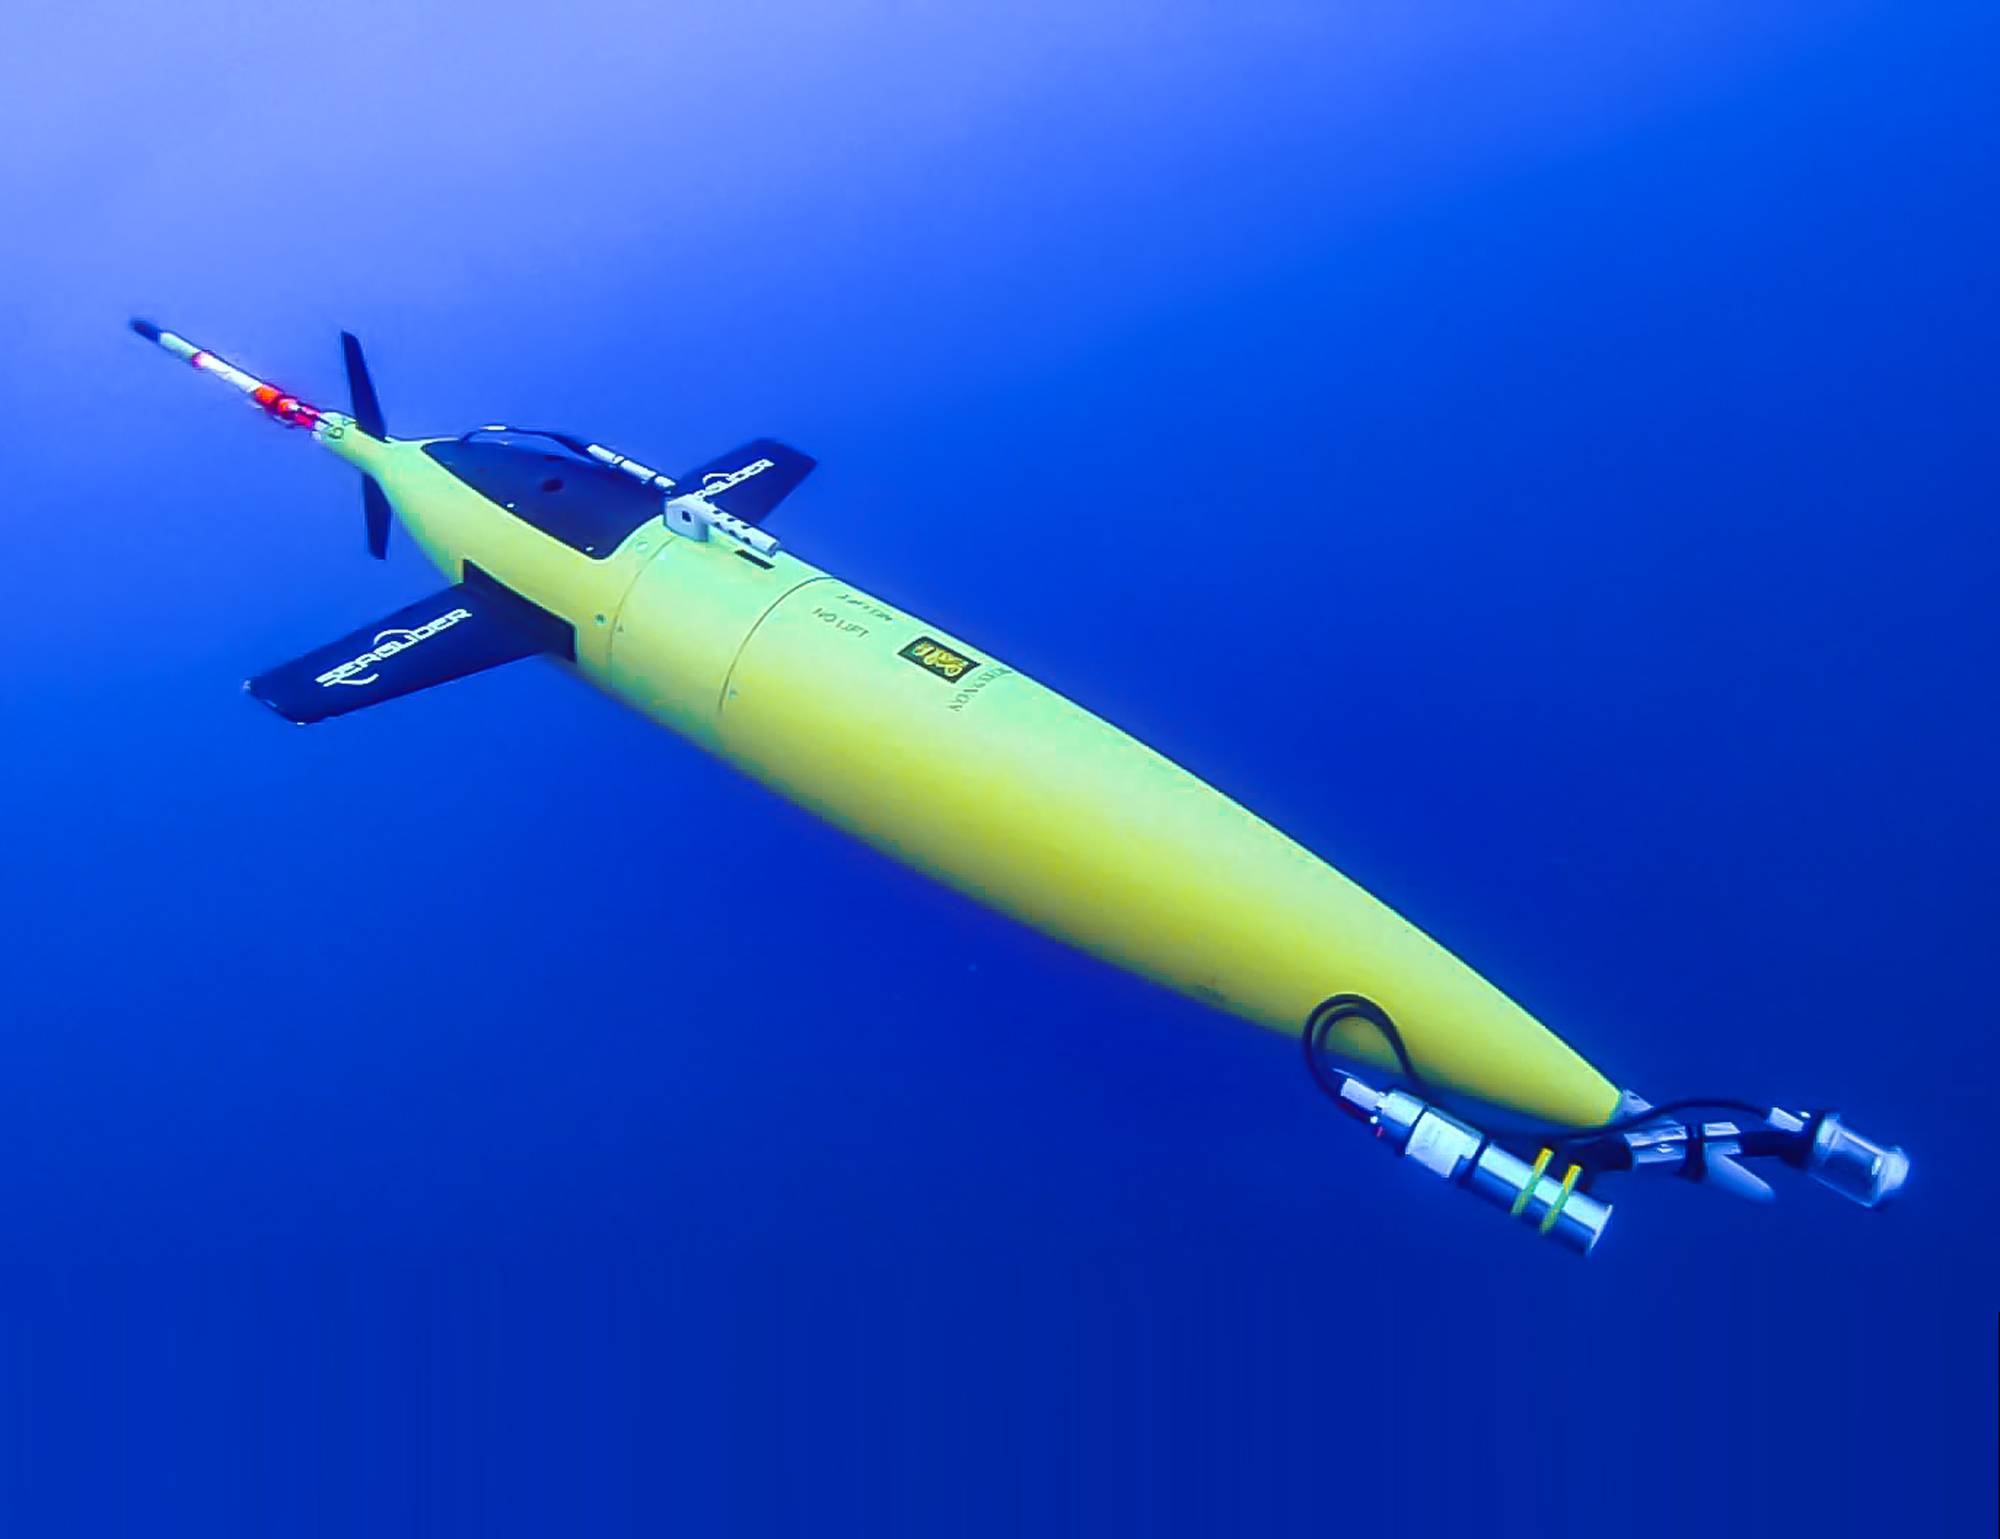
Image from Yves Ponçon, Bioglider project coordinator.

From Marine Technology News by Elaine Maslin

Expanding the amount of work that gliders can do was a key topic at this year’s Marine Autonomous Technology Showcase.

Building useful datasets that allow a better understanding ocean of ocean variables has long been a challenge.
It’s not that long ago that ocean temperature data was limited to surface temperature and the same goes for many other parameters.

But an increasing number of players, across science, defence and industry, are now able to access an increasing number of ways to gather data in the ocean, not least using gliders.

With around two decades of their use now banked, users are now looking at how much more these vehicles can do, from carrying biological sensing payloads or towing towed arrays, the Marine Autonomous Technology Showcase (MATS), held at the National Oceanography Centre in Southampton and online heard early November.

Blue Ocean

Blue Ocean Marine Tech Systems is one of those who have been using gliders for some time.
Initially this was in the energy sector, with parent company Blue Ocean Monitoring doing tasks such as marine mammal monitoring during seismic acquisition campaigns.
But Blue Ocean Marine Tech Systems is now also working in the defence realm, including developing a towed array system for gliders under the UK Royal Navy’s Project HECLA.

James King, Managing Director UK at Blue Ocean Marine Tech Systems, says buoyancy driven gliders lend themselves to monitoring applications, thanks to their low noise footprint.
Also, because they’re buoyancy driven, they use a small amount of power, so they can stay deployed for months at a time.

That lends them well to tasks such as submarine hunting, something that the Royal Navy has been trialling under Hecla, including deploying Slocum gliders in the North Atlantic for months at a time to gather various ocean data, including salinity, sound velocity and temperature – useful information (dubbed “tactical hydrography, meteorology and oceanography”) for operating submarines – and send it back to shore by surfacing.

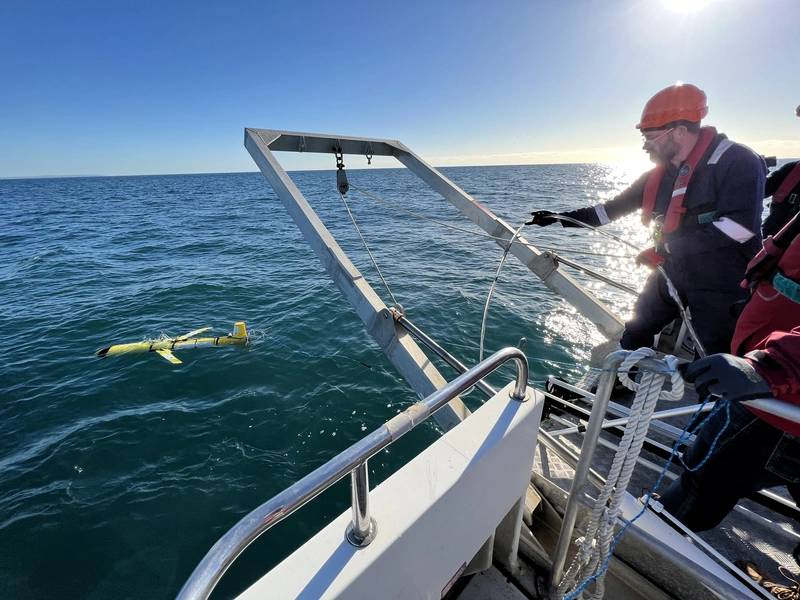
Blue Ocean Marine Tech Systems’ towed array deployment under the Royal Navy’s Project HECLA.
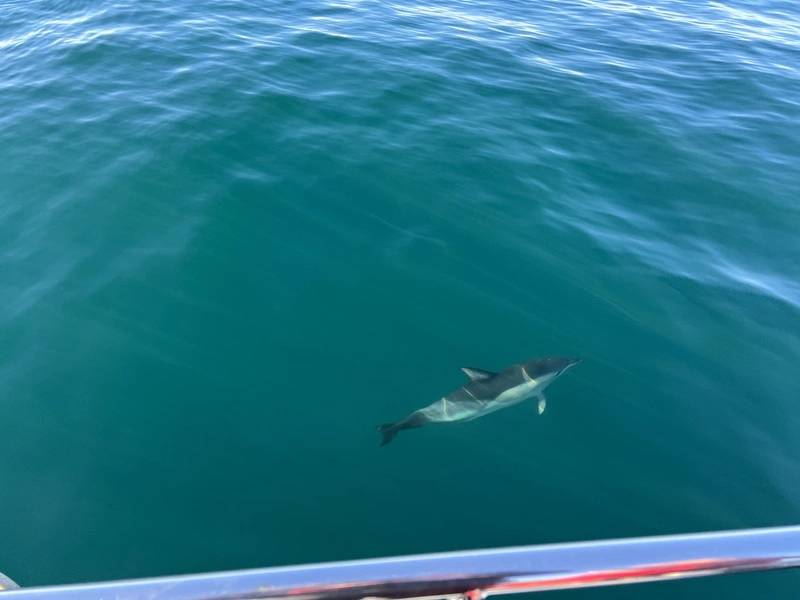
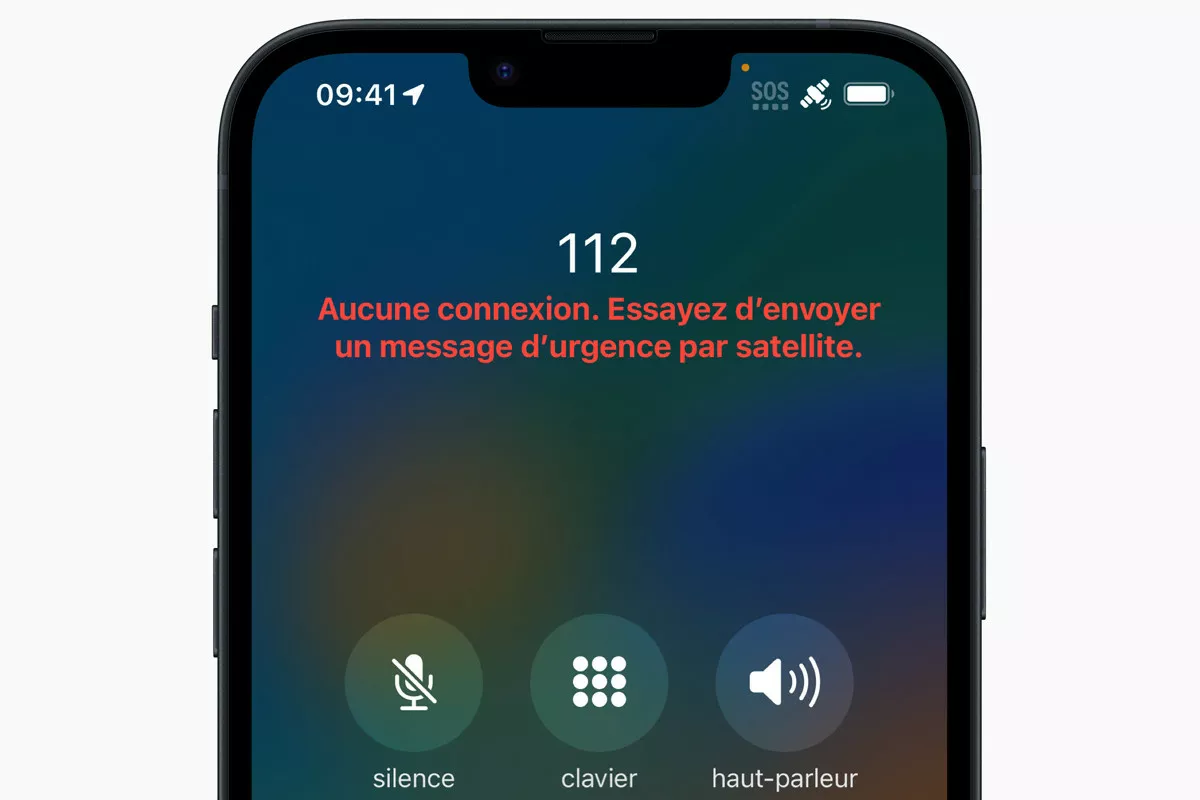
Image from Blue Ocean MTS.
 
However, what if they could also tow an array to detect human-made noise, i.e. vessels?
This was what the Hecla Project tasked Australia-based Blue Ocean Marine Tech Systems’ UK team with.
For the project, they chose to trial Seiche’s Digital Thin Line Array, a miniaturised (20mm), low power towed passive acoustic array, King told MATS.
It’s already been trialled with traditional autonomous underwater vehicles (AUVs) or uncrewed surface vessels (USVs), that hosts eight digital hydrophones (and can be configured to take up to 32).
As the glider is a slow platform, operating around 1kt, drag was a critical factor.“We set out to determine if a buoyancy driven vehicle can tow an array given that it is a finely ballasted vehicle,” says King.
“Can an array be used for marine acoustic data collection and how can the data be used?”

Blue Ocean MTS ran three trials out of Plymouth, where tidal variations and vessel activity offer a challenging test area for the system, initially using a dummy array, to prove the tow-ability.
Then, once they’d proven that, working out that with the addition of a thruster, they’d be able to improve control, they moved to a real system, containing four active hydrophones.
While there were issues with plastic in the ocean jamming the thruster and rudder, the trial proved the ability to gather acoustic data.
Mark Burnett, Director at Seiche, who also spoke at MATS, says the glider’s self-noise was such that the array could pick up other signals, including a vessel passing close to the array, proving it could pick up anthropogenic (man-made) noise.
Through processing they were able to correlate signals to marine mammal noise, specifically, minke whale, so that meant biological noise could be detected too.

On the third trial, more adjustments were made, including to the thruster guard and how the towed array – now 10m-long with eight hydrophones – was coupled to the glider to make controlling the glider better.
This time the glider stayed within a planned operational area.
They also used a known source, a D11 transducers to mimic machinery noise, and tracked AIS so they could correlate it with acoustic data from the hydrophones and the glider’s location data.

Burnett says one of the goals was real-time processing to get real-time information about what’s in the water.
This meant signal processing and software integration into the glider, but, with the longer array, also improving the power supply to reduce noise.

“We were able to correlate with AIS and could see a cargo vessel passing within 2.45nm of the array,” says Burnett. 
“We were also able to collect biological data.
We observed a pod of common dolphins from the vessel we were on so could time stamp the data and had good corroboration.
We could also see machinery start up noise (in the data).
In parallel, we developed signal processing, as part of a three-year knowledge transfer partnership with the University of Bath, using a low power, low footprint FPGA (field programmable gate array) to process data in real time.”

They then looked at the initial four hydrophones and processed the data to beam form and get three beams – forward, aft and broadside, to get automated detections – proving this capability.
The idea is that information is then sent to the vehicle command and control system so it can get a better bearing on the target and or surface to communicate that it’s made a detection.
More trials are expected to be carried out in the new year.

Bioglider

One project is looking to endow gliders with biological sensing capability.
Bioglider is a two- and half-year Horizon 2020 ERA-NET Cofund MarTERA project ending next September.

Yves Ponçon, Bioglider project coordinator, based at ENSTA Paris, part of the Institut Polytechnique de Paris research institute, says more biological sensors need to be deployed in order to measure ocean variables and that gliders, operating autonomously, could help.

“Autonomy is a game changer as they can stay at sea for months,” he says.
As well as gathering oceanic data as they “yo-yo” through the water column, they could also be used to acoustically gather and then transmit (once at the surface) data from remote underwater moorings that are otherwise hard to reach.
As well as for research work, this capability to track biological elements could also be used in fisheries or in oil and gas, he says (ConocoPhillips is among the financial supporters of the project).

To date, putting biological sensors on commercial gliders hasn’t been done, he says.
Scripps Institution of Oceanography had developed the Zooglider, which takes images and acoustic measurements of zooplankton (a key element of the aquatic food chain), but this was a research project and nothing has been developed in the commercial realm.

A project, called Bridges, which ran 2015-2019, had focused on miniaturising instruments for use on to gliders.
This included the UVP6 (Underwater Vision Profiler 6, an imaging sensor with strobe lights to take pictures of zooplankton).
A DeepEcho module - a blackbox that allows for easy integration of the WBT Mini, a miniaturised version of Kongsberg’s EK80 multibeam echosounder, into the gliders – was also developed.

The Bioglider project was set up to apply these on to three commercially available gliders: a Huntington Ingalls Industries (HII) SeaGlider, a Teledyne Slocum and an Alseamar SeaExplorer.
A key part of this is software; the echosounder was developed to work horizontally, but gliders go up and down all the time.
The Seaglider has been on two missions, one in May 2022, then again in October 2022, on the Polar Front campaign in the Lofoton Islands area.
The Slocum WBT Mini integration is in progress on the G2 and G3, with the first mission targeted in June 2023, also as part of the Polar Front mission, with discussions ongoing around work on the SeaExplorer.
The UVP6 has already been used on the SeaExplorer.

Initial data looks really promising, says Ponçon.
“We can have an echogram with very good acoustic measurements,” he says.
“We can see phytoplankton blooms and on the glider we can go to 1,000 m water depth and profile and couple that with the UVP6 to give more precision to the biomass we deliver.”
All while still having existing payloads, such as CTD and oxygen sensors, he says.
“For moderate cost we can have this all in one platform that can be autonomous and be at sea multiple months to 1,000 m water depth and bring some really great data,” says Poncon.

In addition, the platform could gather data from scientific moorings that are otherwise hard to reach.
Therefore, the project is also looking to integrate modems onto moorings and on the glider to acoustically communicate with moorings and retrieve their data.
First trials for this element are expected in Sprint 2023, with field tests in summer 2023.

 
A closeup of the Common Dolphin visually corroborated during the trials.
Image from Blue Ocean MTS.

Monday, December 19, 2022

iPhone 14 : SOS d'urgence par satellite est disponible en France


Gratuit pendant deux ans après activation de l'iPhone

From GNT by Jérôme G.


Ayant déjà fait beaucoup parler d'elle, la fonctionnalité de SOS d'urgence par satellite pour les iPhone 14 débarque en France.

C'était attendu.
Apple annonce aujourd'hui que tous les modèles d'iPhone 14 (iPhone 14, iPhone 14 Plus, iPhone 14 Pro et iPhone 14 Pro Max) ont la possibilité de bénéficier de son service SOS d'urgence par satellite en France (et pas uniquement métropolitaine).

Les autres pays concernés par cette activation sont l'Allemagne, l'Irlande et le Royaume-Uni.
Depuis le mois de novembre dernier, SOS d'urgence par satellite était proposé aux États-Unis et au Canada.

Le groupe de Cupertino indique que la prise en charge de SOS d'urgence par satellitesera étendue à d'autres pays dans le courant de l'année prochaine.

Pour aider à sauver des vies

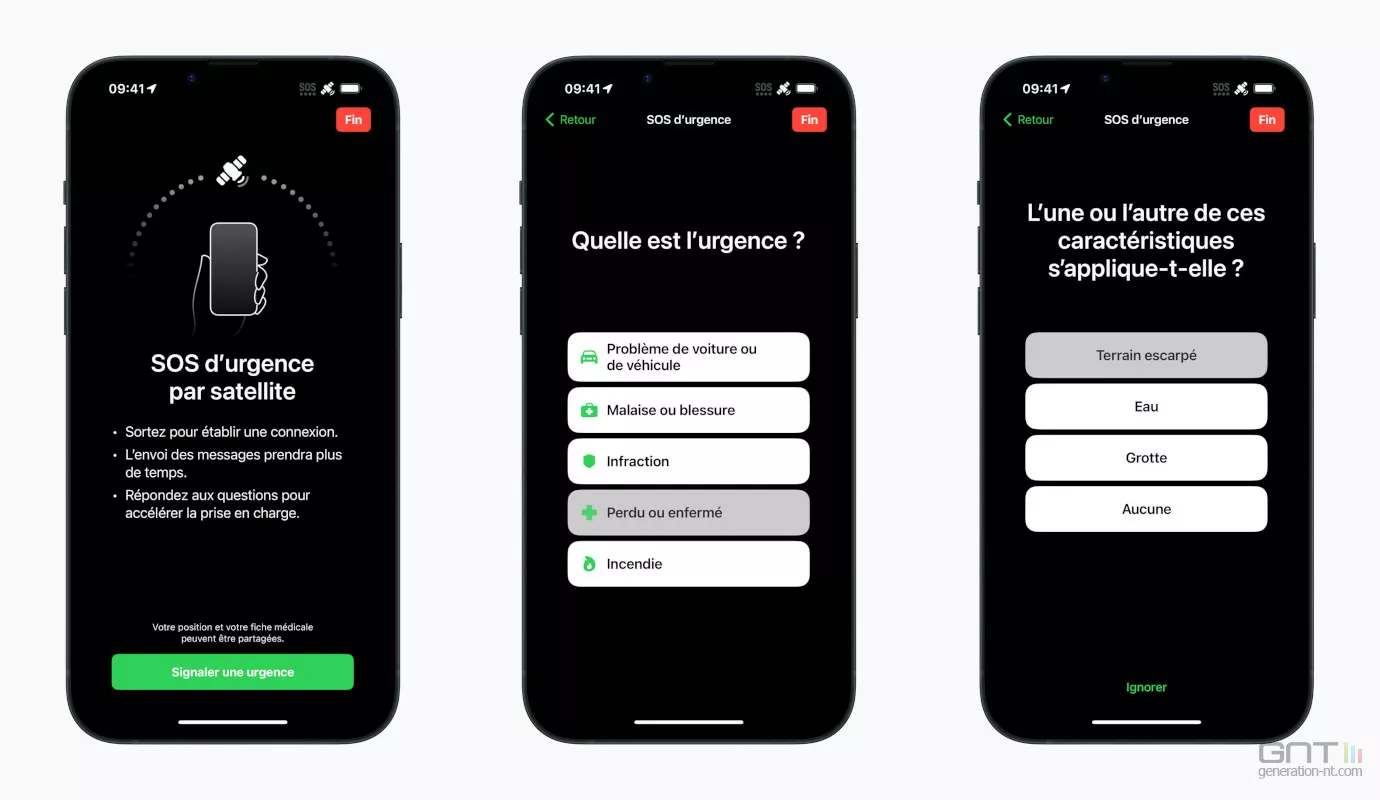
Le propos est pour rappel de permettre l'envoi d'un message aux services d'urgence quand il n'y a pas de couverture réseau cellulaire ou Wi-Fi.
L'iPhone affiche un questionnaire afin d'évaluer l'urgence et l'utilisateur est guidé pour la bonne orientation de son appareil dans l'optique d'une connexion à un satellite.

Le message initial comprend les réponses aux questions, la localisation et l'altitude, ainsi que le niveau de batterie de l'iPhone et la Fiche médicale si celle-ci a été configurée.
Il y a une transmission à des centres où des personnes formées par Apple préviennent les secours.


SOS d'urgence par satellite s'appuie sur un partenariat avec l'opérateur américain Globalstar spécialisé dans la téléphonie par satellite.
Il dispose d'une constellation d'une cinquantaine de satellites en orbite terrestre basse.
Ils opèrent à une altitude d'environ 1 400 km.
Apple va par ailleurs financer 95 % des coûts d'une nouvelle génération de satellites commandés par Globalstar.

Dans sa communication, Apple souligne la prouesse pour permettre ce genre de service avec l'iPhone 14, sans intégrer une imposante antenne afin de se connecter aux fréquences des satellites, ainsi qu'un algorithme de compression pour réduire la taille des messages.
Sachant que la bande passante est évidemment limitée.

Le service SOS d'urgence par satellite est gratuit pendant deux ans à partir de la date d'activation d'un nouvel iPhone 14.
Aucune précision pour le moment concernant la tarification ultérieure.
Le service nécessite iOS 16.1 au minimum.
 
Links :

Preparing for Meteosat third generation: think global, act local


From Eumetsat by Adam Gristwood

How users in Central and Eastern Europe are anticipating the arrival of Europe’s next generation of geostationary meteorological satellites

Meteorologists in Central and Eastern Europe say that data provided by EUMETSAT’s Meteosat Third Generation satellites will expand opportunities for nowcasting and storm prediction, and promote teamwork at all levels.

On 28 June 2014, an intense area of low pressure formed over the western Atlantic.
The system quickly evolved into Hurricane Arthur, the first named storm of the season.

Making landfall in North Carolina, US, and powering northwards along the coast to Canada, Arthur – a category 2 storm – blew down trees, damaged houses, cut power, and closed airports.

Predicting the exact nature and path of a hurricane is notoriously difficult.
Nevertheless, thanks to a multitude of Earth observations from space and ground, forecasters can provide a cone of uncertainty, representing the likely track of the centre of a storm.

What was impossible to forecast at the time, however, was the role that Hurricane Arthur would play in the formation of a once-in-a-generation hailstorm that struck thousands of kilometres away in Bulgaria’s capital, Sofia.

Sofia was hit by an unexpected hailstorm on 8 July 2014, with radar images clearly showing the heavy precipitation.
Credit: Hail Suppression Agency, Bulgaria.

Unseen impacts

“A large, fast-moving air mass associated with the aftermath of the hurricane crossed the Atlantic, contributing to the largest hail storm Sofia has seen since 1941,” recalls Dr Christo Georgiev, a professor in the Forecasts and Information Service Department of Bulgaria’s National Institute of Meteorology and Hydrology (NIMH).

“Using hindcasting techniques, researchers analysed the footprints left in satellite data and simulated the reverse trajectory of the air masses by numerical models.
They identified a strong relationship between conditions in the upper atmosphere and the development of the extreme weather in eastern Europe.”

On 8 July – days after Hurricane Arthur had dissipated in the Labrador Sea – an intense area of convective activity grew above eastern Serbia.
It then split into two major storms, one headed in the direction of Sofia.

Wind gusts of up to 125km an hour coincided with hailstones the size of baseballs.
More than 40 people were injured and damage exceeded 50 million euros.

“Data provided by EUMETSAT’s Meteosat Second Generation (MSG) satellites helped hindcast the role of a large plume of water vapour in the upper atmosphere, which mixed with moist air and large temperature gradients at lower altitudes, and seeded the conditions for the storm,” Georgiev says.

 
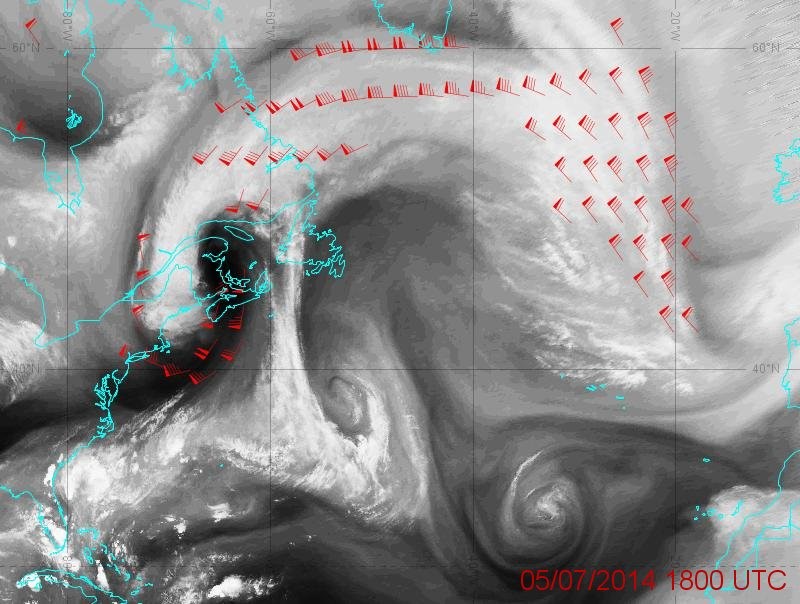
To better understand the impacts of Hurricane Arthur on the hailstorm in Sofia, experts combined images taken by NOAA’s Geostationary Operational Environmental Satellites (GOES) and EUMETSAT’s MSG spacecraft.

Large scale movement of water vapour in the atmosphere was tracked using the Action de Recherche Petite Echelle Grande Echelle (ARPEGE) global numerical weather prediction model.
Image courtesy of Karine Maynard, Meteo-France.


“Water vapour, or general humidity, forms an important link between land and ocean, and is a crucial mechanism for transporting energy around the planet.

“Such mesoscale processes can also play a key role in extreme weather at regional and local levels.
But humidity is also one of the hardest variables to observe effectively over large areas.”

EUMETSAT’s Meteosat Third Generation (MTG) satellites will play a vital role in turning such hindcasts into forecasts.

“To predict storms and their implications at a very local level, nowcasters must bring together and analyse as much data as possible, as frequently as possible,” Georgiev says.

“Meteosat satellites continuously have their eyes on the whole of Europe and beyond: they are in a superb position to meet this need.

“Meteosat First Generation satellites, beginning in the late 1970s, were the earliest geostationary meteorological spacecraft to feature instruments able to measure water vapour in the atmosphere from space.

“Since the early 2000s, Meteosat Second Generation has provided much more data, increasing the number of channels on the visible and infrared spectrum from three to 12.
This has enabled us to track water vapour and associated winds in the mid and upper atmosphere, with huge benefits for diagnosis and numerical weather prediction.

“Now, with the imminent launch of MTG satellites, we are looking forward to further increases in the amount, types, and frequency of data delivery.
This will help improve our ability to predict fast-evolving weather events, and hopefully turn more hindcasts into nowcasts.”

MTG’s first imager satellite will launch on 13 December 2022.

Multidimensional view


Georgiev says MTG will help meteorologists build up a four-dimensional picture of humidity – and other key variables such as temperature – in the atmosphere in near-real time.

“The Flexible Combined Imager aboard MTG’s Imager satellites will provide more detailed data on moisture and its circulation in the upper parts of the atmosphere,” he explains.
“It will also enable observation of water vapour at lower altitudes, something that’s not previously been possible using MSG measurements.

“New hyperspectral sounding instruments on board MTG’s sounder satellites will enable meteorologists to detect the distribution and temperature of water vapour.
They will do this by providing vertical profiles of the ever-changing state of the troposphere, from the ground up to the stratosphere.

“The new Lightning Imager, on the other hand, will provide continuous observations of lightning activity from space, providing comprehensive data on lightning flashes across Europe and Africa for the first time.

“Collectively, these observations will provide tremendous opportunities to enhance nowcasts, forecasts, numerical weather prediction models, land surface analyses, and much more.”

 
Like their predecessors, MTG satellites will have a constant eye on a substantial part of the Earth’s surface – image compiled using test data.
Credit: Image courtesy of Jan Kanak.


Capturing ‘overshooting tops’

Another way MTG will benefit storm prediction is by providing more opportunities for meteorologists to detect “overshooting tops” – dome-like protrusions atop cumulonimbus clouds driven by large updrafts, which can indicate a storm may be about to strike.

“Early detection of overshooting tops presents a window of opportunity to nowcast intense storms and for authorities to issue warnings,” says Dr Jan Kanak, a physicist at the Slovak Hydrometeorological Institute (SHMI), who has been working with Georgiev and other experts from across Europe to prepare for the arrival of MTG data.

“But detecting them is highly challenging, not least because the timescales on which overshooting tops occur is very short, often in the range of 10 minutes or much less.
Current satellite missions enable scans of the Earth’s disk every 15 minutes, so there are still many that we do not see.

“MTG will provide observations more regularly, with rapid-scan data available up to every two-and-a-half minutes.
It will present an opportunity to detect many more overshooting tops – not only in visible channels but also in the infrared, which is invaluable for observing the Earth at night-time.

“We will also be able to better observe other important variables, including minimum cloud top temperatures – a vital piece of information for predicting the strength of a storm – to better know the size of water droplets within clouds and to integrate this data into nowcasts and forecasts.”

Kanak, who has worked at SHMI since 1985, also develops real-time processing software with the goal of ensuring that data collected by EUMETCast reception stations and the EUMETSAT archive have the greatest possible impact at the regional level.

Products developed by his team decompress, calibrate, georeference, archive, and visualise satellite data so that users can efficiently make sense of it and integrate it for their needs.
They are used in at least 11 countries across Central and Eastern Europe.

“By operating these products for Meteosat Second Generation, we have learned a lot about how to effectively organise training, update software, and provide a stable service for users,” he says.

“MTG presents an opportunity to open up such software and products to an even larger community of users.

“Getting the most out of MTG data requires teamwork at many different scales – at the global level, the European level, and the regional level.

“To ensure users such as nowcasters, forecasters and researchers are ready, a huge number of MTG user preparation activities have taken place or are in the planning.

“EUMETSAT and national meteorological and hydrological institutes have joined forces on crucial aspects such as the development of training activities, updates to products and services, and studies of test data to prepare users for the arrival of new data types – such as lightning data.”

Regional connections

Both Kanak and Georgiev say that such joint activities between countries in Central and Eastern Europe are essential for preparations to efficiently use MTG data.

For example, Bulgaria’s NIMH is one of the operational users of MSG processing software developed by Kanak in the Slovak Republic, providing feedback to support the testing of new applications and the development of a new, MTG version.

The pair first met at the 1994 edition of the EUMETSAT Meteorological Satellite Conference.
They later took part in the 2010 Data Access to West Balkan and East Europe (DAWBEE) project, providing technical support and training to beneficent countries.

“We introduced users not only to Red Green Blue (RGB) imagery from MSG satellites, but also Meteosat Meteorological Product Extraction Facility products,” Kanak recalls.

“These products help forecasters to monitor upper atmosphere divergence, and the occurrence of precipitation, drought, and fires.

Software such as MSG Proc enables users to blend images from different MSG channels together to help make sense of storms.
Credit: Image courtesy of Jan Kanak.


“In last few years we have also co-developed processing and visualisation capabilities for the common display of RGB imagery and lightning data from MTG’s new instruments – the Flexible Combined Imager and Lightning Imager.”

These new data types present challenges but also tremendous opportunities, Kanak adds.

“For meteorological understanding, it is very important to have data over all of Europe, because severe storms relate to local conditions, orography, and distance from the sea and ocean,” he explains.

“But in their final application they must be localised to our conditions.
Therefore, close collaboration with meteorological services to develop products and models specific to the region are also essential.

“In combination with initiatives such as the European Weather Cloud, huge amounts of satellite data will ultimately be more easily accessible.

“Meteorological services across our region will be able to dedicate more time to furthering the meteorological aspects of products and ensuring that satellite data fulfil their maximum potential to benefit society and help save lives and property.”
 
Links :

Sunday, December 18, 2022

Mini 6.50 with foils


The mini 6.50 @nicomatic_official of @caroboule deploys its new foils for the first time off Lorient.
The Manuard design developed by Caroline and @benoit_marie_navigator has exceeded 20 knots of speed in a light NE breeze!
 
Links :