Wednesday, July 15, 2015

The strongest El Niño on record may be brewing in the Pacific

Sea surface temperature anomalies showing the telltale sign of an El Nino in the tropical Pacific.

From Mashable by Andrew Freedman

El Niño conditions are intensifying in the tropical Pacific Ocean, potentially leading to a record event that would help control rainfall in East Africa and possibly bring desperately needed drought relief to California, while temporarily cutting off rainfall to parts of the Indonesian rainforest.

A record strong event would also virtually guarantee that 2015 will beat 2014 as the warmest year this planet has seen since records began in the late 19th century.
In recent weeks, the water temperatures have grown warmer, propelled by a reversal of seasonal trade winds and the sloshing of mild ocean waters from west to east across the Pacific.

The atmosphere has shown telltale signs of positive feedback that are reinforcing the El Niño, including the formation of several tropical cyclones spinning in the central and northwestern Pacific Basins.
Taking these observations into account, a new forecast released Thursday by the Climate Prediction Center (CPC) in Maryland calls for a strong El Niño event to occur between now and the coming northern hemisphere winter, which is when El Niño conditions tend to peak, as well as when they have their greatest influence on global weather patterns.

 Sea surface temperature anomalies, showing the milder ocean waters near the equator with time.

According to a more detailed forecast from the CPC and the International Research Institute for Climate and Society (IRI) at Columbia University, there is a 96% chance of continued El Niño conditions from September through November, with a 94% chance of such conditions lasting through January.
The CPC outlook can be viewed as conservative when it comes to the predicted intensity of the El Niño event, considering that many individual El Niño experts, armchair meteorologists on Twitter, and individual computer model runs are predicting a potentially record strong event, exceeding the previous record-holder of 1997-98. El Niño data extends back to 1870.
The CPC takes such models into account when making its forecasts.
However, Michelle L'Heureux, a climate forecaster at CPC, told Mashable that the hype surrounding the potentially unprecedented intensity of the El Niño may be just that, hype.
"Even one or two westerly wind bursts does not necessarily always "make" an El Niño," she wrote in an email.
"Last year is a perfect example of that... a few westerly wind bursts in early 2014 and then they died out. It is the series of westerly wind bursts (or cumulative average over many months) that we forecasters pay attention to," she added.


Huge atmospheric response to pumped up El Niño

In a blog post, L'Heureux wrote that focusing on weekly average sea surface temperatures can be distracting, and is largely meaningless.
Right now, the weekly sea surface temperature departures from average are comparable to the record 1997-98 El Niño, she wrote.
"While a short-term (daily or weekly) number might be striking, it shouldn’t be used as an indicator of El Niño strength unless it is carefully placed into a larger context," she continued.
L'Heureux noted that none of the major forecasting centers responsible for monitoring El Niño are predicting a record event at this time, including CPC.


Conscious coupling between the air and ocean 

In order for El Niño events to occur and strengthen, an intricate dance must take place between the ocean and atmosphere, and some aspects of these interactions are not well understood.
So far this spring and summer, however, the atmosphere has been reinforcing the ocean conditions, and vice versa, with a temporary reversal of the east-to-west trade winds observed near the equator, because of a phenomenon known as a westerly wind burst.
Such wind bursts are crucial to creating and reinforcing strong El Niño events, since they drive pulses of mild sea surface temperatures eastward toward South America, according to recent research.
The strength of an ongoing wind burst, may be a sign of a particularly strong event to come.

"Right now we slightly favor a strong El Niño because we are seeing more bursts and we are further along in the year," L'Heureux wrote in her Climate.gov blog post.
"This causes us to be more confident in the staying power of this El Niño."

The bottom line: To get a significant El Niño event going (and keep it going), the atmosphere and ocean need to communicate like a healthy couple does — one in which one listens and responds to the other while bringing something new to the table.
There is a reason why meteorologists refer to the process of creating and maintaining an El Niño as reliant on "coupling" between the ocean and the atmosphere.
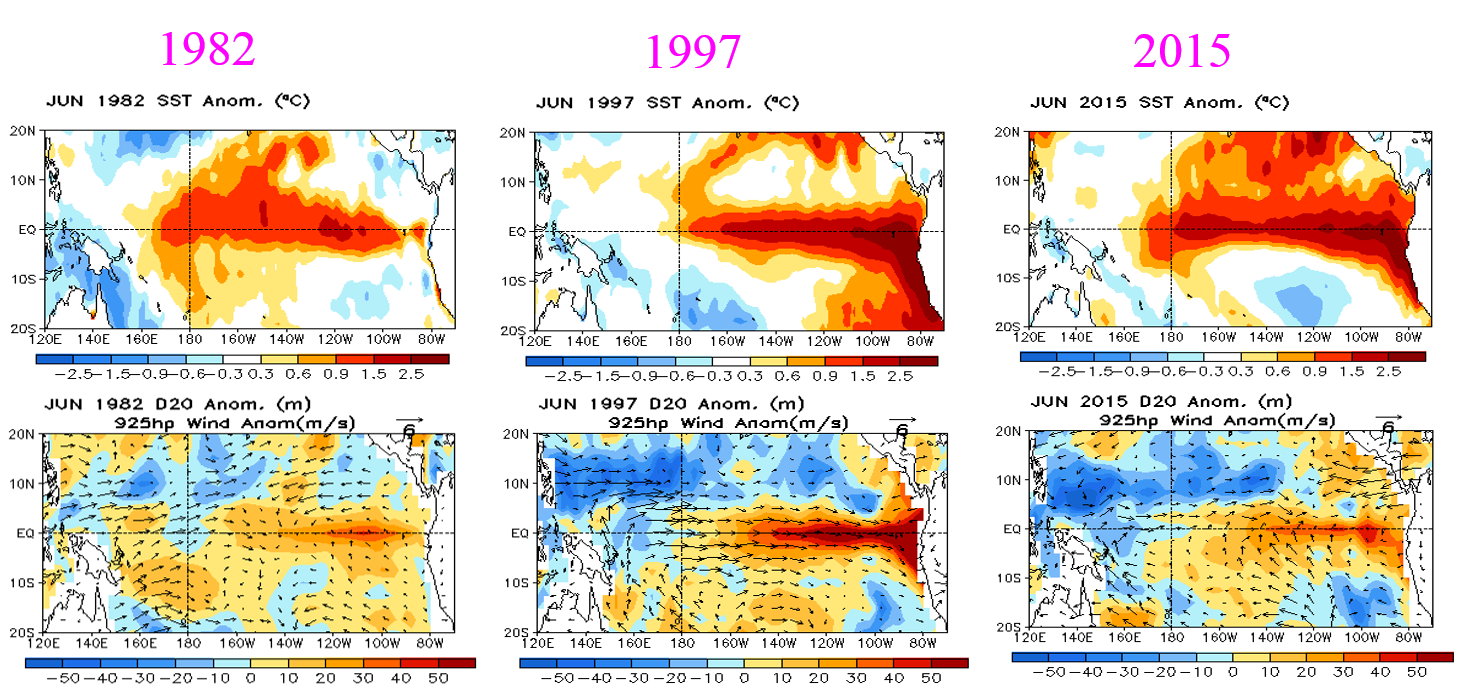
 Comparing the strong years of 1982,97 w/this year in Jun. 2015

Why you need to pay attention to El Niño

There are two main reasons why El Niño is a big deal — including its intensity.

First and foremost, the climate cycle is the most consequential natural climate phenomenon on the time scale of individual seasons to a couple of years, since it has ripple effects in areas far removed from the tropical Pacific.
El Niño events typically occur once every three to seven years, and predicting them in advance can protect lives as well as save businesses and governments money.

Second, El Niño events usually boost global average surface temperatures, elevating the probability that a particular year will set a record for the warmest year. So far, 2015 has been running hotter than 2014 did, and last year was the warmest year recorded since reliable instrumental records began in the late 19th century.
An intense El Niño would virtually assure that 2015 will break last year's record, since it acts as an added factor on top of long-term, manmade global warming.


 Typical El Nino winter weather pattern.

From Australia to California, El Niño brings alters weather extremes


Typically, El Niño events tend to shift rainfall away from northeastern Australia, with unusually dry conditions spreading south to encompass much of the Queensland coastline.
In the past, strong El Niño events, including one in 1982-83 and another in 1997-98, were accompanied by major droughts in parts of Australia, Indonesia and Papua New Guinea, although drought can also occur there in the absence of El Niño.

A major drought has been ongoing in Java, for example, even though conditions during the past year were only defined as resembling El Niño, without satisfying the formal scientific criteria.
Drier than average conditions are also likely to occur in Indonesia, according to IRI forecasts. Rainfall patterns that are crucial to agricultural production can also shift in eastern Africa as a result of El Niño and Indian Ocean temperatures.
In the U.S., El Niño usually exerts most of its influence during the fall and winter, with increased precipitation along the West Coast in particular.
This would be good news for drought-plagued California and other Western states, but a wetter than average winter is far from certain at this point.

 The tropical W Pacific has been very active recently, and this video shows the development of Typhoons Nangka, Chan-hom, and Linfa over the past few days through the Himawari-8 infrared, water vapor, and visible satellite imagery.
Linfa is the westernmost system, and is shown making landfall in China. Chan-hom is the next system to the east, and is currently approaching the coast of China.
Nangka is the easternmost system to the W of Guam.

One likely connection to El Niño that is already manifesting itself is a below average Atlantic hurricane season, since El Niño events tend to increase upper level winds across the tropical North Atlantic, tearing nascent storms apart before they can intensify.
At the same time, El Niño conditions can favor more tropical cyclones in the eastern and central Pacific Ocean.
Currently, there are three tropical cyclones spinning their way toward China and Japan, one storm moving toward Hawaii, and two new storms predicted to develop in coming days off the west coast of Mexico.
L'Heureux says that El Niño alters the air circulation over the globe, and increases the likelihood of certain weather conditions.
"This can be a huge advantage to those who want to hedge bets or plan for certain outcomes. The fact that our probabilities are [greater than] 90% means that folks can start making those bets and preparing for potential impacts."

Tuesday, July 14, 2015

50 million year old volcano cluster near Sydney

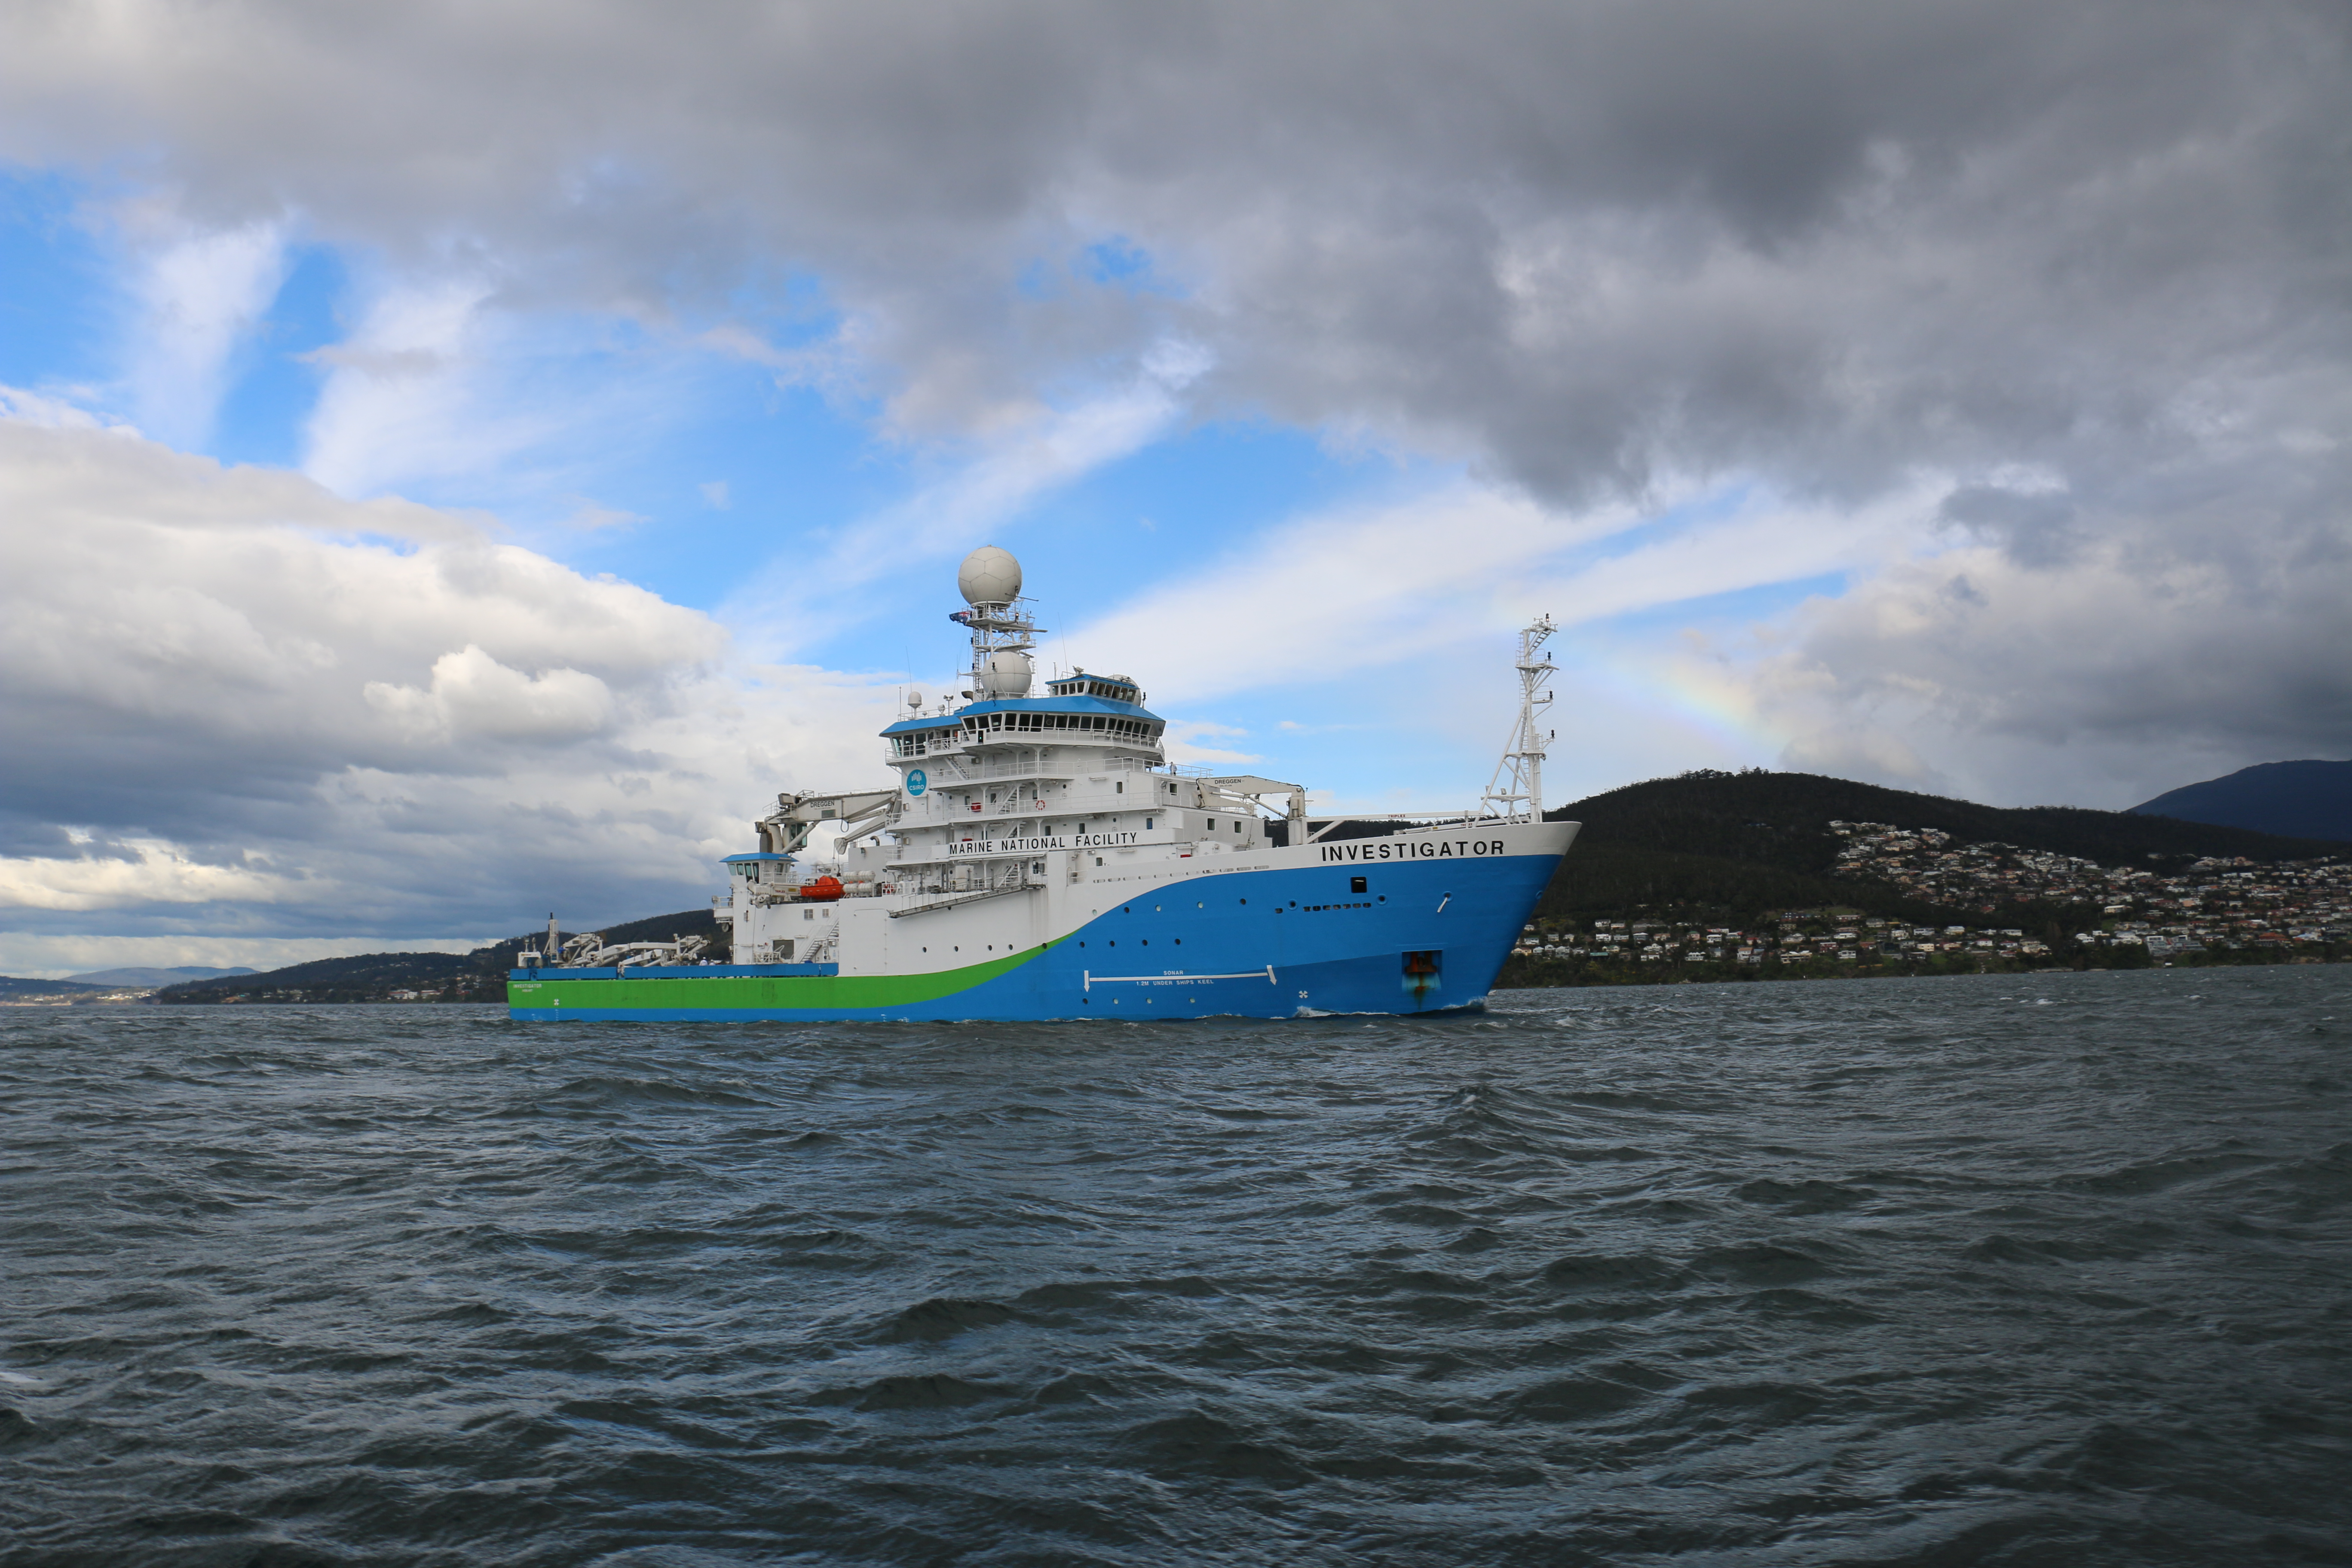
Australia’s new ocean-going research vessel Investigator has discovered extinct volcanoes likely to be 50 million years old, about 250 km off the coast of Sydney in 4,900 m of water.
While scientists were searching for the nursery grounds for larval lobsters, the ship was also routinely mapping the seafloor when the volcanoes were discovered.
They haven’t been found before now, because the sonar on the previous Marine National Facility (MNF) research vessel, Southern Surveyor, could only map the sea floor to 3,000 m, which left half of Australia’s ocean territory out of reach.

From The Guardian

Scientists searching for lobster larvae on Investigator research vessel instead find cluster of four volcanoes thought to be about 50m years old

Four enormous underwater volcanoes, thought to be about 50m years old, have been discovered off the coast of Sydney by a team of scientists who were looking for lobster larvae.

The volcano cluster was spotted through sonar mapping of the sea floor by Investigator, Australia’s new ocean-going research vessel, about 250km off the coast.

 Position with the GeoGarage platform
The centre of the volcanic cluster is 33 31 S, 153 52 E, which is 248 km from Sydney Heads.
The cluster is 20 km long and six km wide and the seafloor 4890 metres deep, with the highest point in the cluster rising up to 3998 metres.

The four volcanoes are calderas, large bowl-shaped craters caused when a volcano erupts and the land around it collapses.
The largest is 1.5km across the rim and rises 700m from the sea floor.
The 20km-long volcano cluster is nearly 5km underwater.

Professor Iain Suthers, a marine biologist at the University of NSW, said the volcano discovery was made when the team was searching for nursery grounds for larval lobsters.
“My jaw just dropped,” Suthers told Guardian Australia.
“I immediately said, ‘What are they doing there and why didn’t we know about them before?’ It really backs up the statement that we know more about the surface of the moon than our sea floor.
“I’m elated. We went there to look at eddies in the east Australia current and it was completely serendipitous to find this volcano cluster. We can only just imagine what will be around the corner if we continue to scan this area.”

Scientists believe the volcanoes were created by a series of shifts in geological plates that caused Australia to split from New Zealand. Suthers said the area was thought to be “billiard-table flat” but the enhanced mapping capability of the Investigator unveiled the calderas.

The 94-metre Investigator was commissioned by the CSIRO in 2009 via $120m from the federal government.
The vessel, which undertook its first sea tests in March, can map the seafloor at any depth, whereas its ageing predecessor, the Southern Surveyor, was limited to 3,000 metres.

 Mapping the sea floor on RV Investigator
Australia has the third largest ocean territory in the world, but we've only mapped 12 per cent of it. The RV Investigator is using state of the art equipment and design to map the sea floor, to any depth.  

Professor Richard Arculus, an igneous petrologist and volcano expert at the Australian National University, said the Investigator’s mapping ability has unveiled an “enormously exciting” discovery.
“They tell us part of the story of how New Zealand and Australia separated around 40m to 80m years ago, and they’ll now help scientists target future exploration of the sea floor to unlock the secrets of the Earth’s crust,” he said.

The team of 28 scientists, led by Suthers, included researchers from NSW, Latrobe, British Columbia, Sydney, Auckland, Technology Sydney and Southern Cross universities.
The voyage left Brisbane on 3 June and arrived in Sydney on 18 June.

Suthers said it was “inevitable” that other undiscovered volcanoes were in the region, but the Investigator has funding to operate at sea for only 180 days a year.
For the rest of the year it is tied up at a wharf in Hobart.
“We should thank Canberra for the funding we do have but it’s frustrating to build a state-of-the-art vessel only to have it sitting in a wharf for six months of the year,” Suthers said.
“This is a vessel that Australia has been crying out for for decades. It’s an incredibly stable vessel for those of us who are seasick. Usually when you’re hit by four-metre waves you lose a couple of days of research because you’re vomiting.”

A spokeswoman for Ian Macfarlane, the industry and science minister, said the shortfall was because Labor “left absolutely no money in the budget” to operate the Investigator.

Monday, July 13, 2015

GeoGarage Time Zone API : for maritime areas


Time Zone World map (source CIA 2013) / 2014 / 2015

Heat is being stored beneath the ocean surface

see picture

From NASA

For much of the past decade, a puzzle has been confounding the climate science community.
Nearly all of the measurable indicators of global climate change—such as sea level, ice cover on land and sea, atmospheric carbon dioxide concentrations—show a world changing on short, medium, and long time scales.
But for the better part of a decade, global surface temperatures appeared to level off.
The overall, long-term trend was upward, but the climb was less steep from 2003–2012.
Some scientists, the media, and climate contrarians began referring to it as “the hiatus.”

If greenhouse gases are still increasing and all other indicators show warming-related change, why wouldn’t surface temperatures keep climbing steadily, year after year?
One of the leading explanations offered by scientists was that extra heat was being stored in the ocean.

Now a new analysis by three ocean scientists at NASA’s Jet Propulsion Laboratory not only confirms that the extra heat has been going into the ocean, but it shows where.
According to research by Veronica Nieves, Josh Willis, and Bill Patzert, the waters of the Western Pacific and the Indian Ocean warmed significantly from 2003 to 2012.
But the warming did not occur at the surface; it showed up below 10 meters (32 feet) in depth, and mostly between 100 to 300 meters (300 to 1,000 feet) below the sea surface.
They published their results on July 9, 2015, in the journal Science.

 Schematic of the trends in temperature and ocean–atmosphere circulation in the Pacific over the past two decades.
Colour shading shows observed temperature trends (°C per decade) during 1992–2011 at the sea surface (Northern Hemisphere only), zonally averaged in the latitude-depth sense and along the equatorial Pacific… 
source : Nature

“Overall, the ocean is still absorbing extra heat,” said Willis, an oceanographer at JPL.
“But the top couple of layers of the ocean exchange heat easily and can keep it away from the surface for ten years or so because of natural cycles.
In the long run, the planet is still warming.”
To understand the slowdown in global surface warming, Nieves and colleagues dove into two decades of ocean temperature records; specifically, they examined data sets compiled from underwater floats and other instruments by the Argo team at the Scripps Institution of Oceanography, by the World Ocean Atlas (WOA), and by Japanese scientist Masao Ishii and colleagues.
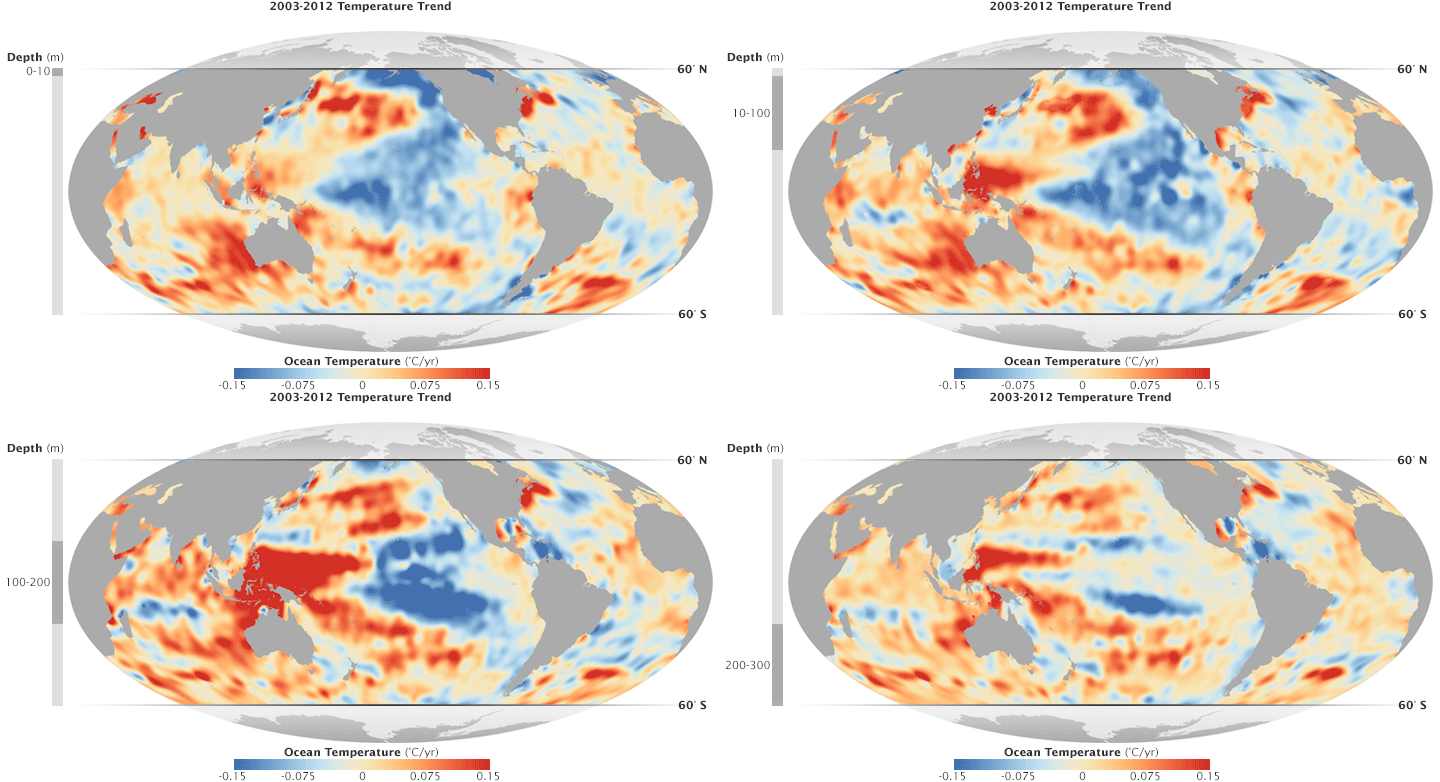
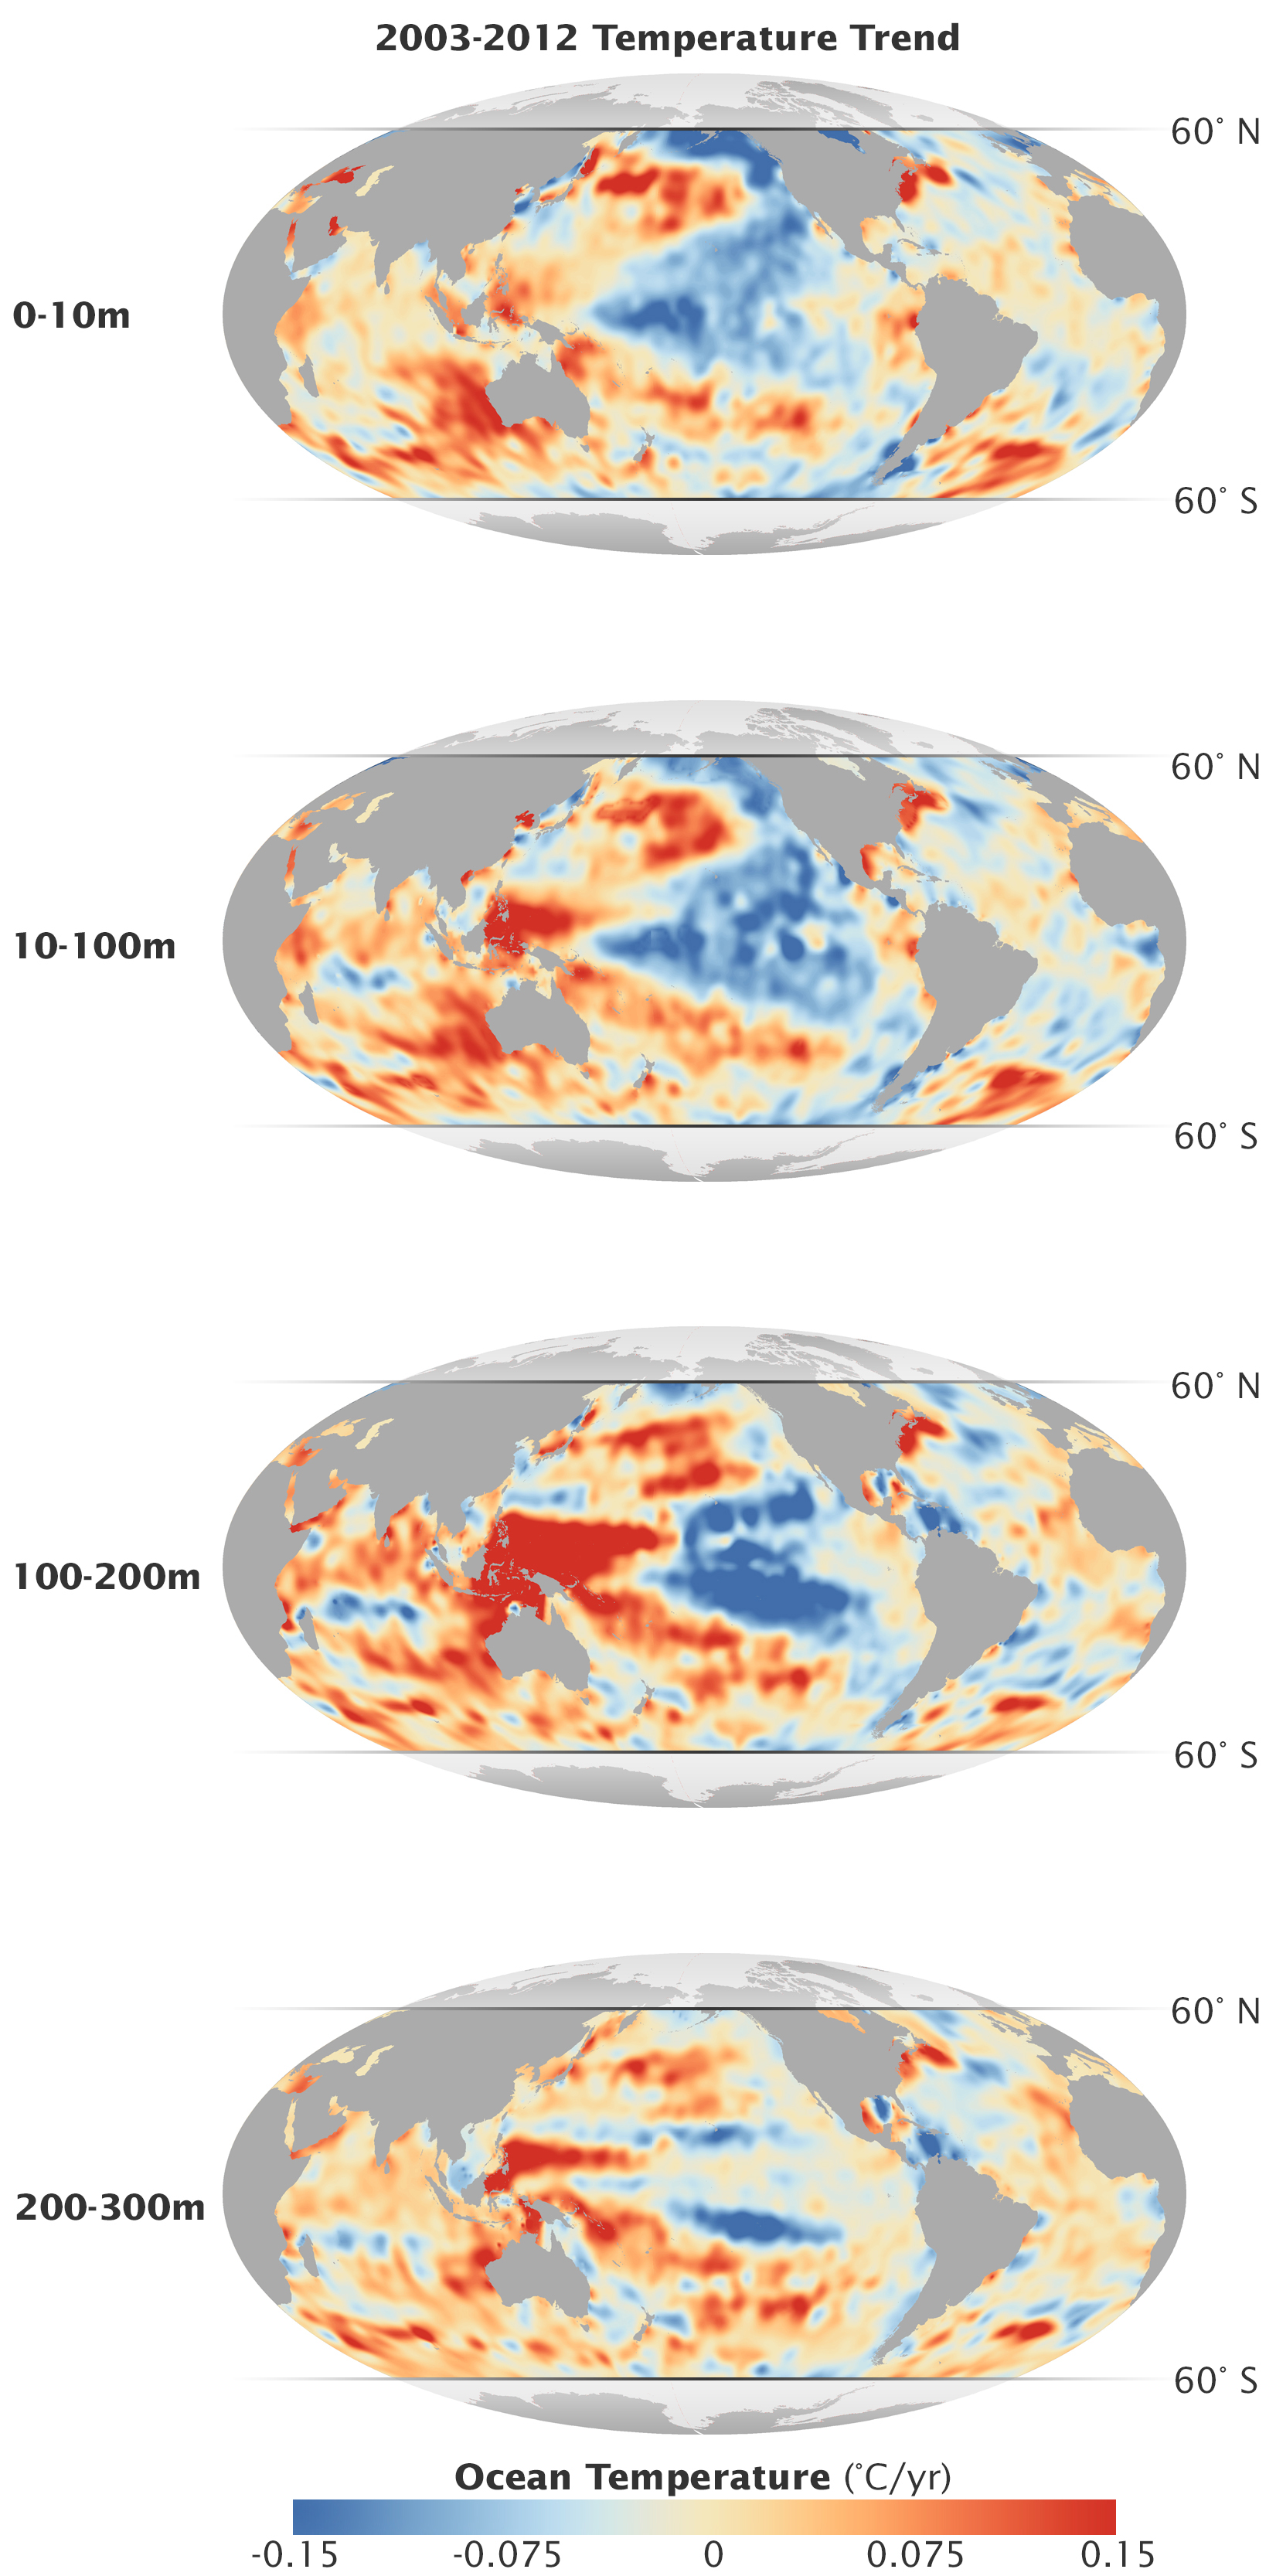
The JPL team found that for most of the decade from 2003–2012, waters near the surface (0–10 meters) of the Pacific Ocean cooled across much of the basin.
However, the water in lower layers—10–100 meters, 100–200 meters, and 200–300 meters—warmed.

The animated map at the top of this page shows the trends in water temperatures in various depth layers of the ocean as measured between 2003 and 2012.
Areas in red depict warming trends in degrees Celsius per year, while blues depict cooling trends.
Warming is most acute between 100–200 meters in the western Pacific and the eastern Indian Ocean. Some areas of the Pacific appear to cool—particularly near the surface and in the eastern half, which correlates well with the cool phase of the Pacific Decadal Oscillation (PDO), which has been underway for much of the past 15 to 20 years.

Note that the Atlantic Ocean does not show significant trends at any depth, with warming temperatures in one place counter-balanced by cooling in others.
The Atlantic basin is also relatively small compared to the Pacific and does not have as much impact on global temperatures.
The JPL team also noted that the temperature signal was neutral or inconclusive at depths below 300 meters, where measurements are relatively sparse.

The figure below depicts the trends in a different way.
It represents a cross-section of the top 300 meters of the global ocean and how temperatures changed from 1993 to 2012.
Note how there are cooler waters near the surface in several years in the 2000s, but that waters at depth grow much warmer.
Note, too, how the overall trend in 20 years goes from a cooling ocean to a significantly warmer ocean.


Nieves, Willis, and Patzert were provoked to launch the study because they wanted a more detailed, nuanced picture of ocean temperatures than is possible with most models.
On a broad scale, models can replicate broad and long-term trends in the sea; but on smaller scales of space and time, a lot of the models cannot match real-world conditions.
The new findings should help improve models of ocean heat storage and climate impacts on regional scales.

The Pacific Ocean covers nearly one-third of Earth’s surface, so it has an outsized impact on the global thermostat.
“As the top 100 meters of the Pacific goes, so goes the surface temperatures of the planet,” said Patzert, a climatologist at JPL.
With the surface layer of the ocean being cooler for much of the study period, those waters had a moderating effect on air masses and weather systems on the continents.
However, ocean and air temperatures have started to rise swiftly in the past two to three years, which suggests that the cool phase of the PDO and the warming hiatus is over.

“Natural, decadal variability has been with us for centuries, and it continues to have big regional impacts on society,” said Nieves, a JPL scientist with a joint appointment at the University of California, Los Angeles.
“We can expect to have more hiatuses in the future, but unless future hiatuses are stronger than usual, they will be less visible due to fast rising greenhouse gases. Right now, the combined effect of the human-caused warming and the Pacific changing to a warm phase can play together and produce warming acceleration.”

Sunday, July 12, 2015

Trailer : The finest hours


Disney has released the trailer for a new movie based on the true story of heroic US Coast Guard rescue of 32 mariners aboard the SS Pendleton.

In the winter of 1952, a four-man crew from the USCG braved 60-foot waves and 70-knot winds to save men trapped in stern section of the oil tanker after one of the worst Nor’Easter gales on record tore the vessel in two.
Using only a 36-foot wooden motorized boat the men carried out one of the most daring rescue missions in Coast Guard history.

"Coast Guard photo of bow section of tanker PENDLETON grounded near Pollock Rib Liteship, six miles off Chatham, Mass on the morning of Feb. 19, 1952."
Official USCG Photo;  by Richard C. Kelsey, Chatham, Mass.

The incident occurred on February 18 while the tanker was underway off of Cape Cod.
In the early morning hours fierce snow fall and hues waves snapped the vessel in two.
The captain and seven crewmen sank in the bow section of the ship.
Reports after the accident said the tanker had been constructed with “dirty steel”, which was not able to withstand gales force winds.

The Finest Hours recounts this amazing story from the perspectives of the US Coast Guard men that carrying out the operation as well as the desperate mariners stranded aboard the mangled tanker.