A 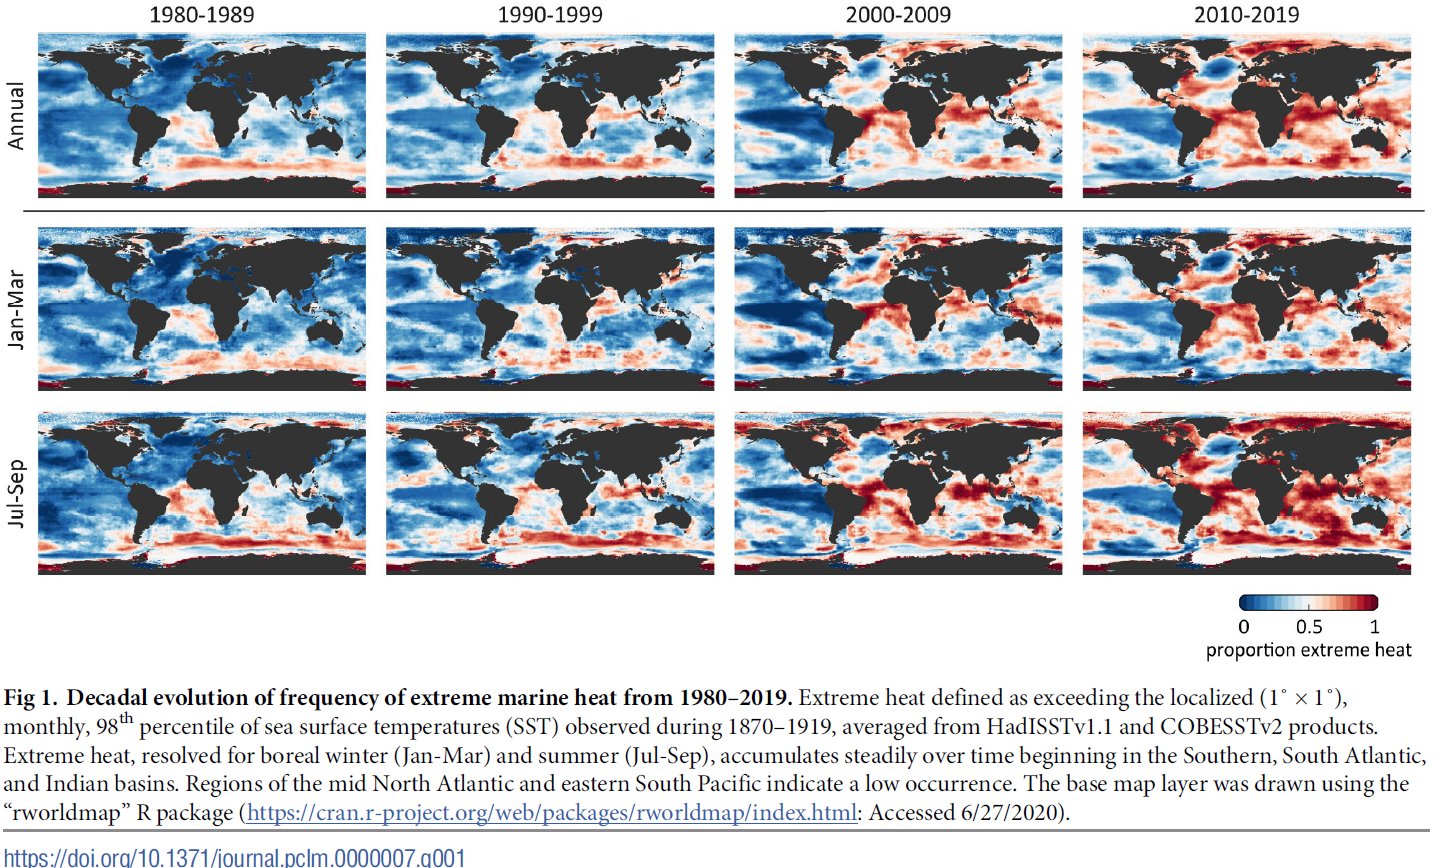
new analysis of monthly sea surface temperatures across the global ocean reveals how more and more patches of ocean saw heat extremes every year.
new analysis of monthly sea surface temperatures across the global ocean reveals how more and more patches of ocean saw heat extremes every year.
These four decadal snapshots show temperature shifts since 1980.
Beginning in 2014, more than half of the ocean began to reach extremes hotter than even the most extreme events from 1870 to 1919.
From Wired by Matt Simon
More than half of the sea now logs temperatures once considered extreme, threatening countless species, livelihoods, and the air we breathe.
WITHOUT THE OCEAN, climate change on land would be even more catastrophic.
The seas have absorbed over 90 percent of the excess heat from greenhouse gas emissions, essentially saving humanity from itself.
But it’s taking a toll: The ocean, too, is rapidly warming.
And just as we have heat waves on land, parts of the ocean can experience temperature spikes too.
The seas have absorbed over 90 percent of the excess heat from greenhouse gas emissions, essentially saving humanity from itself.
But it’s taking a toll: The ocean, too, is rapidly warming.
And just as we have heat waves on land, parts of the ocean can experience temperature spikes too.
New research exposes just how bad the problem has gotten.
Researchers from the Monterey Bay Aquarium began their calculation by analyzing surface temperature data from 1870 to 1919, sampled from across the globe.
(Yes, ships have been taking the ocean’s temperature for 150 years.) Once they knew the historical high temperatures for each month in different parts of the ocean, they had a baseline for marine temperature extremes before the escalation of climate change.
In the 19th century, only 2 percent of the ocean surface experienced such extremes.
Then they compared this data to readings in the same places taken from 1920 to 2019.
Their results show that by the year 2014, half of the ocean surface was logging temperatures once considered extreme—exceeding those historical highs.
By 2019, that figure was 57 percent.
In 150 years, the occurrence of extreme heat had become the new normal.
Take a look at the map above.
The redder the area, the more months that it logged temperatures higher than that historical baseline measured between 1870 and 1919.
Or, put another way, what used to be extreme is now normal in those red areas.
Notice how in the 1980s the extreme heat was mostly around Antarctica, but by the 2010s it had spread all over the world, particularly around the equator.
“Now, that's really concerning,” says Van Houtan, “because obviously that's the distribution of corals.
Coral reefs in the past decade have had dramatic and widespread bleaching events.” This happens when warming waters stress the corals, causing them to release the photosynthetic algae that help them produce energy.
Without energy, the corals die, contributing to the collapse of the reef ecosystem.
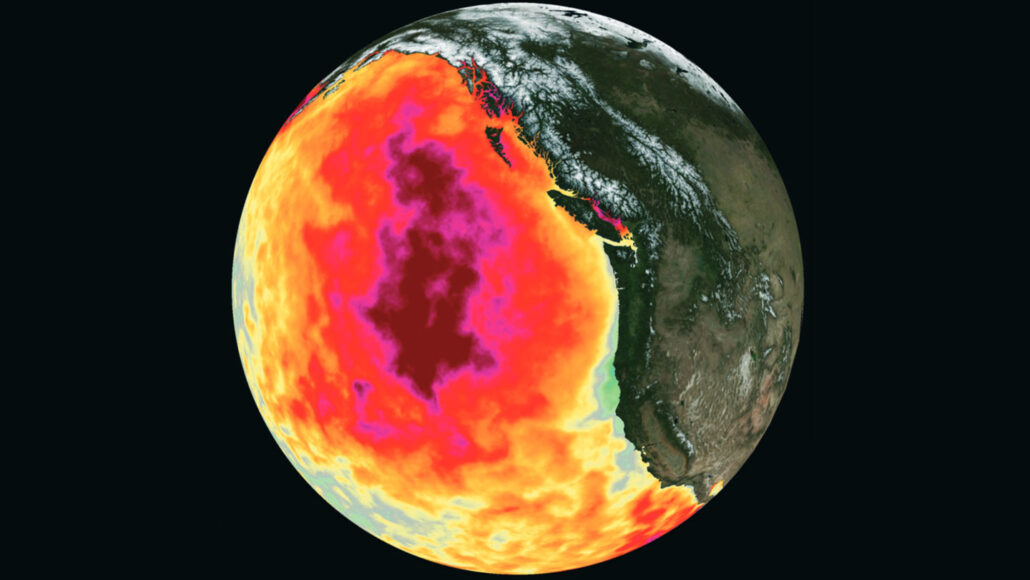
From 2013 to 2016, a mass of sweltering water in the eastern Pacific Ocean, known as the Blob, wreaked havoc on marine ecosystems.
This illustration shows how unusually hot the waters were in May 2015, with deepest red representing 3 degrees Celsius above average.
CHELLE GENTEMANN, CHARLES THOMPSON AND JEFFREY R. HALL/PO.DAAC/JPL
CHELLE GENTEMANN, CHARLES THOMPSON AND JEFFREY R. HALL/PO.DAAC/JPL
These spikes are different from the overall rise in water temperature, which is also caused by global warming.
For one thing, a particular region can come back down off of a high when winter arrives.
And the location of the spikes can vary over time, meaning some places were affected earlier than others.
So while half the ocean surface was logging temperature extremes by 2014, the South Atlantic had actually crossed that threshold back in 1998.
“And that is ludicrous,” says ecologist Kyle Van Houtan, president and CEO of the Loggerhead Marinelife Center, who coauthored today’s paper in the journal PLOS Climate describing the findings.
(Van Houtan did the research in his previous role as the chief scientist at the aquarium, with marine biologist Kisei Tanaka, now at the National Oceanic and Atmospheric Administration.)
“There's some major changes going on right now in the ocean, and we think that this calculation, this index, of marine heat that we built is helping to describe why,” he continues.
“I think extreme marine heat is much more of a problem than we thought it was.
It's actually common today, which is scary, because historically it was just extreme—it was rare.”
“I think extreme marine heat is much more of a problem than we thought it was.
It's actually common today, which is scary, because historically it was just extreme—it was rare.”
“The trends they're seeing are consistent with results from a lot of other papers that conclude that marine heat waves are becoming more frequent, they're warmer, and they're lasting longer,” says Bridget Seegers, an oceanographer at NASA, who wasn’t involved in the work.
(She was, though, among the researchers who recently reported that 2021 was the sixth hottest year ever recorded.)
(She was, though, among the researchers who recently reported that 2021 was the sixth hottest year ever recorded.)

The graphic above shows another way of looking at it by country.
The areas that tallied the most months of extreme marine heat are the Maldives in the Indian Ocean, Tanzania on the east coast of Africa, and Micronesia in the Pacific—all of them are along the equator.
The areas that tallied the most months of extreme marine heat are the Maldives in the Indian Ocean, Tanzania on the east coast of Africa, and Micronesia in the Pacific—all of them are along the equator.
You might have noticed a glaring exception to the overall heating trend in the first map.
The Pacific Ocean off South America—that big blue blob on the map—resists extreme heat because of the upwelling of cold, deep waters.
But, Van Houtan cautions, this shouldn’t be read as an indicator that this area is unaffected by climate change.
“This is not a map of warming. Everywhere is warming,” he says.
“This is a map of the occurrence of extreme heat.
And so those large blue areas may be warming—and in fact, are warming—but they are areas that historically have had a lot of variability in those systems.”
“Different places actually kind of take turns increasing rapidly,” agrees Daniel Rudnick, a physical oceanographer at the Scripps Institution of Oceanography, who wasn’t involved in the new research.
For example, Rudnick studies the North Pacific, where he saw a major increase in heat in 2014.
“I think that's going to be the story in general, that different regions will kind of take their turns.
There is a general trend for the whole Earth to warm, but how it will be happening in any region will be different.”


Current temperature anomaly for the World is 0.0C (1979-2000 base)
Extra heat must be going into the Ocean (which store 90% of the world's excess heat) and we're going to get our payback for this 2022 La Nina driven oasis of cool soon enough.
Ocean depth plays a big role in how regions are affected.
While the depth of the middle of the Pacific Ocean allows cooler waters to upwell, the shallower areas around tropical islands get no such relief.
Island nations are at additional risk because water gets bigger as it gets hotter, a phenomenon known as thermal expansion.
“The same mass of water takes up more volume, and so there you go—sea level rise,” says Rudnick.
In fact, roughly half of human-caused sea level rise is from runoff from melting glaciers, and the other half is from warmer waters just taking up more space.
But more locally, almost all of the regional variability in sea level rise is due to thermal expansion, Rudnick adds.
The hotter the coastal water, the more the sea rises.
This can happen quickly with extreme heat events, whereas sea level rise from ice melt happens at a, well, more glacial pace.
The ecological consequences of rising heat—both in terms of overall warming and spikes from extreme heat—are both obvious and subtle.
Species with the ability to flee, like fish, are moving toward the poles.
“Like lobster, for example.
We're seeing some dramatic changes in the geographic distribution of that fishery off the northeast US,” says Van Houtan.
“There used to be a fishery in New York and New Jersey, and that is essentially nonexistent.
And now Maine is thriving, but in 10 years Maine may be on the back side, and it may just be a Canadian fishery moving forward.” Similarly, subsistence fishers in the tropics may lose their livelihoods as entire fish populations move away.
But species that are fixed in place, like sponges and corals, can’t leg it (or fin it) to cooler areas.
“The fixed ones are likely going to be seeing absolute thresholds of heat that they can't coexist with, and so you're going to see a decline of those,” says Van Houtan.
Fraction of the ocean surface annually experiencing extreme heat, grouped by a, northern hemisphere and b, southern hemisphere and indian ocean basins. the point of no return (ponr) occurs when each series surpasses and remains above 50%(dashed grey line), or when the historical baseline of extreme heat becomes ‘normal’.
This first occurs in 1998 in the south atlantic basin and for the global ocean occurs in 2014.
Extreme heat poses an additional danger, even for species that are already in the process of gradually migrating to cooler areas.
“When you have these abrupt events like marine heat waves, they don't give any time for adaptation,” says Seegers.
“So they can result in really high mortality.
This happens across ecosystems from coral reefs to kelp forests, and they can cause seabirds to die.”
“It can take the system years to recover,” Seegers adds, “because if you have a lot of mortality, it's not going to necessarily go right back to normal.”
Further complicating matters, these heat extremes often coincide with low winds.
The wind plays an important role in the ocean food chain, because it mixes the water, bringing up nutrients from the depths.
Tiny photosynthetic organisms called phytoplankton rely on these nutrients, just the way the plants in your garden rely on fertilizer.
These phytoplankton feed animal species called zooplankton, which feed fish, which feed marine mammals and seabirds.
Losing the phytoplankton to extreme heat, then, assaults the base of the food web.
And crucially, phytoplankton produce most of the oxygen in our atmosphere.
“The reality is that we have two lungs on the planet: One of them's green—the forests—and the other one's blue—the ocean.
The ocean supplies more than half of the oxygen that we breathe,” says Van Houtan.
“It's no understatement to say that the ocean is the beating heart of our climate system, and the ocean is absolutely critical for sustaining human life on this planet.”
The only way to keep that life support system online is by massively cutting greenhouse gas emissions, and fast.
The oceans can’t take much more of this heat.
Links :
- Eureka : Monterey Bay Aquarium study finds extreme heat is the ‘new normal’ for the ocean
- The Guardian : Extreme heat in oceans ‘passed point of no return’ in 2014
- Vice : Extreme Heat is the ‘New Normal’ in Earth’s Oceans, Study Warns
- ScienceNews : The past’s extreme ocean heat waves are now the new normal
- Mongabay : ‘There’s not much hope’: Mediterranean corals collapse under relentless heat
- PBS : Ocean heat is at record levels, with major consequences
No comments:
Post a Comment