The Copernicus Sentinel-5P satellite carries the state-of-the-art Tropomi instrument to map a multitude of trace gases such as nitrogen dioxide, ozone, formaldehyde, sulphur dioxide, methane, carbon monoxide and aerosols – all of which affect the air we breathe and therefore our health, and our climate.
With a swath width of 2600 km, it maps the entire planet every day.
Information from this mission is used through the Copernicus Atmosphere Monitoring Service for air quality forecasts and for decision-making.
Tropomi – a spectrometer – maps the global atmosphere every day with a resolution as high as 7 km × 3.5 km.
At this resolution, air pollution over cities can be detected.
It will be the autumn before S5P-Tropomi is fully operational for all the gases it monitors
What must it be like to live in the Siberian town of Norilsk on a "bad air day"?It will be the autumn before S5P-Tropomi is fully operational for all the gases it monitors
From BBC by Jonathan Amos
They say the local smelting industry produces 1% of all the sulphur dioxide (SO₂) going into the air globally, something close to two million tonnes a year.
SO₂ is particularly unpleasant if breathed in; but it also washes out of the sky as "acid rain", damaging plant-life and denuding the quality of water in streams and rivers.
The extent of Norilsk's pollution problem is captured in remarkable new maps from Europe's Sentinel-5P satellite.
The spacecraft was put up last year to track the gases responsible for dirty air - with SO₂ being one of the prime culprits.
Launched on 13 October 2017, the Copernicus Sentinel-5P satellite has been used to map atmospheric carbon monoxide around the globe.
Assembled in the UK and carrying the Dutch-led Tropomi instrument, S5P promises to be a game-changer in monitoring what's happening in our atmosphere.
It has much higher resolution than its predecessors and acquires data on such a scale that its maps can be assembled very quickly.
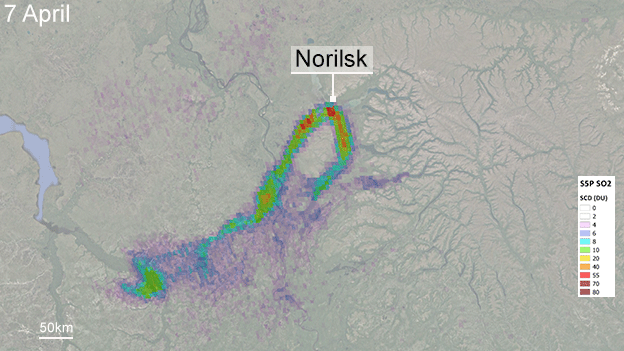
Image copyright Copernicus Data 2018/TROPOMI/BIRA-IASB/DLR
Wind takes the sulphur dioxide south of the city, splitting the plume around mountains
Wind takes the sulphur dioxide south of the city, splitting the plume around mountains
"What's very interesting about the Norilsk data is that they show you the different transport pathways," explained Dr Nicolas Theys from the Royal Belgian Institute for Space Aeronomy (BIRA-IASB).
"You can see how the emissions follow the topography, moving around the mountains. People could use this information to better assess the environmental impact in this region."
The SO₂ concentrations in the air over Norilsk are very large - one-hundred to a thousand times higher than what you would see anywhere in Europe, for example.
The city's Norilsk Nickel company has been told to cut emissions by 75% by 2023 (compared with 2015) or face huge fines.
What are the different SO₂ sources?
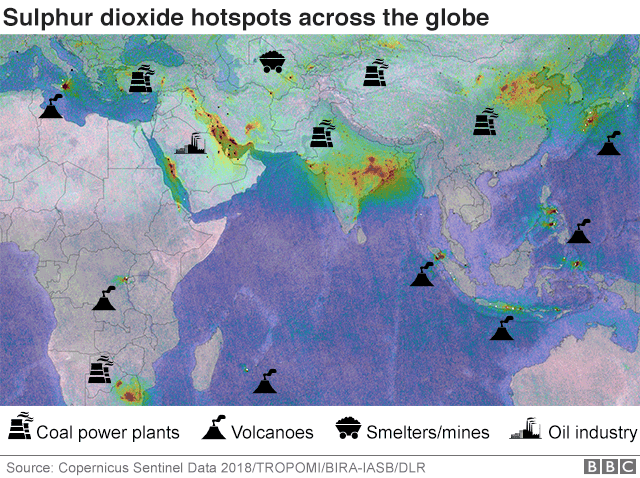
This partial map of the globe comprises 6 months worth of data
So, smelting is clearly one big emitter.
The gas is driven off as metal ores that also contain sulphur compounds are heated to high temperature.
Other major contributors include the burning of coal and oil.
Again, these include sulphur in their composition, which will be emitted as SO₂ when the fossil fuels are burned - unless the gas is caught, or "scrubbed", in some way.
The map above represents six months of S5P-Tropomi data.
In this partial picture of the globe, many familiar hotspots for SO₂ become apparent.
The step-change now being provided is the ability to differentiate sources.
"We can clearly distinguish the different power plants," said Dr Theys.
"As we get better with the data and reduce the noise, we will probably be able to estimate the quantity of emissions coming from individual power stations and complexes."
Such information will apply further pressure on the dirtiest sources to clean up their act.
Satellites like S5P-Tropomi are making it increasingly difficult for polluters to hide their activity.
And the kind of data you see on this page will all be worked into services that inform people about air quality, through channels such as TV weather forecasts and smartphone apps.
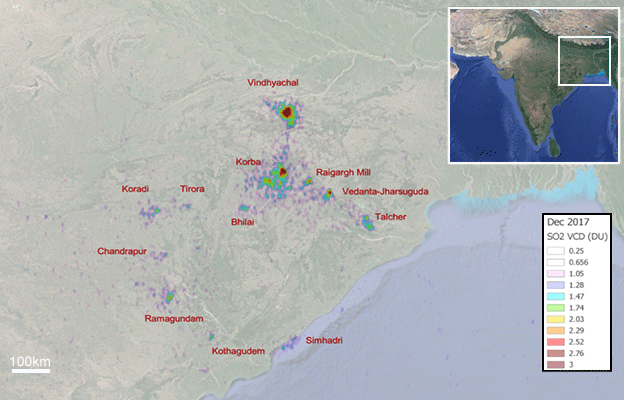
Image copyright Copernicus Data 2018/TROPOMI/BIRA-IASB/DLR
Northeast India's power stations are obvious to the Sentinel satellite
What about SO₂ from volcanoes?
This is the main natural source of sulphur dioxide in the atmosphere.
Looking again at the world map, it is easy to pick out the regions of recurrent volcanic activity, such as at Etna in Italy and Nyiragongo in the Democratic Republic of the Congo.
Climate modellers are interested in this kind of data because very large sulphur emissions can actually work to cool the planet.
Just seeing where the SO₂ plumes go also tells you something about where the volcanic ash thrown out by volcanoes is headed.
This is important to the aviation sector.
Everyone remembers the disruption to air travel that resulted from the 2010 eruptions of Eyjafjallajökull in Iceland.
The Copernicus Sentinel-5P satellite imaged sulphur dioxide from the Mount Agung volcanic eruption on Bali, Indonesia, between 8 and 29 November 2017.
As well as detecting different air pollutants, the mission also measures aerosols, as this sequence of images shows.
Credits: This sequence of images contains modified Copernicus Sentinel data (2017), processed by ESA/DLR.
Show me something really smart
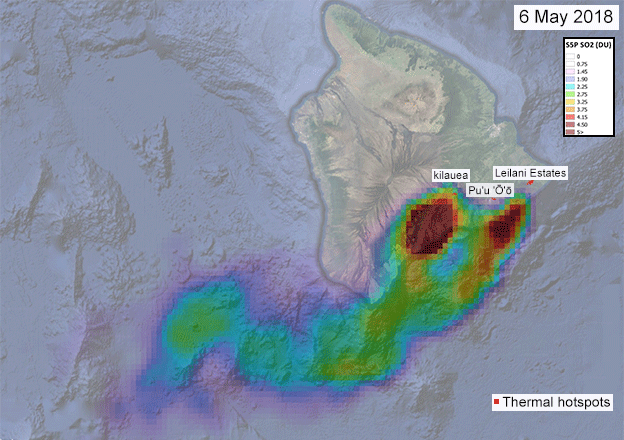
Image copyright Copernicus Data 2018/TROPOMI/BIRA-IASB/DLR
Improved resolution enables the different source locations to be identified
Improved resolution enables the different source locations to be identified
In recent weeks, Tropomi has also had a very good view of the major ongoing eruption on Hawaii's Big Island.
The instrument has been able to discriminate between the SO2 coming from the main volcanic edifice of Kilauea and those emanating from the troublesome new fissures in the populated Leilani Estates district to the east.
What is particularly clever is the way the Tropomi data has been combined with observations from the American Suomi-NPP weather satellite.
In the observations from this US spacecraft, you can just make out the volcanic smog, or "Vog", drifting away to the south of Big Island.
Vog is a respiratory irritant that is made when SO₂ combines with oxygen and water vapour in the atmosphere, in the presence of sunlight.
Suomi-NPP's Vog data maps perfectly on to Tropomi's direct sensing of SO2.
"[Suomi-NPP] and Tropomi are separated by just four minutes as they fly overhead," explained Dr Theys.
"We've shown this to the emergency response team and they are very interested in what we can do, not just because there is information in here about the eruption but because there are impacts for air quality. In truth, though, the volcano has come a bit early for us because we are not yet in the full operational phase and it is not possible for us at the moment to produce such maps in near-real time and deliver them to the people working in the field."
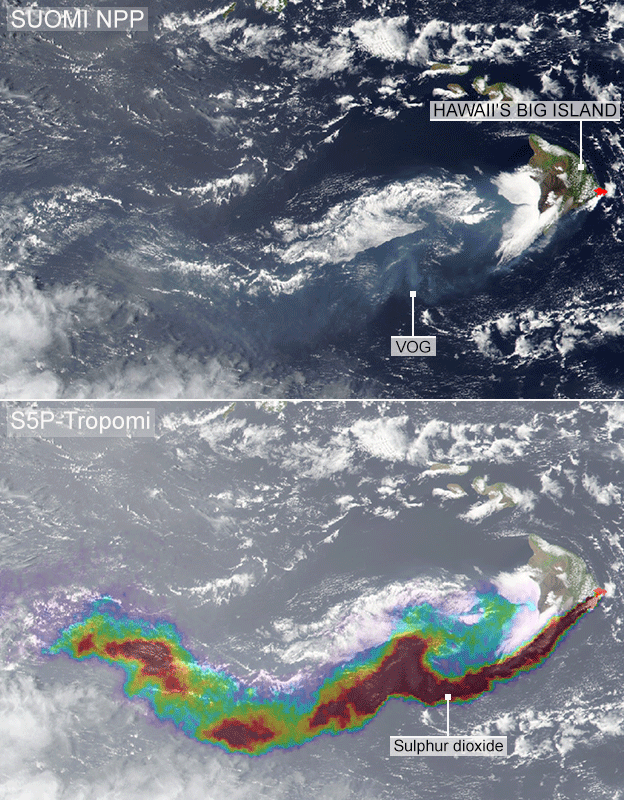
Image copyright Copernicus Data 2018/TROPOMI/BIRA-IASB/DLR
The American (top) and European (bottom) satellites fly almost on top of each other
What now for S5P-Tropomi?
After a test and commissioning phase, S5P-Tropomi is about to go operational for some of its data products.
These include pollutants such as nitrogen dioxide (NO₂) and carbon monoxide (CO).
The SO₂ observations, however, still need some work and they will not be released until the autumn.
Overall, the Tropomi investigations on S5P are led from the Netherlands Met Office (KNMI).
Dr Theys' institution in Belgium heads up the analyses of sulphur dioxide and another of the mission's trace-gas targets, formaldehyde (HCHO).
The bus, or chassis, of the satellite was assembled by Airbus in the UK, making S5P Britain's biggest single industrial contribution so far to the Sentinel series of satellites that have been procured for the European Union's Copernicus Earth-monitoring programme.
Many of the UK's scientists are also heavily involved in this Europe-wide project.
The hope is that this collaboration will continue after Brexit, although this will depend on the type of association Brussels and London are able to negotiate in their separation pact.
Links :
- GeoGarage blog : Sentinel tracks ships' dirty emissions from orbit / Lower emissions on the high seas
- Sentinel5P : first image air pollution movement
- Copernicus : CAMS poised to fully implement newly released Sentinel-5P data
Phys : Copernicus Sentinel-5P releases first data
ReplyDelete