Monday, December 19, 2022

iPhone 14 : SOS d'urgence par satellite est disponible en France


Gratuit pendant deux ans après activation de l'iPhone

From GNT by Jérôme G.


Ayant déjà fait beaucoup parler d'elle, la fonctionnalité de SOS d'urgence par satellite pour les iPhone 14 débarque en France.

C'était attendu.
Apple annonce aujourd'hui que tous les modèles d'iPhone 14 (iPhone 14, iPhone 14 Plus, iPhone 14 Pro et iPhone 14 Pro Max) ont la possibilité de bénéficier de son service SOS d'urgence par satellite en France (et pas uniquement métropolitaine).

Les autres pays concernés par cette activation sont l'Allemagne, l'Irlande et le Royaume-Uni.
Depuis le mois de novembre dernier, SOS d'urgence par satellite était proposé aux États-Unis et au Canada.

Le groupe de Cupertino indique que la prise en charge de SOS d'urgence par satellitesera étendue à d'autres pays dans le courant de l'année prochaine.

Pour aider à sauver des vies

Le propos est pour rappel de permettre l'envoi d'un message aux services d'urgence quand il n'y a pas de couverture réseau cellulaire ou Wi-Fi.
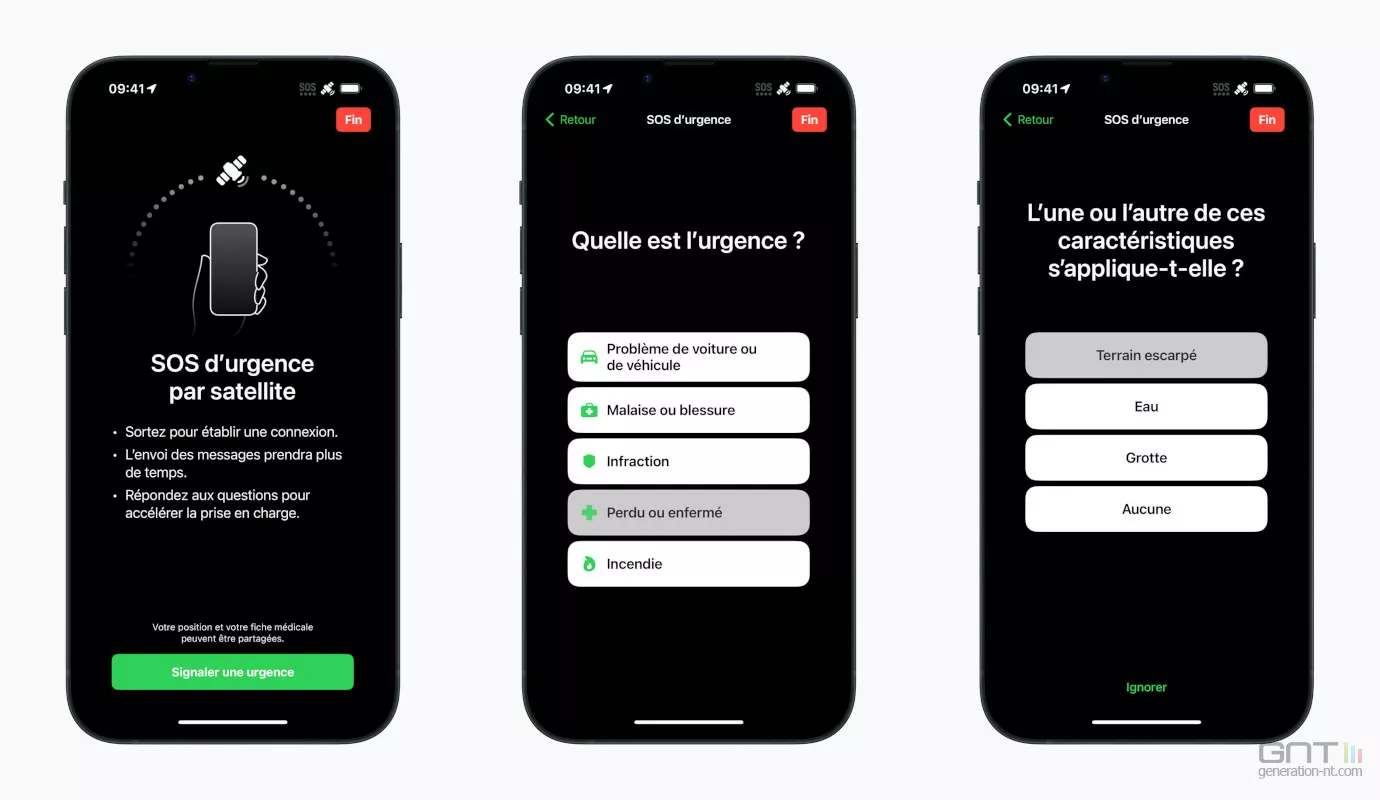
L'iPhone affiche un questionnaire afin d'évaluer l'urgence et l'utilisateur est guidé pour la bonne orientation de son appareil dans l'optique d'une connexion à un satellite.

Le message initial comprend les réponses aux questions, la localisation et l'altitude, ainsi que le niveau de batterie de l'iPhone et la Fiche médicale si celle-ci a été configurée.
Il y a une transmission à des centres où des personnes formées par Apple préviennent les secours.


SOS d'urgence par satellite s'appuie sur un partenariat avec l'opérateur américain Globalstar spécialisé dans la téléphonie par satellite.
Il dispose d'une constellation d'une cinquantaine de satellites en orbite terrestre basse.
Ils opèrent à une altitude d'environ 1 400 km.
Apple va par ailleurs financer 95 % des coûts d'une nouvelle génération de satellites commandés par Globalstar.

Dans sa communication, Apple souligne la prouesse pour permettre ce genre de service avec l'iPhone 14, sans intégrer une imposante antenne afin de se connecter aux fréquences des satellites, ainsi qu'un algorithme de compression pour réduire la taille des messages.
Sachant que la bande passante est évidemment limitée.

Le service SOS d'urgence par satellite est gratuit pendant deux ans à partir de la date d'activation d'un nouvel iPhone 14.
Aucune précision pour le moment concernant la tarification ultérieure.
Le service nécessite iOS 16.1 au minimum.
 
Links :

Preparing for Meteosat third generation: think global, act local


From Eumetsat by Adam Gristwood

How users in Central and Eastern Europe are anticipating the arrival of Europe’s next generation of geostationary meteorological satellites

Meteorologists in Central and Eastern Europe say that data provided by EUMETSAT’s Meteosat Third Generation satellites will expand opportunities for nowcasting and storm prediction, and promote teamwork at all levels.

On 28 June 2014, an intense area of low pressure formed over the western Atlantic.
The system quickly evolved into Hurricane Arthur, the first named storm of the season.

Making landfall in North Carolina, US, and powering northwards along the coast to Canada, Arthur – a category 2 storm – blew down trees, damaged houses, cut power, and closed airports.

Predicting the exact nature and path of a hurricane is notoriously difficult.
Nevertheless, thanks to a multitude of Earth observations from space and ground, forecasters can provide a cone of uncertainty, representing the likely track of the centre of a storm.

What was impossible to forecast at the time, however, was the role that Hurricane Arthur would play in the formation of a once-in-a-generation hailstorm that struck thousands of kilometres away in Bulgaria’s capital, Sofia.

Sofia was hit by an unexpected hailstorm on 8 July 2014, with radar images clearly showing the heavy precipitation.
Credit: Hail Suppression Agency, Bulgaria.

Unseen impacts

“A large, fast-moving air mass associated with the aftermath of the hurricane crossed the Atlantic, contributing to the largest hail storm Sofia has seen since 1941,” recalls Dr Christo Georgiev, a professor in the Forecasts and Information Service Department of Bulgaria’s National Institute of Meteorology and Hydrology (NIMH).

“Using hindcasting techniques, researchers analysed the footprints left in satellite data and simulated the reverse trajectory of the air masses by numerical models.
They identified a strong relationship between conditions in the upper atmosphere and the development of the extreme weather in eastern Europe.”

On 8 July – days after Hurricane Arthur had dissipated in the Labrador Sea – an intense area of convective activity grew above eastern Serbia.
It then split into two major storms, one headed in the direction of Sofia.

Wind gusts of up to 125km an hour coincided with hailstones the size of baseballs.
More than 40 people were injured and damage exceeded 50 million euros.

“Data provided by EUMETSAT’s Meteosat Second Generation (MSG) satellites helped hindcast the role of a large plume of water vapour in the upper atmosphere, which mixed with moist air and large temperature gradients at lower altitudes, and seeded the conditions for the storm,” Georgiev says.

 
To better understand the impacts of Hurricane Arthur on the hailstorm in Sofia, experts combined images taken by NOAA’s Geostationary Operational Environmental Satellites (GOES) and EUMETSAT’s MSG spacecraft.
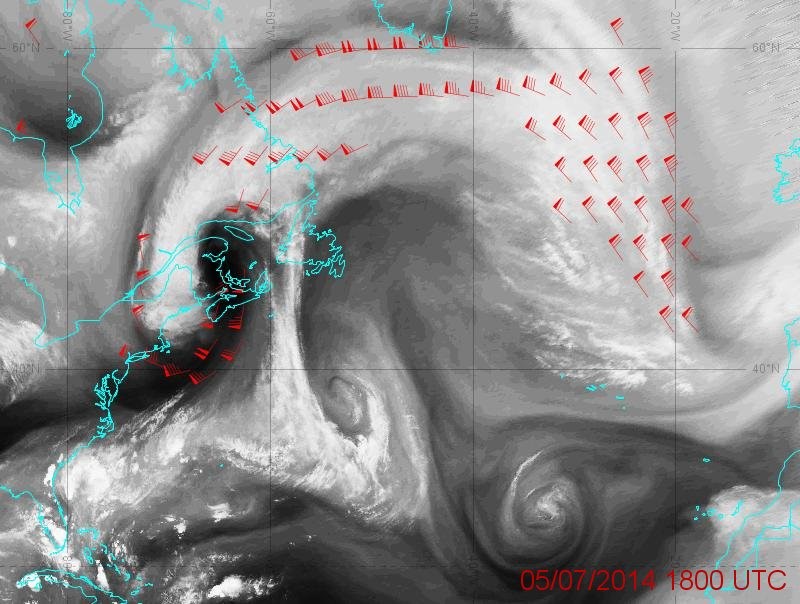
Large scale movement of water vapour in the atmosphere was tracked using the Action de Recherche Petite Echelle Grande Echelle (ARPEGE) global numerical weather prediction model.
Image courtesy of Karine Maynard, Meteo-France.


“Water vapour, or general humidity, forms an important link between land and ocean, and is a crucial mechanism for transporting energy around the planet.

“Such mesoscale processes can also play a key role in extreme weather at regional and local levels.
But humidity is also one of the hardest variables to observe effectively over large areas.”

EUMETSAT’s Meteosat Third Generation (MTG) satellites will play a vital role in turning such hindcasts into forecasts.

“To predict storms and their implications at a very local level, nowcasters must bring together and analyse as much data as possible, as frequently as possible,” Georgiev says.

“Meteosat satellites continuously have their eyes on the whole of Europe and beyond: they are in a superb position to meet this need.

“Meteosat First Generation satellites, beginning in the late 1970s, were the earliest geostationary meteorological spacecraft to feature instruments able to measure water vapour in the atmosphere from space.

“Since the early 2000s, Meteosat Second Generation has provided much more data, increasing the number of channels on the visible and infrared spectrum from three to 12.
This has enabled us to track water vapour and associated winds in the mid and upper atmosphere, with huge benefits for diagnosis and numerical weather prediction.

“Now, with the imminent launch of MTG satellites, we are looking forward to further increases in the amount, types, and frequency of data delivery.
This will help improve our ability to predict fast-evolving weather events, and hopefully turn more hindcasts into nowcasts.”

MTG’s first imager satellite will launch on 13 December 2022.

Multidimensional view


Georgiev says MTG will help meteorologists build up a four-dimensional picture of humidity – and other key variables such as temperature – in the atmosphere in near-real time.

“The Flexible Combined Imager aboard MTG’s Imager satellites will provide more detailed data on moisture and its circulation in the upper parts of the atmosphere,” he explains.
“It will also enable observation of water vapour at lower altitudes, something that’s not previously been possible using MSG measurements.

“New hyperspectral sounding instruments on board MTG’s sounder satellites will enable meteorologists to detect the distribution and temperature of water vapour.
They will do this by providing vertical profiles of the ever-changing state of the troposphere, from the ground up to the stratosphere.

“The new Lightning Imager, on the other hand, will provide continuous observations of lightning activity from space, providing comprehensive data on lightning flashes across Europe and Africa for the first time.

“Collectively, these observations will provide tremendous opportunities to enhance nowcasts, forecasts, numerical weather prediction models, land surface analyses, and much more.”

 
Like their predecessors, MTG satellites will have a constant eye on a substantial part of the Earth’s surface – image compiled using test data.
Credit: Image courtesy of Jan Kanak.


Capturing ‘overshooting tops’

Another way MTG will benefit storm prediction is by providing more opportunities for meteorologists to detect “overshooting tops” – dome-like protrusions atop cumulonimbus clouds driven by large updrafts, which can indicate a storm may be about to strike.

“Early detection of overshooting tops presents a window of opportunity to nowcast intense storms and for authorities to issue warnings,” says Dr Jan Kanak, a physicist at the Slovak Hydrometeorological Institute (SHMI), who has been working with Georgiev and other experts from across Europe to prepare for the arrival of MTG data.

“But detecting them is highly challenging, not least because the timescales on which overshooting tops occur is very short, often in the range of 10 minutes or much less.
Current satellite missions enable scans of the Earth’s disk every 15 minutes, so there are still many that we do not see.

“MTG will provide observations more regularly, with rapid-scan data available up to every two-and-a-half minutes.
It will present an opportunity to detect many more overshooting tops – not only in visible channels but also in the infrared, which is invaluable for observing the Earth at night-time.

“We will also be able to better observe other important variables, including minimum cloud top temperatures – a vital piece of information for predicting the strength of a storm – to better know the size of water droplets within clouds and to integrate this data into nowcasts and forecasts.”

Kanak, who has worked at SHMI since 1985, also develops real-time processing software with the goal of ensuring that data collected by EUMETCast reception stations and the EUMETSAT archive have the greatest possible impact at the regional level.

Products developed by his team decompress, calibrate, georeference, archive, and visualise satellite data so that users can efficiently make sense of it and integrate it for their needs.
They are used in at least 11 countries across Central and Eastern Europe.

“By operating these products for Meteosat Second Generation, we have learned a lot about how to effectively organise training, update software, and provide a stable service for users,” he says.

“MTG presents an opportunity to open up such software and products to an even larger community of users.

“Getting the most out of MTG data requires teamwork at many different scales – at the global level, the European level, and the regional level.

“To ensure users such as nowcasters, forecasters and researchers are ready, a huge number of MTG user preparation activities have taken place or are in the planning.

“EUMETSAT and national meteorological and hydrological institutes have joined forces on crucial aspects such as the development of training activities, updates to products and services, and studies of test data to prepare users for the arrival of new data types – such as lightning data.”

Regional connections

Both Kanak and Georgiev say that such joint activities between countries in Central and Eastern Europe are essential for preparations to efficiently use MTG data.

For example, Bulgaria’s NIMH is one of the operational users of MSG processing software developed by Kanak in the Slovak Republic, providing feedback to support the testing of new applications and the development of a new, MTG version.

The pair first met at the 1994 edition of the EUMETSAT Meteorological Satellite Conference.
They later took part in the 2010 Data Access to West Balkan and East Europe (DAWBEE) project, providing technical support and training to beneficent countries.

“We introduced users not only to Red Green Blue (RGB) imagery from MSG satellites, but also Meteosat Meteorological Product Extraction Facility products,” Kanak recalls.

“These products help forecasters to monitor upper atmosphere divergence, and the occurrence of precipitation, drought, and fires.

Software such as MSG Proc enables users to blend images from different MSG channels together to help make sense of storms.
Credit: Image courtesy of Jan Kanak.


“In last few years we have also co-developed processing and visualisation capabilities for the common display of RGB imagery and lightning data from MTG’s new instruments – the Flexible Combined Imager and Lightning Imager.”

These new data types present challenges but also tremendous opportunities, Kanak adds.

“For meteorological understanding, it is very important to have data over all of Europe, because severe storms relate to local conditions, orography, and distance from the sea and ocean,” he explains.

“But in their final application they must be localised to our conditions.
Therefore, close collaboration with meteorological services to develop products and models specific to the region are also essential.

“In combination with initiatives such as the European Weather Cloud, huge amounts of satellite data will ultimately be more easily accessible.

“Meteorological services across our region will be able to dedicate more time to furthering the meteorological aspects of products and ensuring that satellite data fulfil their maximum potential to benefit society and help save lives and property.”
 
Links :

Sunday, December 18, 2022

Mini 6.50 with foils


The mini 6.50 @nicomatic_official of @caroboule deploys its new foils for the first time off Lorient.
The Manuard design developed by Caroline and @benoit_marie_navigator has exceeded 20 knots of speed in a light NE breeze!
 
Links : 

Saturday, December 17, 2022

222.4 km/h: wind powered world land speed world record broken

Emirates Team New Zealand and Land speed pilot Glenn Ashby have sailed ‘Horonuku’, their wind powered land speed world record craft, faster than any previous records.
‘Horonuku’ named by Ngāti Whātua Ōrākei meaning ‘gliding swiftly across the land’ did exactly that and was clocked at 222.4km/h in 22 knots of windspeed on Lake Gairdner in South Australia
 
Links :

Friday, December 16, 2022

Russian tanker falsifies AIS data, hides likely activity around Malta and Cyprus


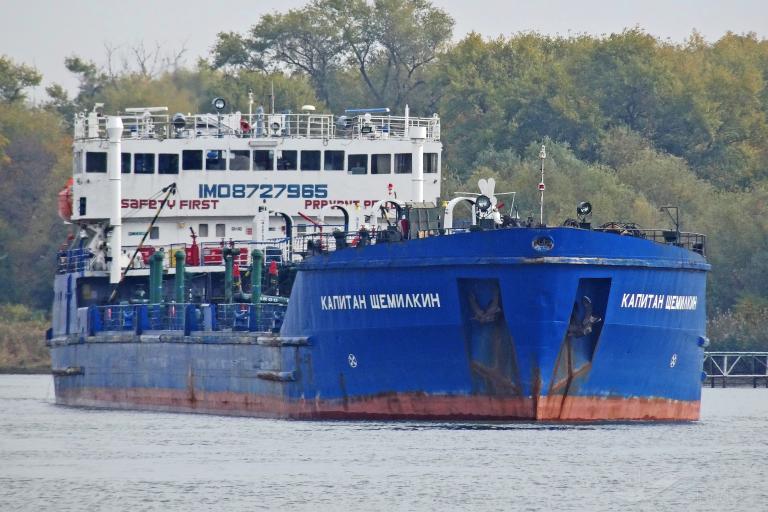
The 138-meter Russian flagged tanker KAPITAN SCHEMILKIN (IMO 8727965) in 2020.
Credit: sychikov/VesselFinder
 
From SkyTruth by Bjorn Bergman

The maritime world is likely entering an unprecedented period of deceptive shipping practices by tanker operators seeking to avoid sanctions.
The recent announcement of a price cap on Russian crude—and a new ban on Western companies insuring Russian cargoes—sets the stage for an increase in clandestine activities by ocean vessels.
Not only does this intentional deception provide cover for possibly illegal activity: The misuse of Automated Identification System (AIS) collision avoidance signals jeopardizes safety at sea by ratcheting up the risk of collisions, oil spills, and other serious accidents.


Over the past year work by the research team at Global Fishing Watch (GFW), an international nonprofit organization dedicated to advancing ocean governance through increased transparency of human activity at sea, has found position falsification by tankers carrying Venezuelan crude.
(GFW supported the work outlined in this report.)
Previous investigations by SkyTruth also have documented cases of manipulation of AIS positions.

A few months ago the GFW research team started investigating the unusual track of a tanker operating in the Black Sea and the Mediterranean.
It would prove to be the first detection ever of a Russian-flagged tanker broadcasting false coordinates—and it may be the first of many.

Analysis of the broadcast AIS positions from the tanker KAPITAN SCHEMILKIN since the beginning of 2022—and correlation with satellite imagery—identifies two distinct periods when the vessel was broadcasting false positions.
Identification of the false positions is based on the vessel being repeatedly not detected by satellite radar imagery at the times and locations suggested by its AIS broadcasts, as well as a reported AIS track that does not reflect the movement of a real vessel.

We have reconstructed the true movements of the tanker with high confidence thanks to some surprising behavior: The tanker continued to broadcast its real destinations (Malta and Northern Cyprus) and estimated times of arrival (ETA) while simultaneously broadcasting false coordinate positions.
Additionally, the tanker could be picked out at these broadcast destination locations with Planet imagery, including weeks at an anchorage offshore of Malta and likely fuel delivery on August 19 and 20 at the Teknecik Power Plant in Northern Cyprus.
The sighting in Cyprus occurred at a time when local press was alleging irregularities and manipulation related to persistent power outages and the renewal of contract for supplying the power plant.


The AIS track of the KAPITAN SCHEMILKIN shows two distinct false segments (red) occurring from May 28–July 12, 2022 and from August 16–21, 2022.
Likely real locations (yellow) during these false segments are the Malta Outer Port Limit anchorage and the Teknecik power plant in Northern Cyprus.
Credit: Spire/Global Fishing Watch

Detection of False AIS Positions

The KAPITAN SCHEMILKIN, a 138m tanker, is required by International Maritime Organization (IMO) regulations to continuously broadcast its position via AIS.
A tanker of this size is also quite distinct on satellite radar imagery acquired by the European Space Agency’s Sentinel-1 (S1) satellites.
In European waters, S1 imagery is captured with high revisit frequency—the time interval between images of the same location—here typically every 2–5 days.
Global Fishing Watch recently completed the processing of the S1 image archive to extract all vessel positions appearing in these radar images.
Automated correlation of AIS positions and S1-detected vessel locations serves as a new and powerful tool for verifying that vessels are broadcasting real positions.
This is particularly true for large vessels like the KAPITAN SCHEMILKIN, which we estimate would be detected on a S1 radar image more than 95% of the time.

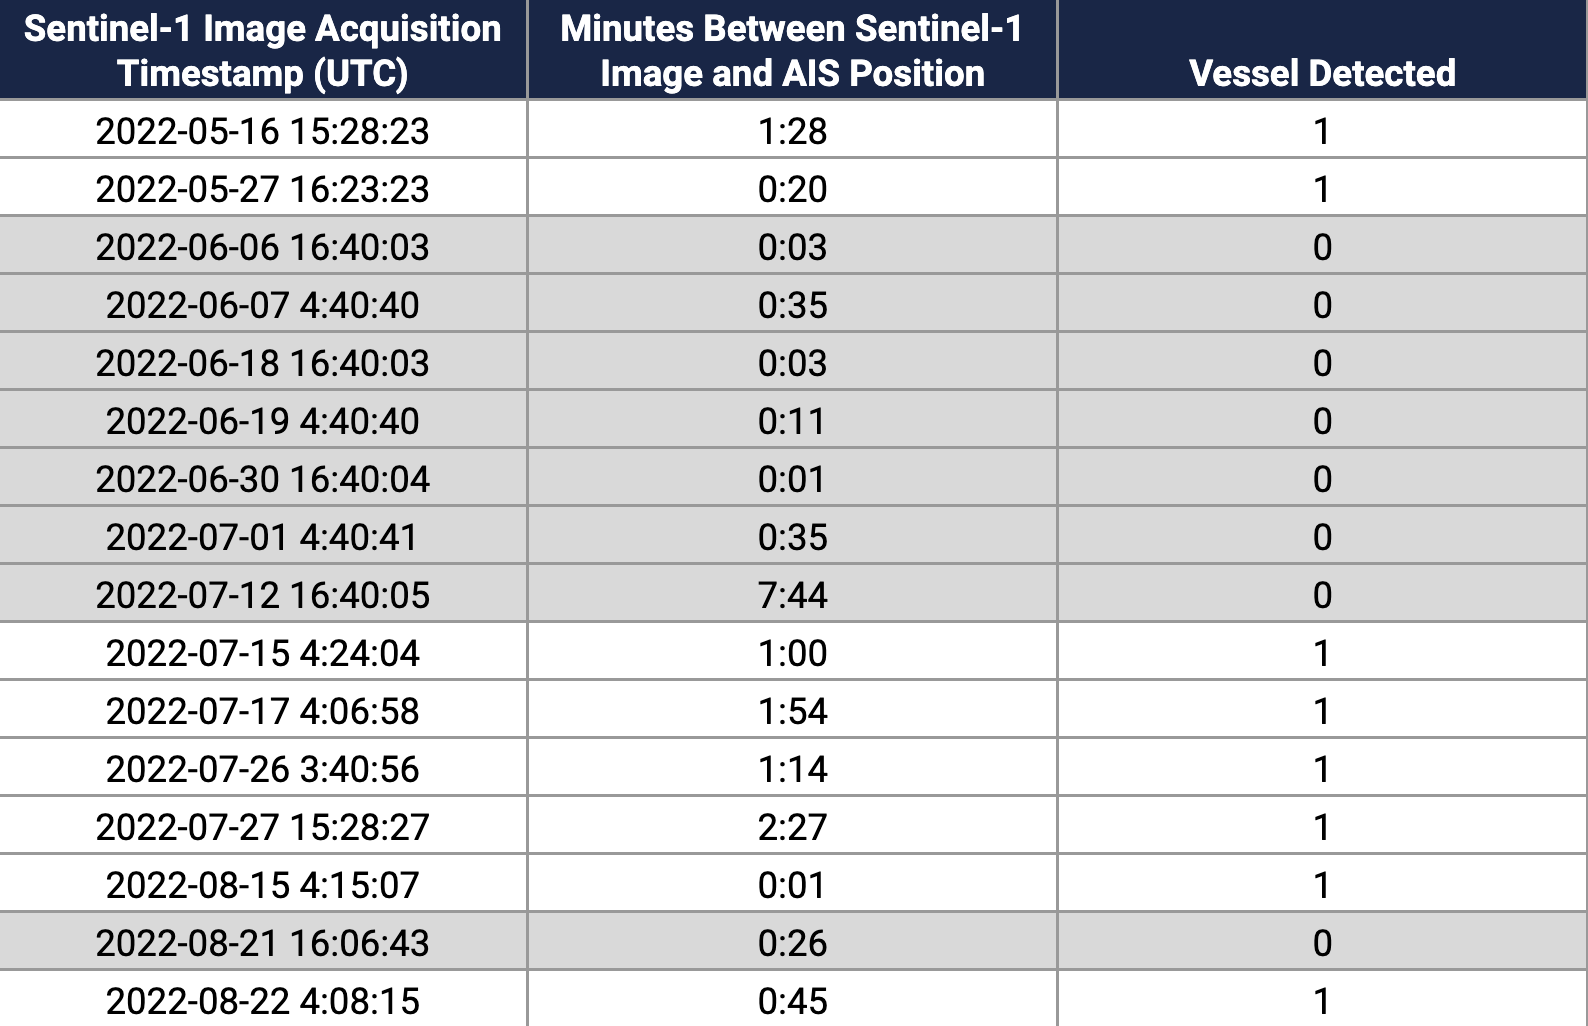
When we ran an automated correlation of AIS from the KAPITAN SCHEMILKIN and S1 scenes we found that the tanker should have appeared in 36 S1 scenes from January–August 2022; however, the tanker appears in only 28 of the scenes.
The vessel is missing in seven scenes from June 6–July 12, 2022 and from one scene on August 21, 2022.


Table 1: Automated correlation of the broadcast AIS track of the KAPITAN SCHEMILKIN show a number of S1 scenes (highlighted in gray) when the the vessel should have appeared on the S1 radar imagery but did not.
View more


Sentinel-1 scenes were examined individually to confirm that the tanker was not missing due to any problem with imagery (other nearby vessels of similar size were appearing normally).
We also checked additional optical imagery sources, which confirmed the pattern seen with S1: the tanker disappears for a long period in June and July and for a shorter period later in August.


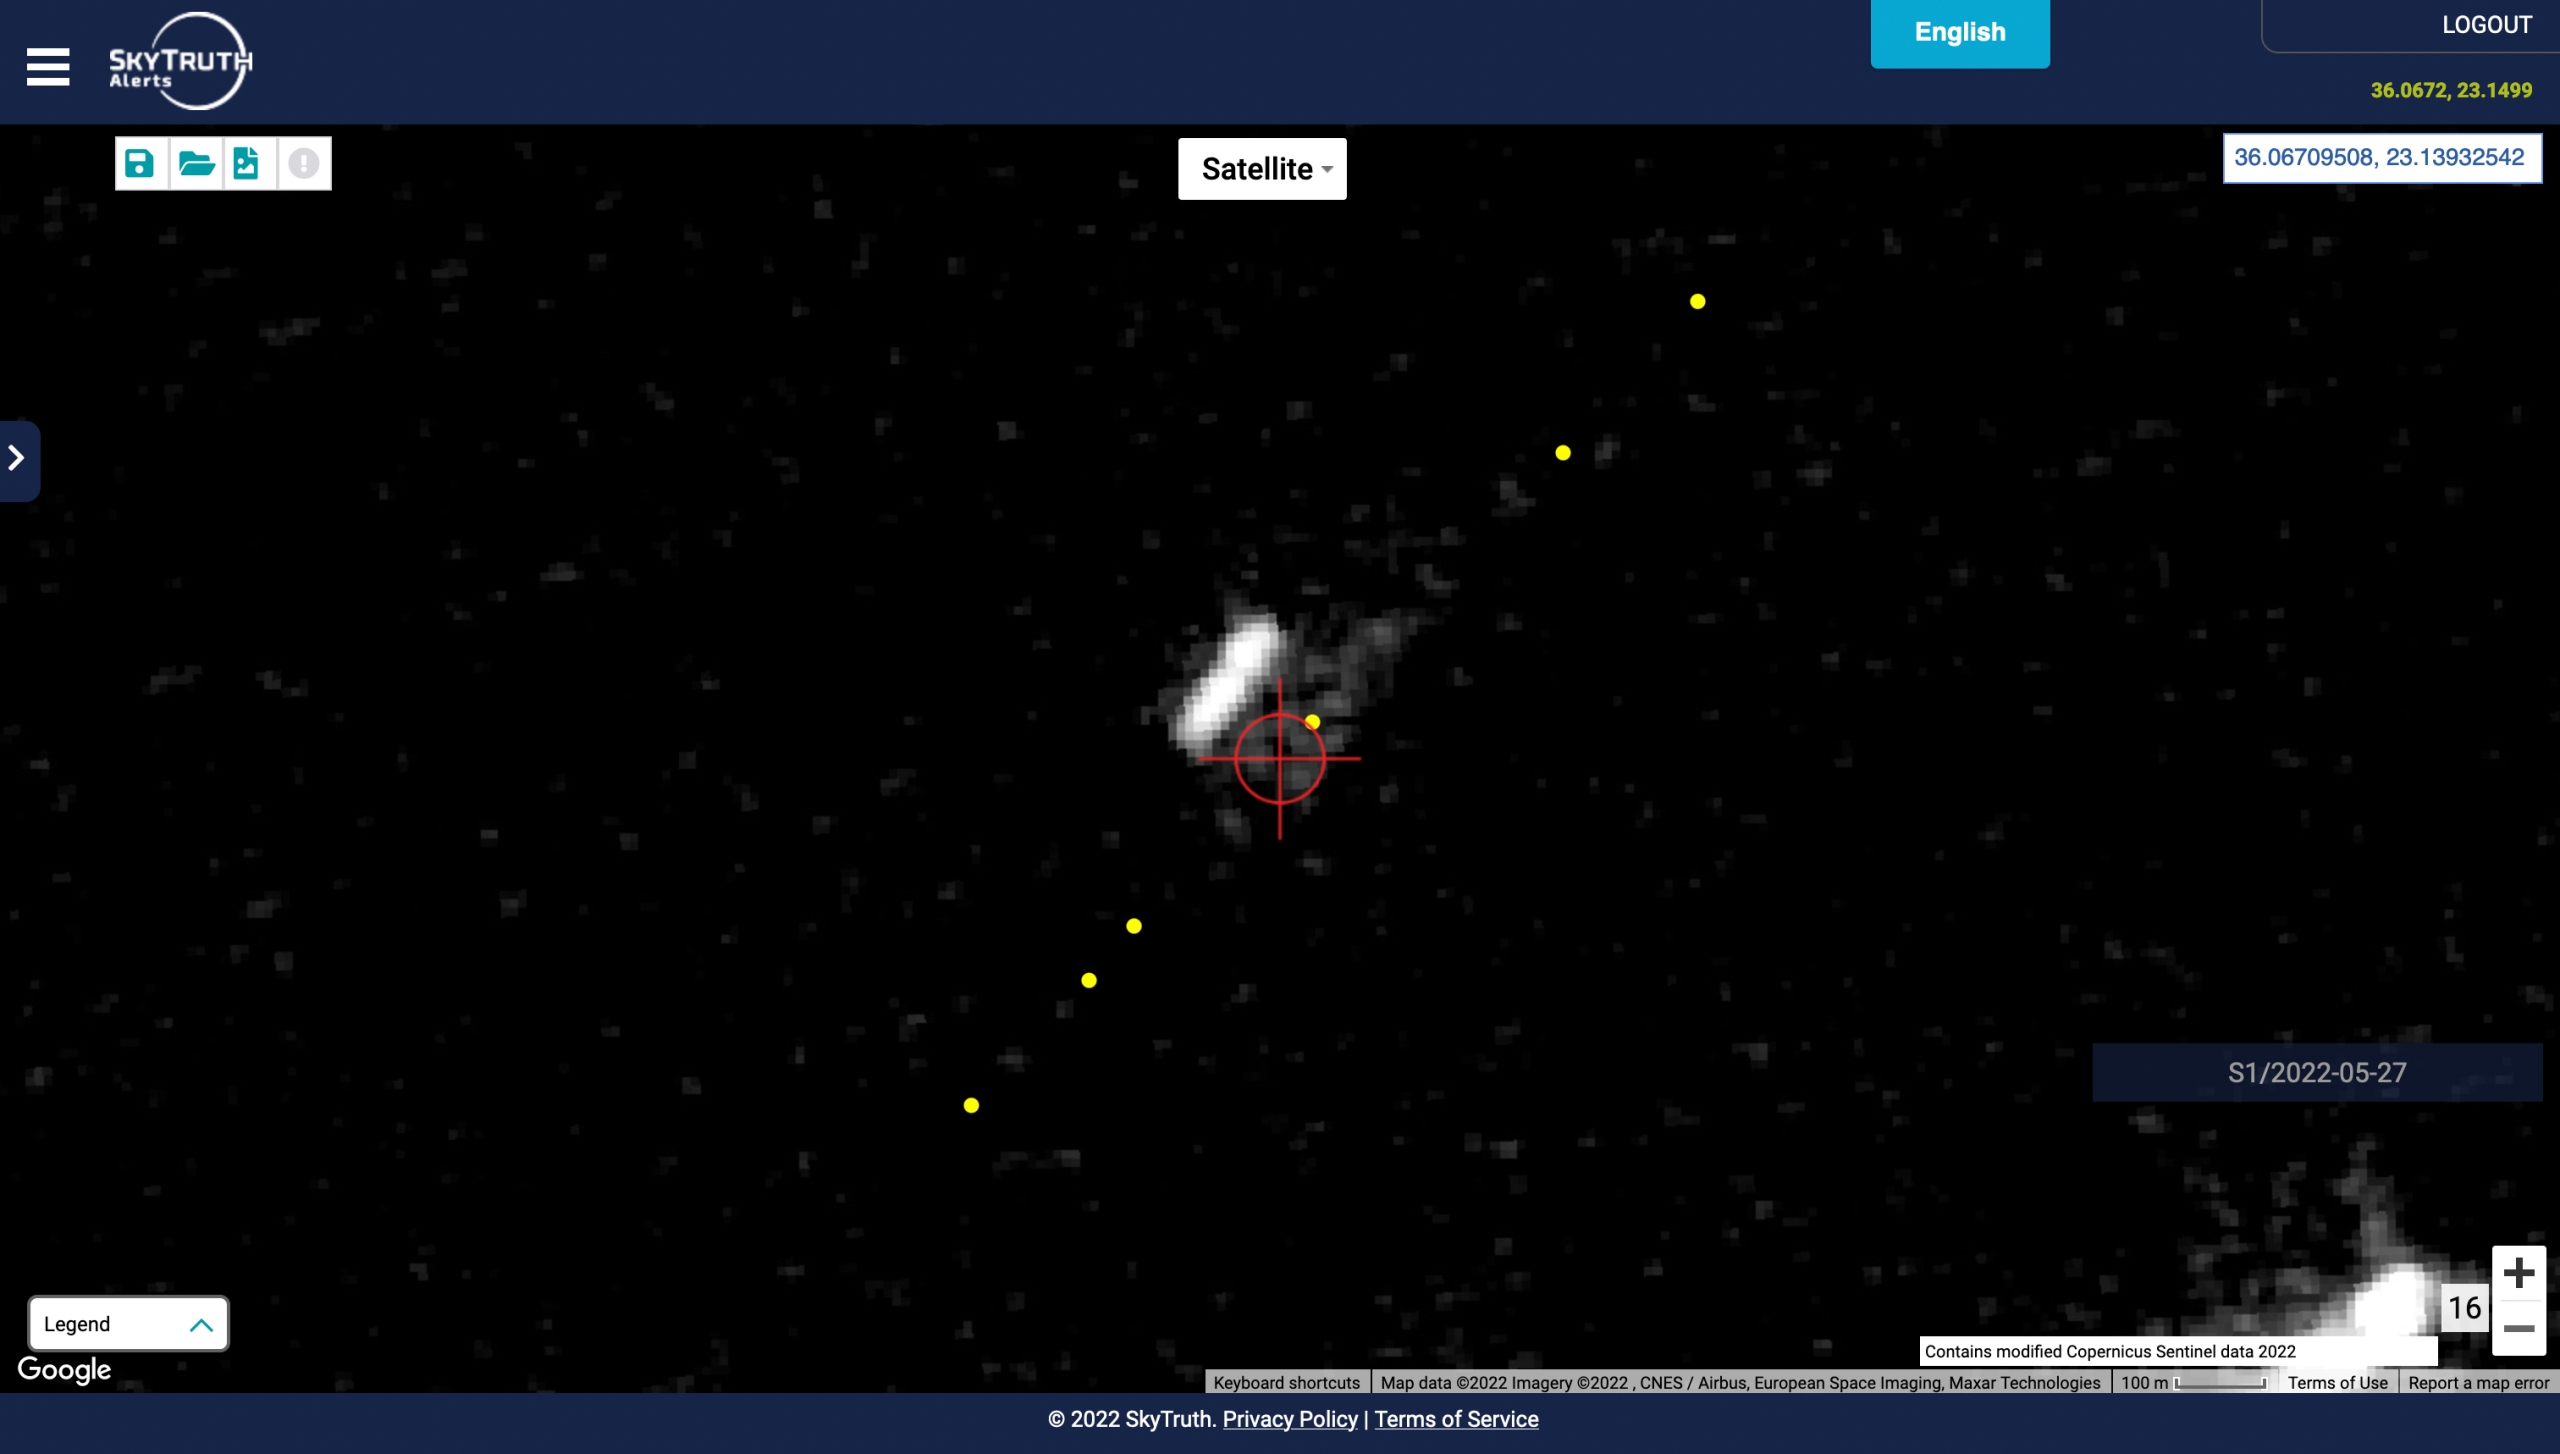
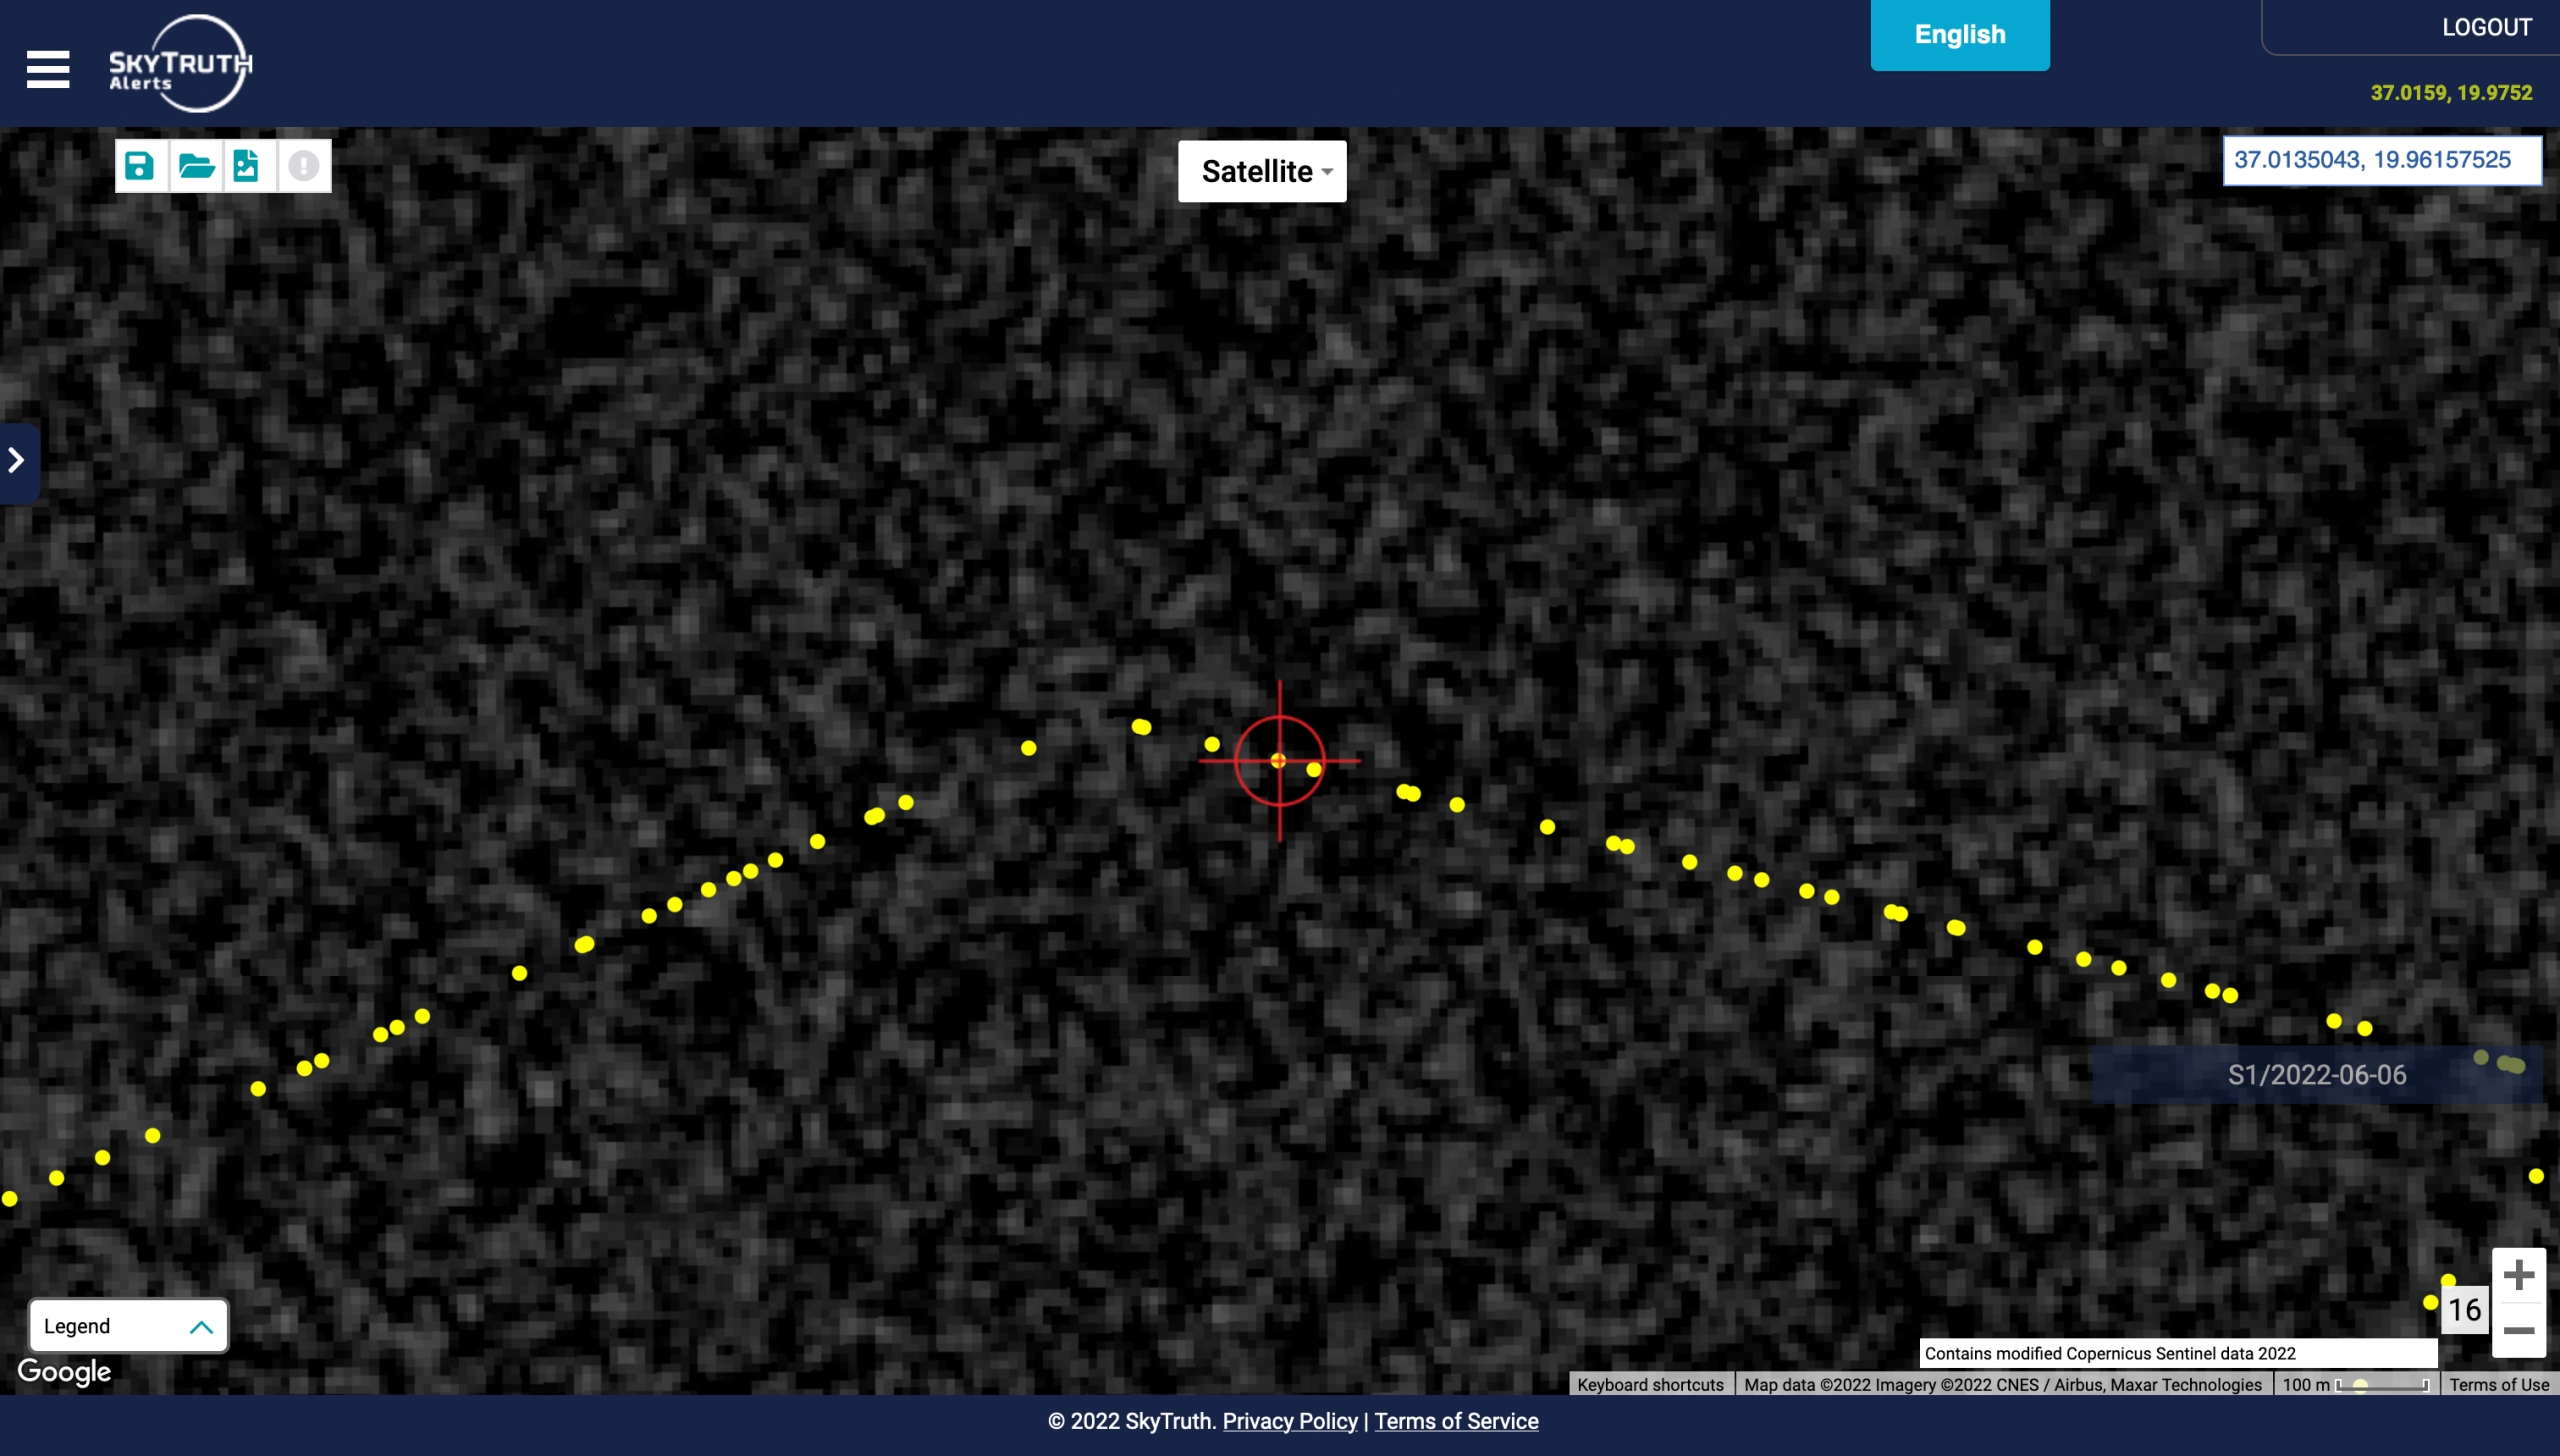
The KAPITAN SCHEMILKIN appears as expected on a Sentinel-1 (S1) radar image from May 27, 2022.
The red crosshairs are an estimated location of the vessel at the exact time of the S1 acquisition based on the AIS track.
AIS track positions are shown as yellow dots as the vessel transits southeast in the Aegean Sea.
On the radar image the tanker appears as the white oblong object beside the red crosshairs.
The slight perpendicular offset of the vessel compared to the AIS positions (making the vessel appear alongside, but not directly under, the AIS track) is a known doppler shift effect.
Link to imagery
 

On a S1 image from June 6, 2022 (at a similar scale as the image from May 27th) the tanker does not appear at the location indicated by its AIS broadcast (red crosshairs).
A vessel of this size (138m) is detected with more than 95% probability.
Link to Imagery


Looking in more detail at the broadcast AIS track around these periods, we can see precisely when the vessel begins to broadcast false positions, based on several broadcast characteristics not consistent with transmission of real AIS positions.

We assess that false AIS positions were broadcast during the time ranges below:


In both cases, the vessel broadcast positions showing a transit to an area of Greek waters where the vessel can then be seen making irregular circles at low speed.
Circling patterns have been previously documented with false AIS tracks; however, whoever was responsible for this track made some efforts to make it look realistic.
For example, the circles do not exactly repeat and there is greater variation in speed.

Evidence for real vessel locations

1. Satellite reception footprints.

We can roughly estimate a vessel’s true location based on the intersection of the reception footprints of the satellites picking up the AIS positions.
Analyses of the receiving satellite locations during the May 28–July 12 spoofing period showed that the vessel was further west in the Mediterranean than indicated by AIS.


The intersection area of satellite reception footprints (shaded red) during the false broadcast period on the west coast of Greece (May 29–July 12, 2022) shows that the tanker’s true location had to be further west in the Mediterranean, within the area of possible satellite reception.
Broadcast AIS positions are shown as red arrowheads.
Green circles mark locations where the vessel appears as expected on Sentinel-1 imagery, indicating a real transit through the Aegean Sea earlier in May.
Credit: Spire/Global Fishing Watch


2. Locations of vessels of similar size not matched to an AIS broadcast.
 
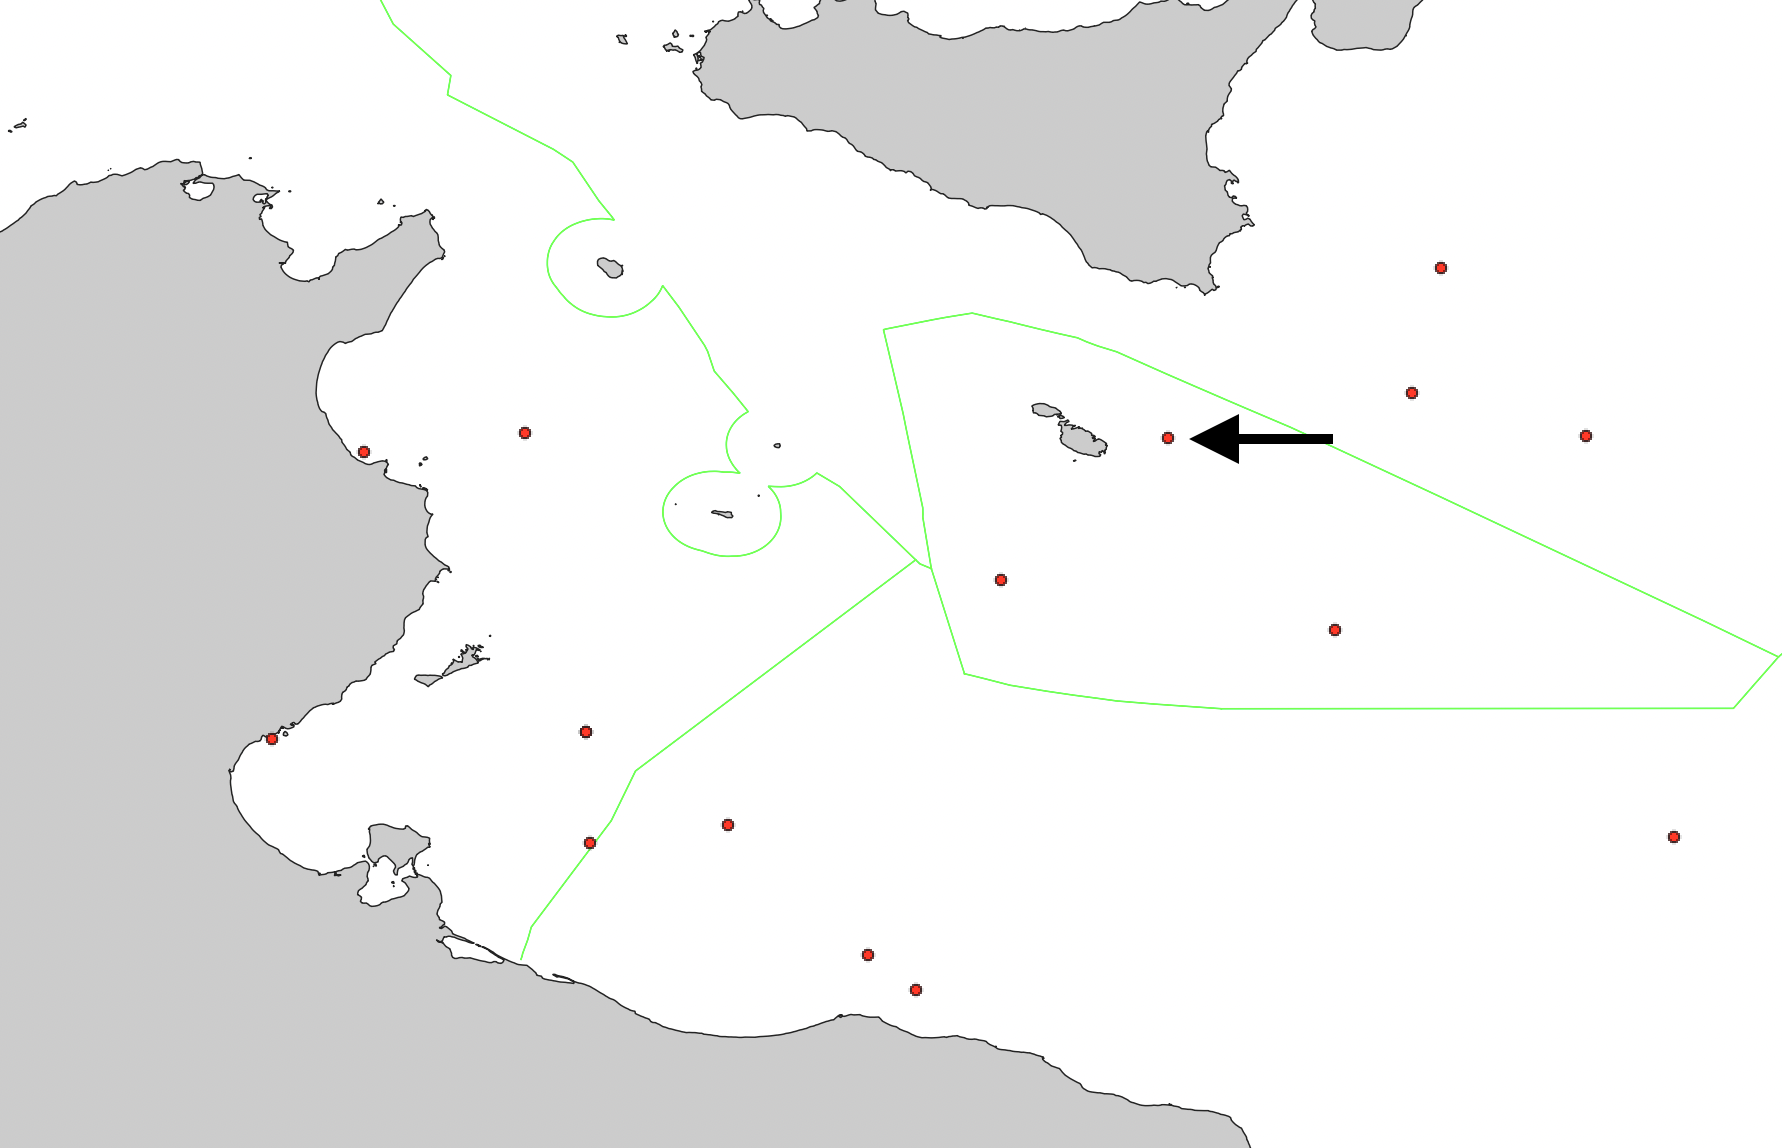
A query of the GFW database for vessels of similar size—which were detected by Sentinel-1 but were not broadcasting AIS—identified 17 vessel detections in this region during the time range of the false positions.
By reviewing the locations individually and checking optical imagery from Planet, we discovered one case of a vessel matching the characteristics of the KAPITAN SCHEMILKIN east of Malta.

However, it would be speculative to confirm the ship’s identity and locations based solely on the measured vessel length and visual characteristics apparent on Planet imagery.


Results from a query of vessels visible on Sentinel-1 (S1) that are similar in size to the KAPITAN SCHEMILKIN but not matched to an AIS broadcast at the same location.
Red dots show locations from S1.
The arrow marks a detection that corresponds with a Planet image, which shows a vessel matching the characteristics of the KAPITAN SCHEMILKIN.
Data was queried for May 28–July 12, 2022, which corresponds with the period of false broadcast positions.
Credit: Spire/Global Fishing Watch


A Planet image from June 23, 2022 matched with the Sentinel-1 detection at the anchorage site west of Malta.
A vessel similar in size and color to the KAPITAN SCHEMILKIN is seen at this location.
This vessel appeared to remain near this anchorage site between June 8–July 9, 2022.


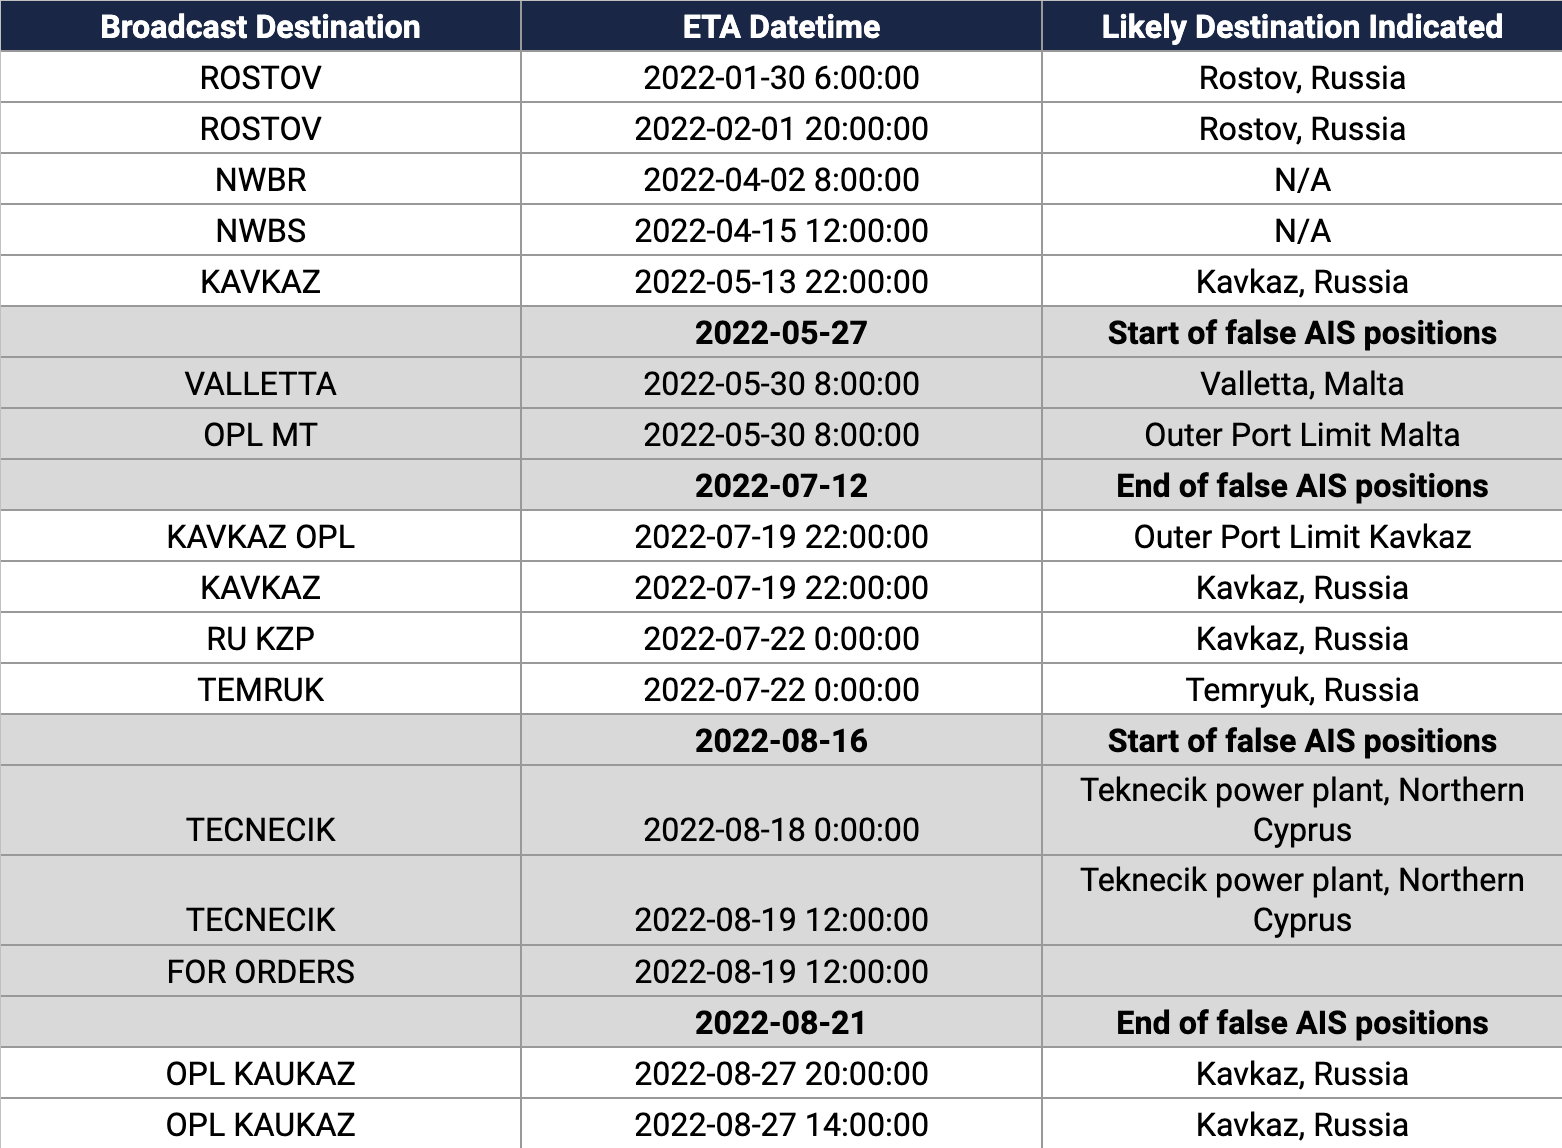
Table 2: The KAPITAN SCHEMILKIN continued to update the destination and ETA fields in the AIS broadcast, apparently accurately, despite the periods of position falsification (highlighted in gray).
This helped to locate and confirm the true locations of the vessel.
View more


3. Broadcast destinations and ETAs from AIS.

Surprisingly, as the vessel broadcast false coordinate positions, they continued to update the destination and ETA fields of their AIS broadcast with accurate information.
For example, while broadcasting circling positions southwest of Greece the tanker updated its destination to Valletta (capital of Malta) and then Outer Port Limits Malta (OPL MT) with an ETA of 5300800 (May 30 at 8:00 UTC).
We identified a vessel matching the tanker’s characteristics on Planet imagery at an anchorage site west of Malta between June 8–July 9, 2022.
The likely location of the tanker earlier in June has not yet been determined.
It is possible they anchored elsewhere or went to a dock somewhere in Malta.

Similarly, later in August while the vessel was broadcasting circling positions east of Crete, someone on the tanker updated its destination to TECNECIK with an ETA of 8180000 and then 8191200 (Aug 19, 2022 at 12:00 UTC).
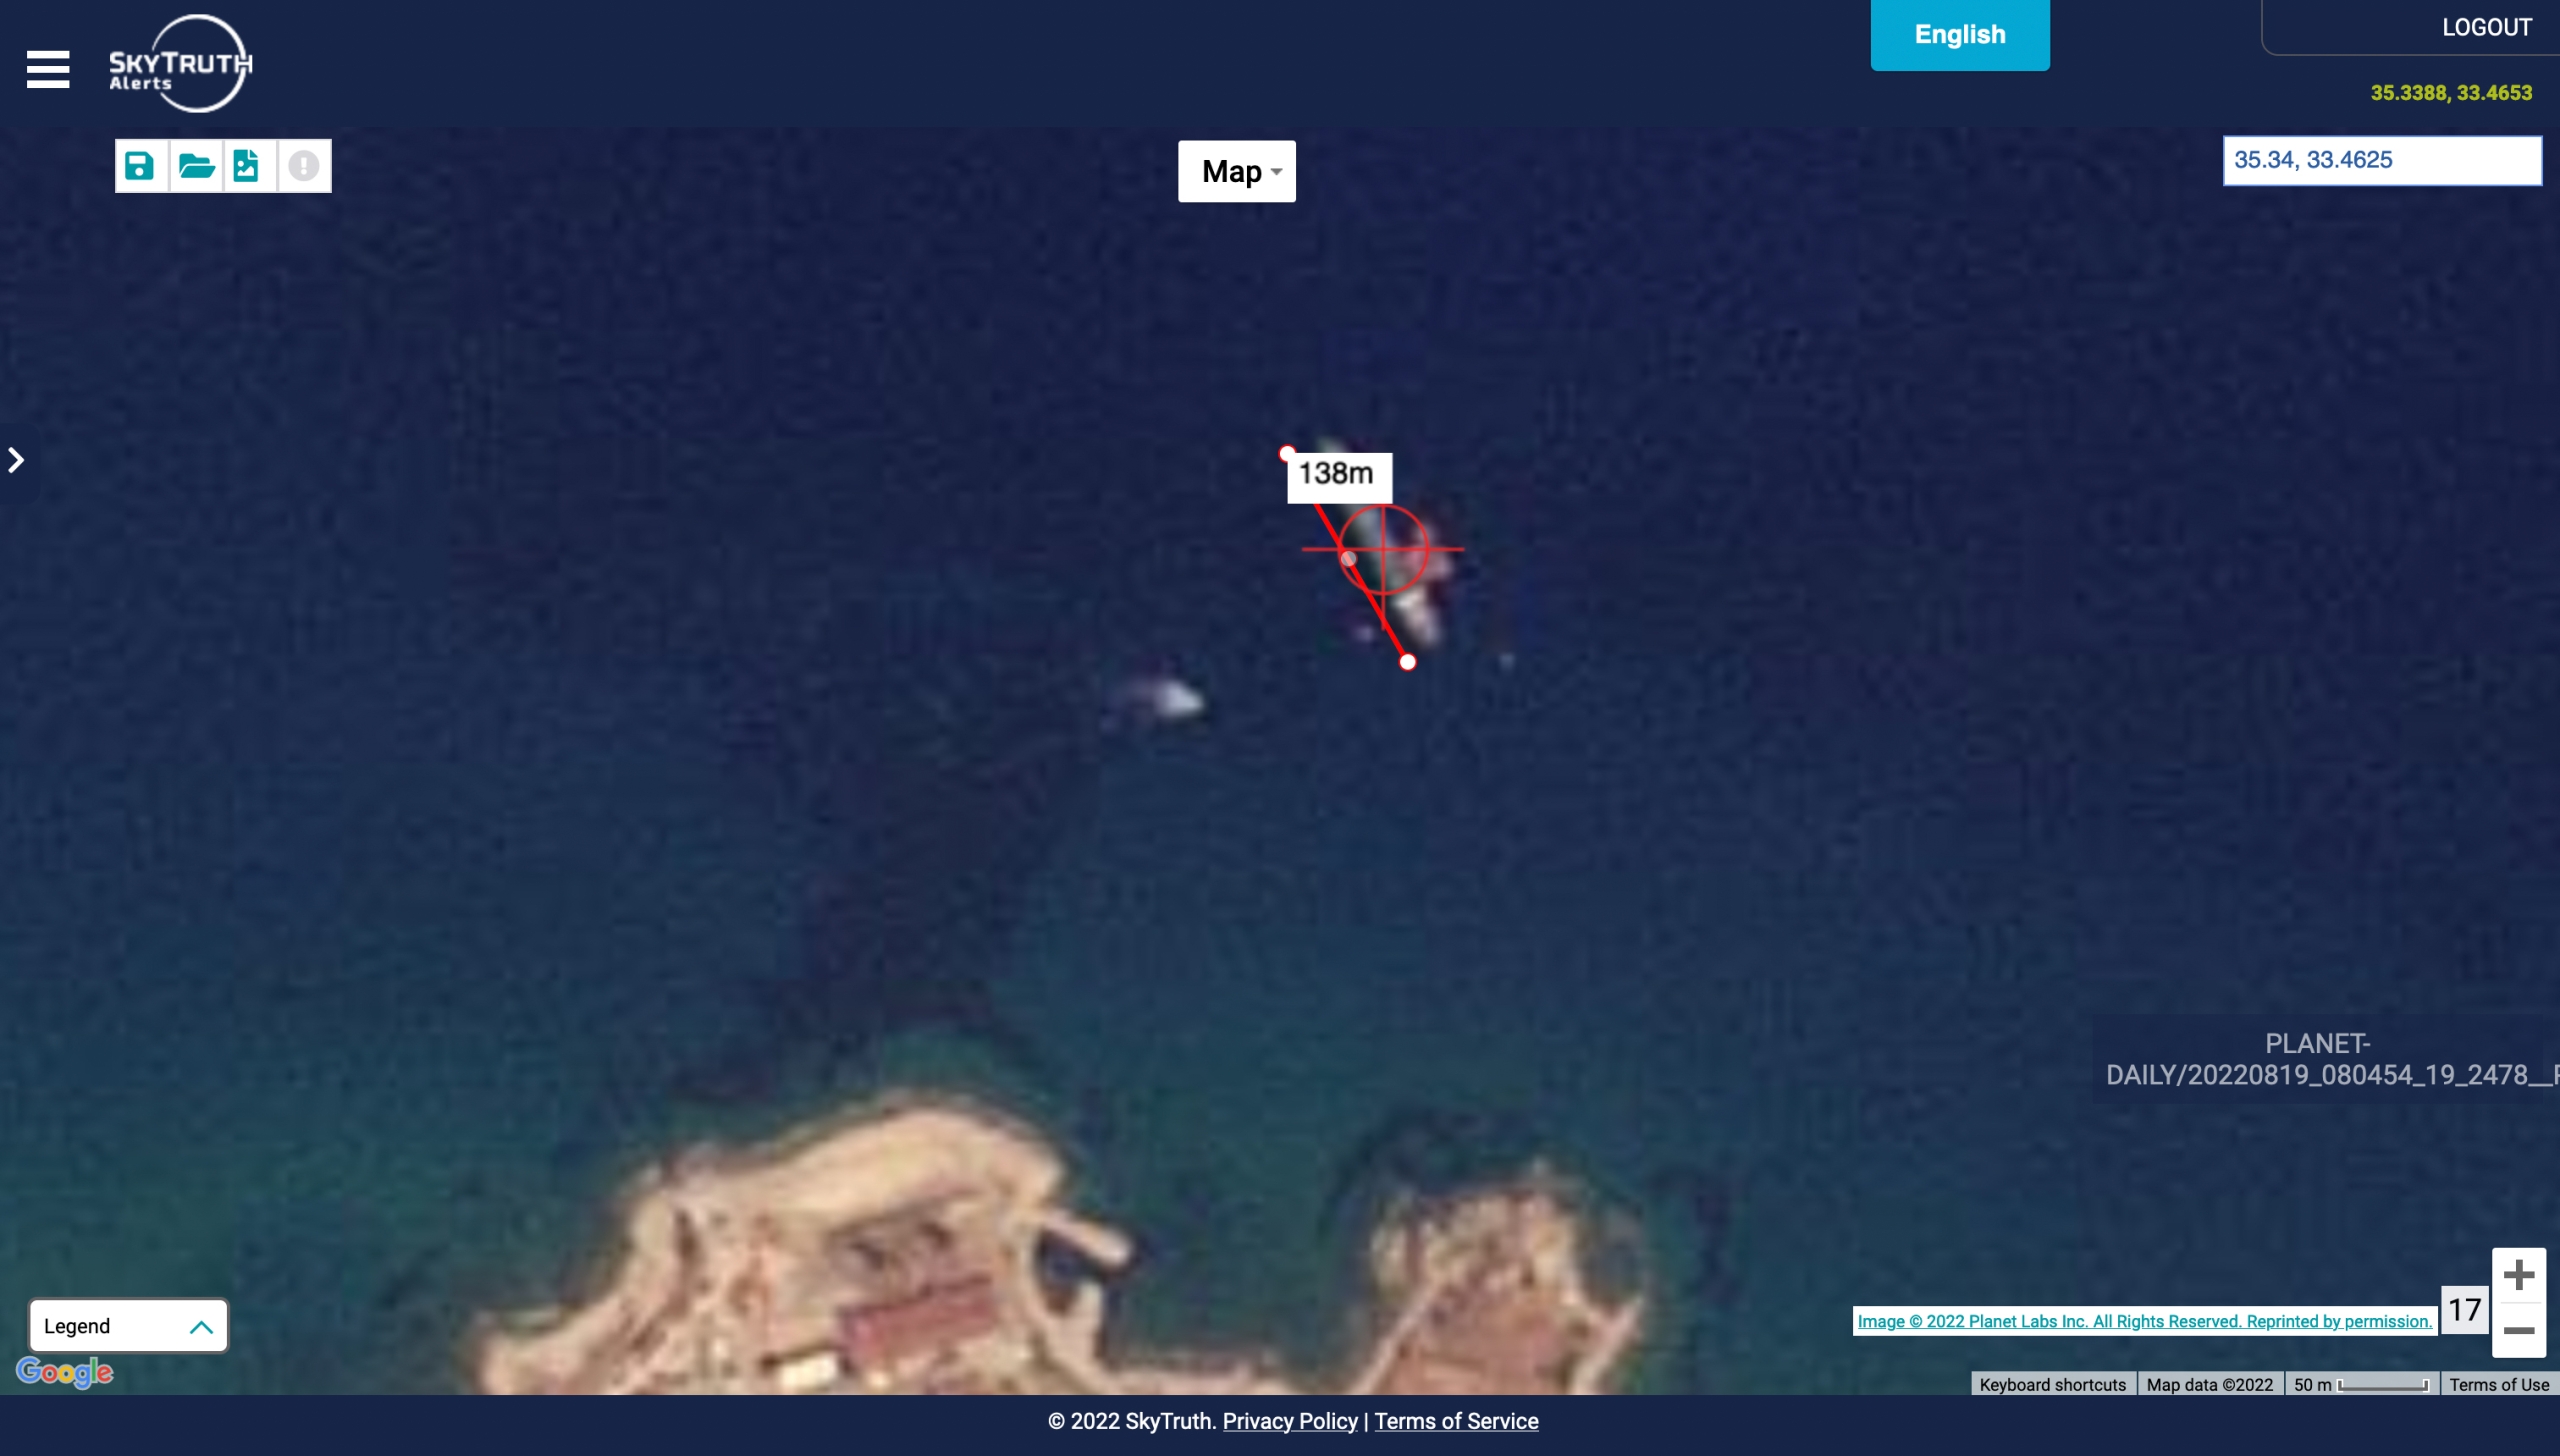
A vessel matching the characteristics of the tanker can be seen at the Teknecik power plant in Northern Cyprus on August 19 and 20.

We were surprised that the vessel would both be broadcasting false coordinate positions and updating a destination field that apparently gave away its real location.
It is possible that different crew members—who were not in communication—took these steps separately.
 
 
The KAPITAN SCHEMILKIN appears at the mooring site for the Teknecik power plant on August 19, 2022.
This is likely shortly after the vessel arrived.
A tug (SONDUREN 10) appears beside the tanker and can be identified with AIS.
 
 
High-resolution imagery from Maxar shows more details of this mooring position with a tanker at this location in 2020.
Note the two fixed positions that the tanker is tied up to which are also faintly visible in the Planet image.
This is an established location for offshore fuel delivery and not just an anchorage.


Likely real vessel positions, based on Planet imagery during the times when the tanker broadcast false positions, are listed below.
Planet imagery alone does not provide enough detail to definitively identify the vessel; however, the tanker’s own broadcast destinations—coupled with the fact that the vessel appearing on imagery was not associated with an AIS broadcast (at least not one at the position where the vessel appears)—supports the conclusion that these were the real locations of the KAPITAN SCHEMILKIN.
 

Table 3: Likely real positions of KAPITAN SCHEMILKIN based on satellite imagery and the vessel’s self reported destinations.
View more


The false location data broadcast by the KAPITAN SCHEMILKIN shows the critical importance of developing robust automated systems for detecting and flagging the deceptive use of AIS.
As the world reacts with horror to the war in Ukraine, governments have taken decisive action to try and limit the sale of crude oil financing the war.
However, these measures will be ineffective if AIS falsification goes undetected.

Fortunately, we have demonstrated that false positions can be readily detected with data methods currently available.
We hope that increased automation of these methods will soon mean that any vessel falsifying their position will only end up shining a spotlight on their illegal activity.

Links :