Monday, November 26, 2012

Rising seas, vanishing coastlines


From NYTimes

THE oceans have risen and fallen throughout Earth’s history, following the planet’s natural temperature cycles.
Twenty thousand years ago, what is now New York City was at the edge of a giant ice sheet, and the sea was roughly 400 feet lower.
But as the last ice age thawed, the sea rose to where it is today.


Now we are in a new warming phase, and the oceans are rising again after thousands of years of stability.
As scientists who study sea level change and storm surge, we fear that Hurricane Sandy gave only a modest preview of the dangers to come, as we continue to power our global economy by burning fuels that pollute the air with heat-trapping gases

Map of New York City if sea levels rise 3 meters (areas underwater are in light blue).
The map was published in 2007 in a report warning about the dangers of unabated climate change and sea level rise.
The picture resembles superstorm Sandy's impact on Lower Manhattan.
Image courtesy of Architecture 2030

This past summer, a disconcerting new scientific study by the climate scientist Michiel Schaeffer and colleagues — published in the journal Nature Climate Change — suggested that no matter how quickly we cut this pollution, we are unlikely to keep the seas from climbing less than five feet.
More than six million Americans live on land less than five feet above the local high tide. (Searchable maps and analyses are available at SurgingSeas.org for every low-lying coastal community in the contiguous United States.)
Worse, rising seas raise the launching pad for storm surge, the thick wall of water that the wind can drive ahead of a storm. In a world with oceans that are five feet higher, our calculations show that New York City would average one flood as high as Hurricane Sandy’s about every 15 years, even without accounting for the stronger storms and bigger surges that are likely to result from warming.
Floods reaching five feet above the current high tide line will become increasingly common along the nation’s coastlines well before the seas climb by five feet.
Over the last century, the nearly eight-inch rise of the world’s seas has already doubled the chance of “once in a century” floods for many seaside communities.


We hope that with enough time, most of our great coastal cities and regions will be able to prepare for a five-foot increase.
Some will not.
Barriers that might work in Manhattan would be futile in South Florida, where water would pass underneath them by pushing through porous bedrock.

According to Dr. Schaeffer’s study, immediate and extreme pollution cuts — measures well beyond any discussion now under way — could limit sea level rise to five feet over 300 years.
If we stay on our current path, the oceans could rise five feet by the first half of next century, then continue rising even faster.
If instead we make moderate shifts in energy and industry — using the kinds of targets that nations have contemplated in international talks but have failed to pursue — sea level could still climb past 12 feet just after 2300.
It is hard to imagine what measures might allow many of our great coastal cities to survive a 12-foot increase.
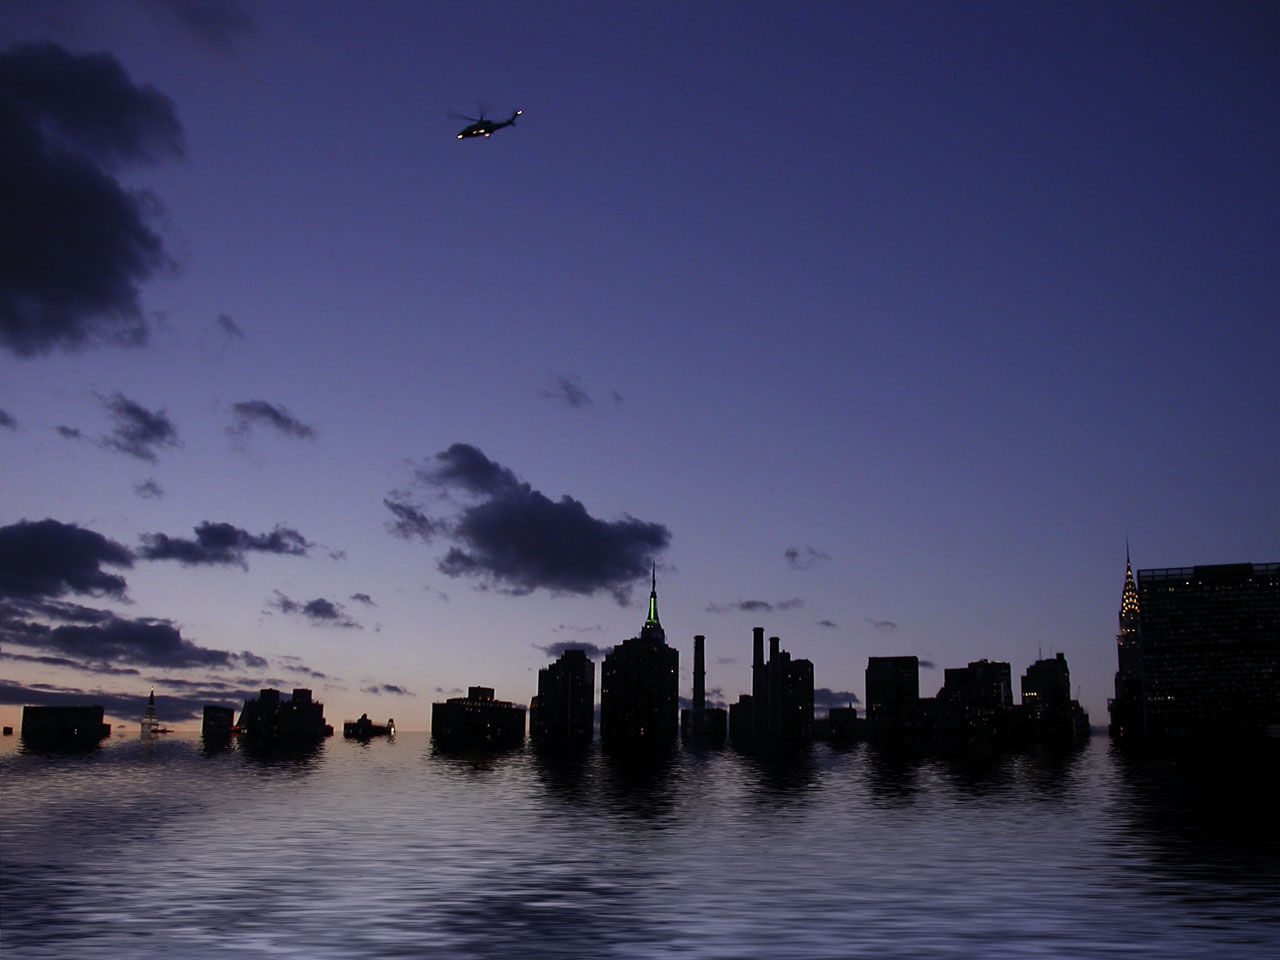

WE might find comfort in the fact that this is just one set of projections, and projections are notoriously tough to get right.
But a second study that also came out this past summer erases any such comfort.
Led by the geochemist Andrea Dutton and published in the journal Science, the second paper uses deep history, not model projections, for clues to the future.
About 125,000 years ago, before the last ice age, there was a warm period that lasted 10,000 to 15,000 years.
It was perhaps a little warmer than today, but cooler than the temperatures that climate scientists expect later in this century without sharp pollution cuts. Dr. Dutton’s research strongly reinforces a prior study led by one of us, which found that the warm-period sea levels rose roughly 20 to 30 feet higher than those of today.
We just don’t have a clear picture of how fast that could happen again.
Any sea level forecast must be interpreted carefully: things could be better, or worse.

 Homes in Tuckerton, N.J., after Hurricane Sandy.
U.S. Coast Guard/Getty Images

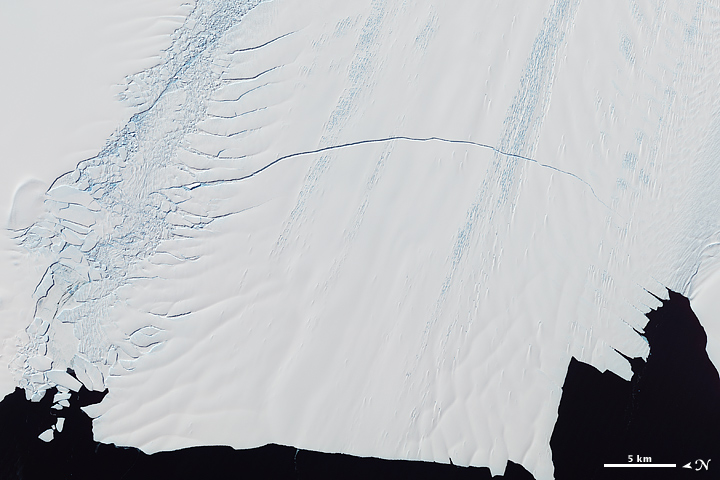
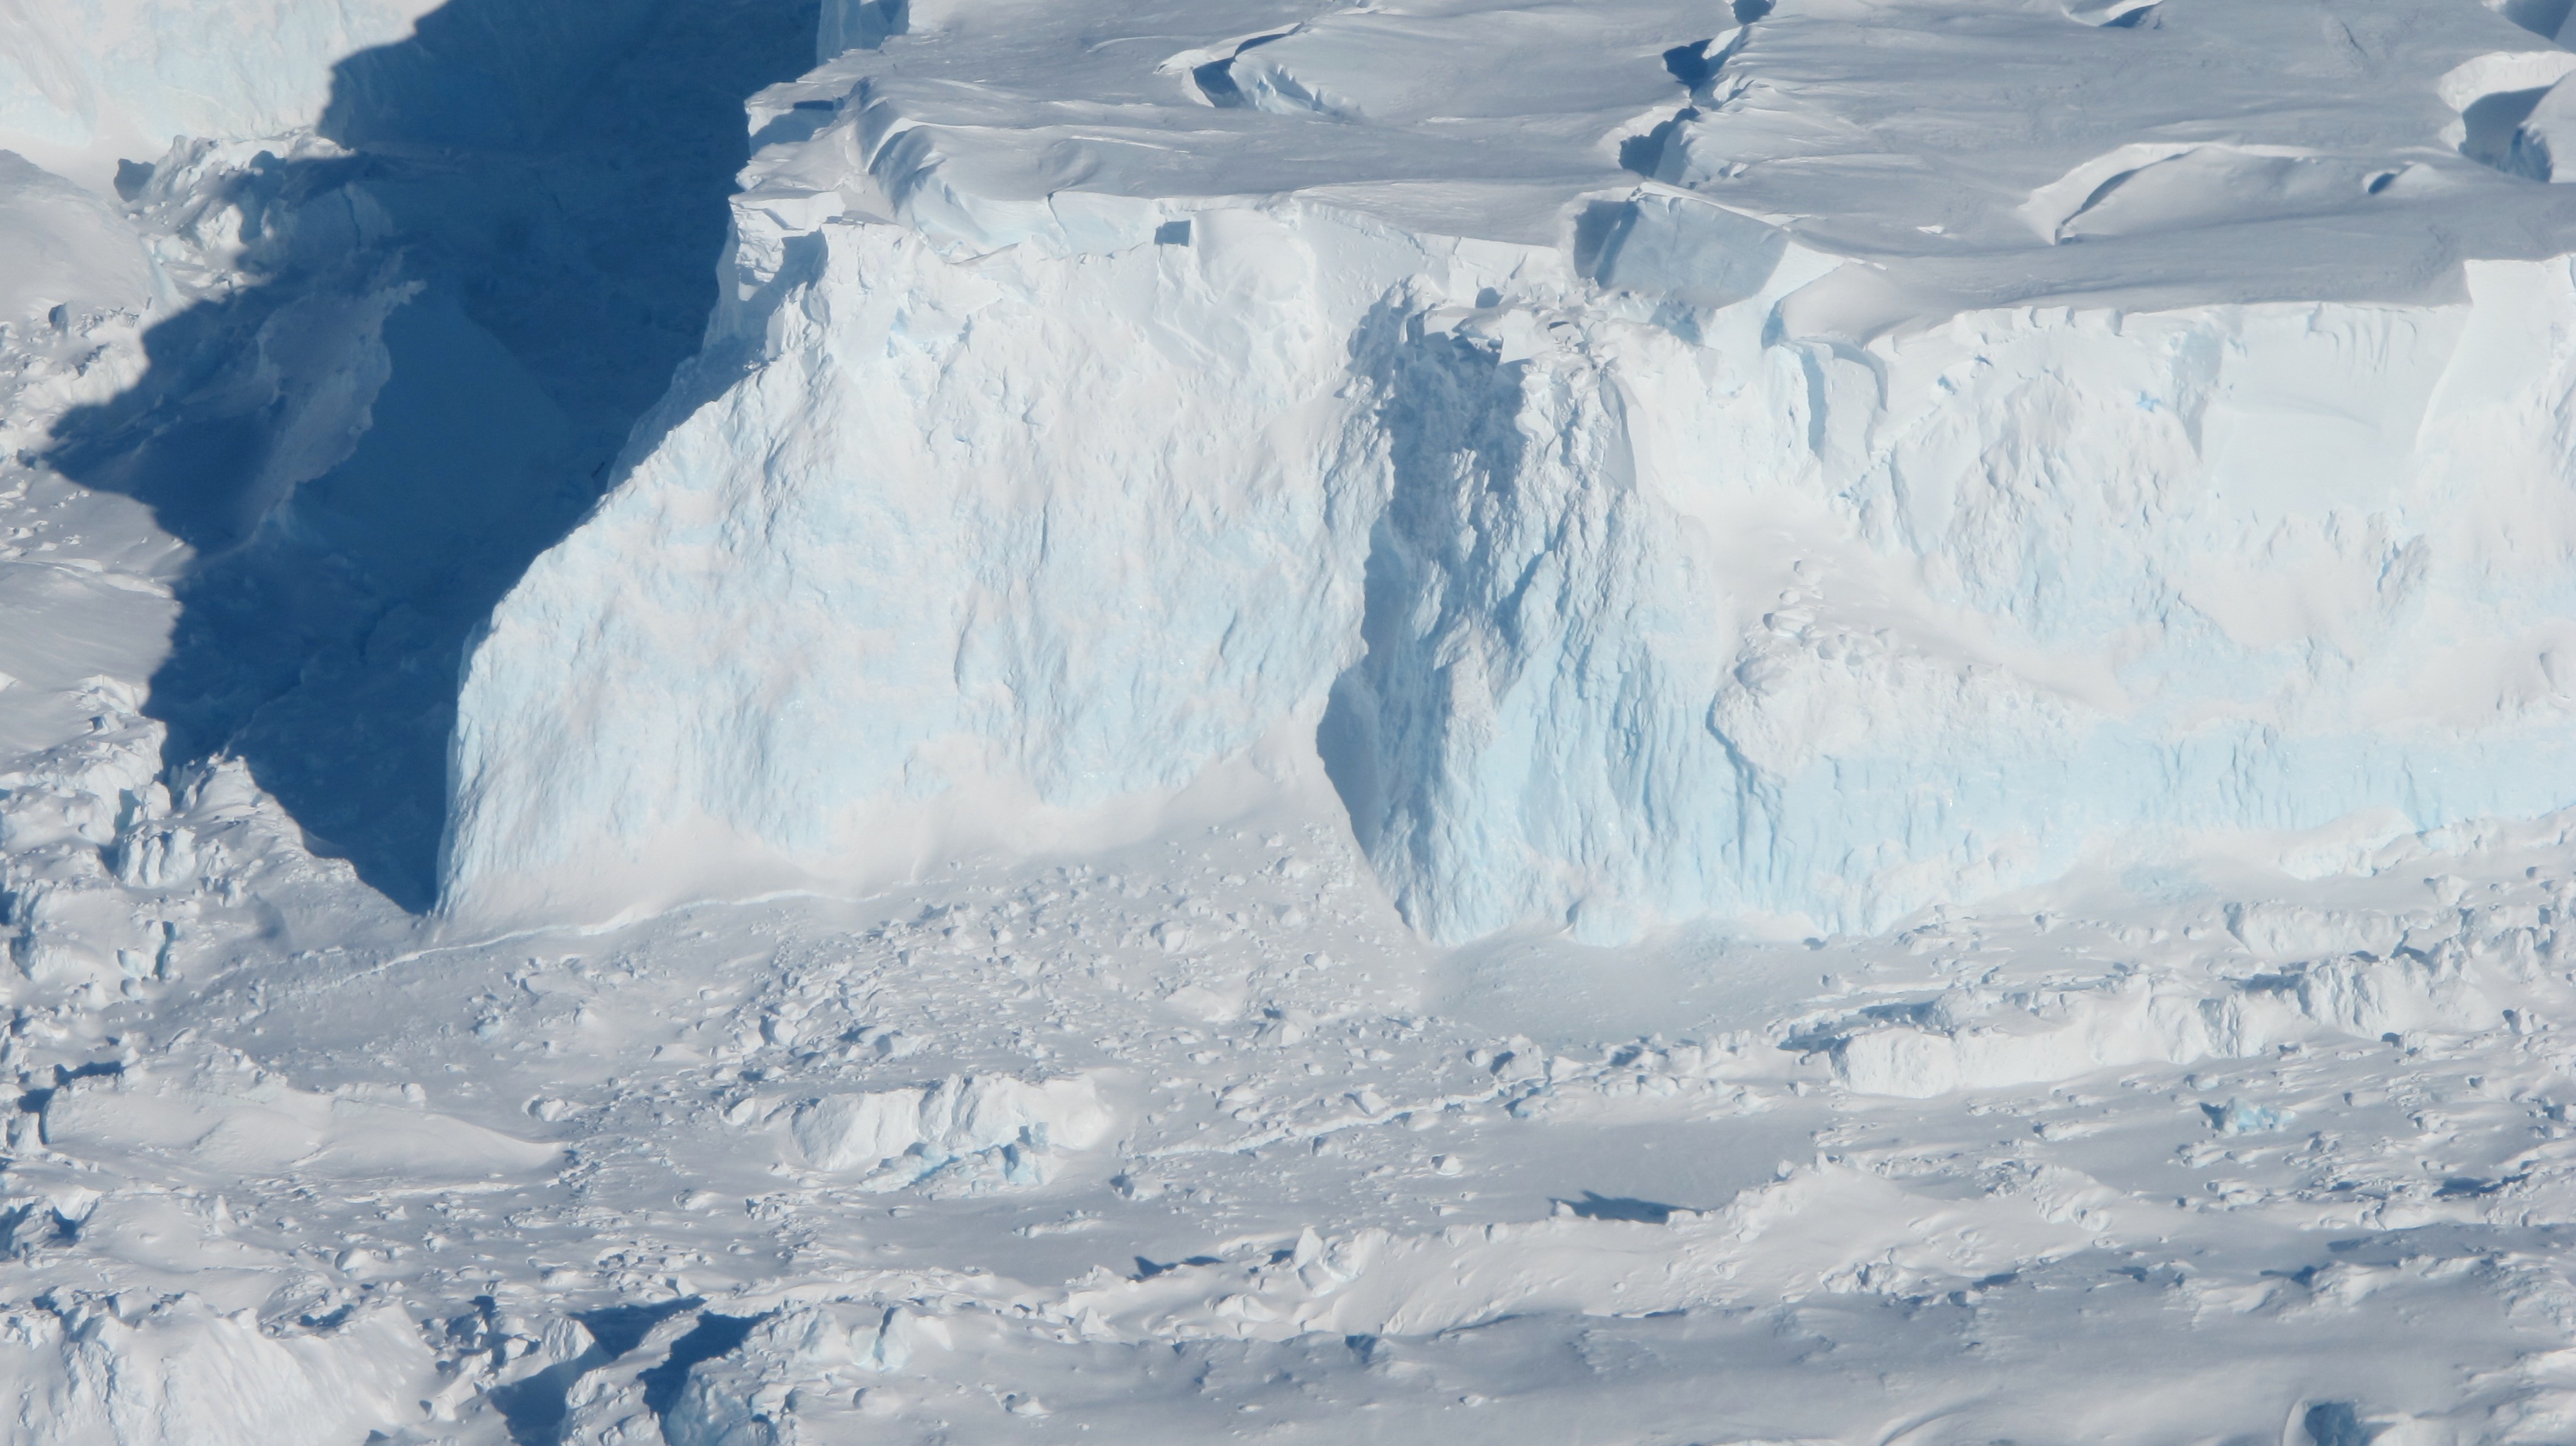
The Schaeffer study uses the relationship between global temperature and sea level over the past 1,000 years — when it was cool, and the great ice sheets were generally stable — to extrapolate over the next 300 years — when it will be hot, and the ice sheets in Greenland and Antarctica may behave differently. Other scientific teams have tried the notoriously difficult task of forecasting ice sheet decay in physical detail, and this has tended to produce slower estimates of sea level rise than the Schaeffer team’s method.
But any projection is compromised by the fact that we are sending heat-trapping carbon dioxide into the atmosphere far faster than anything the planet has seen for at least 55 million years.

The Dutton study comes with caveats, too. Earth’s orbit was different during the last warm period, bringing more sunshine to the Arctic and complicating the analogy with today.
But today we are on a path to a planet that will be much hotter than it was in the period Dr. Dutton studied.

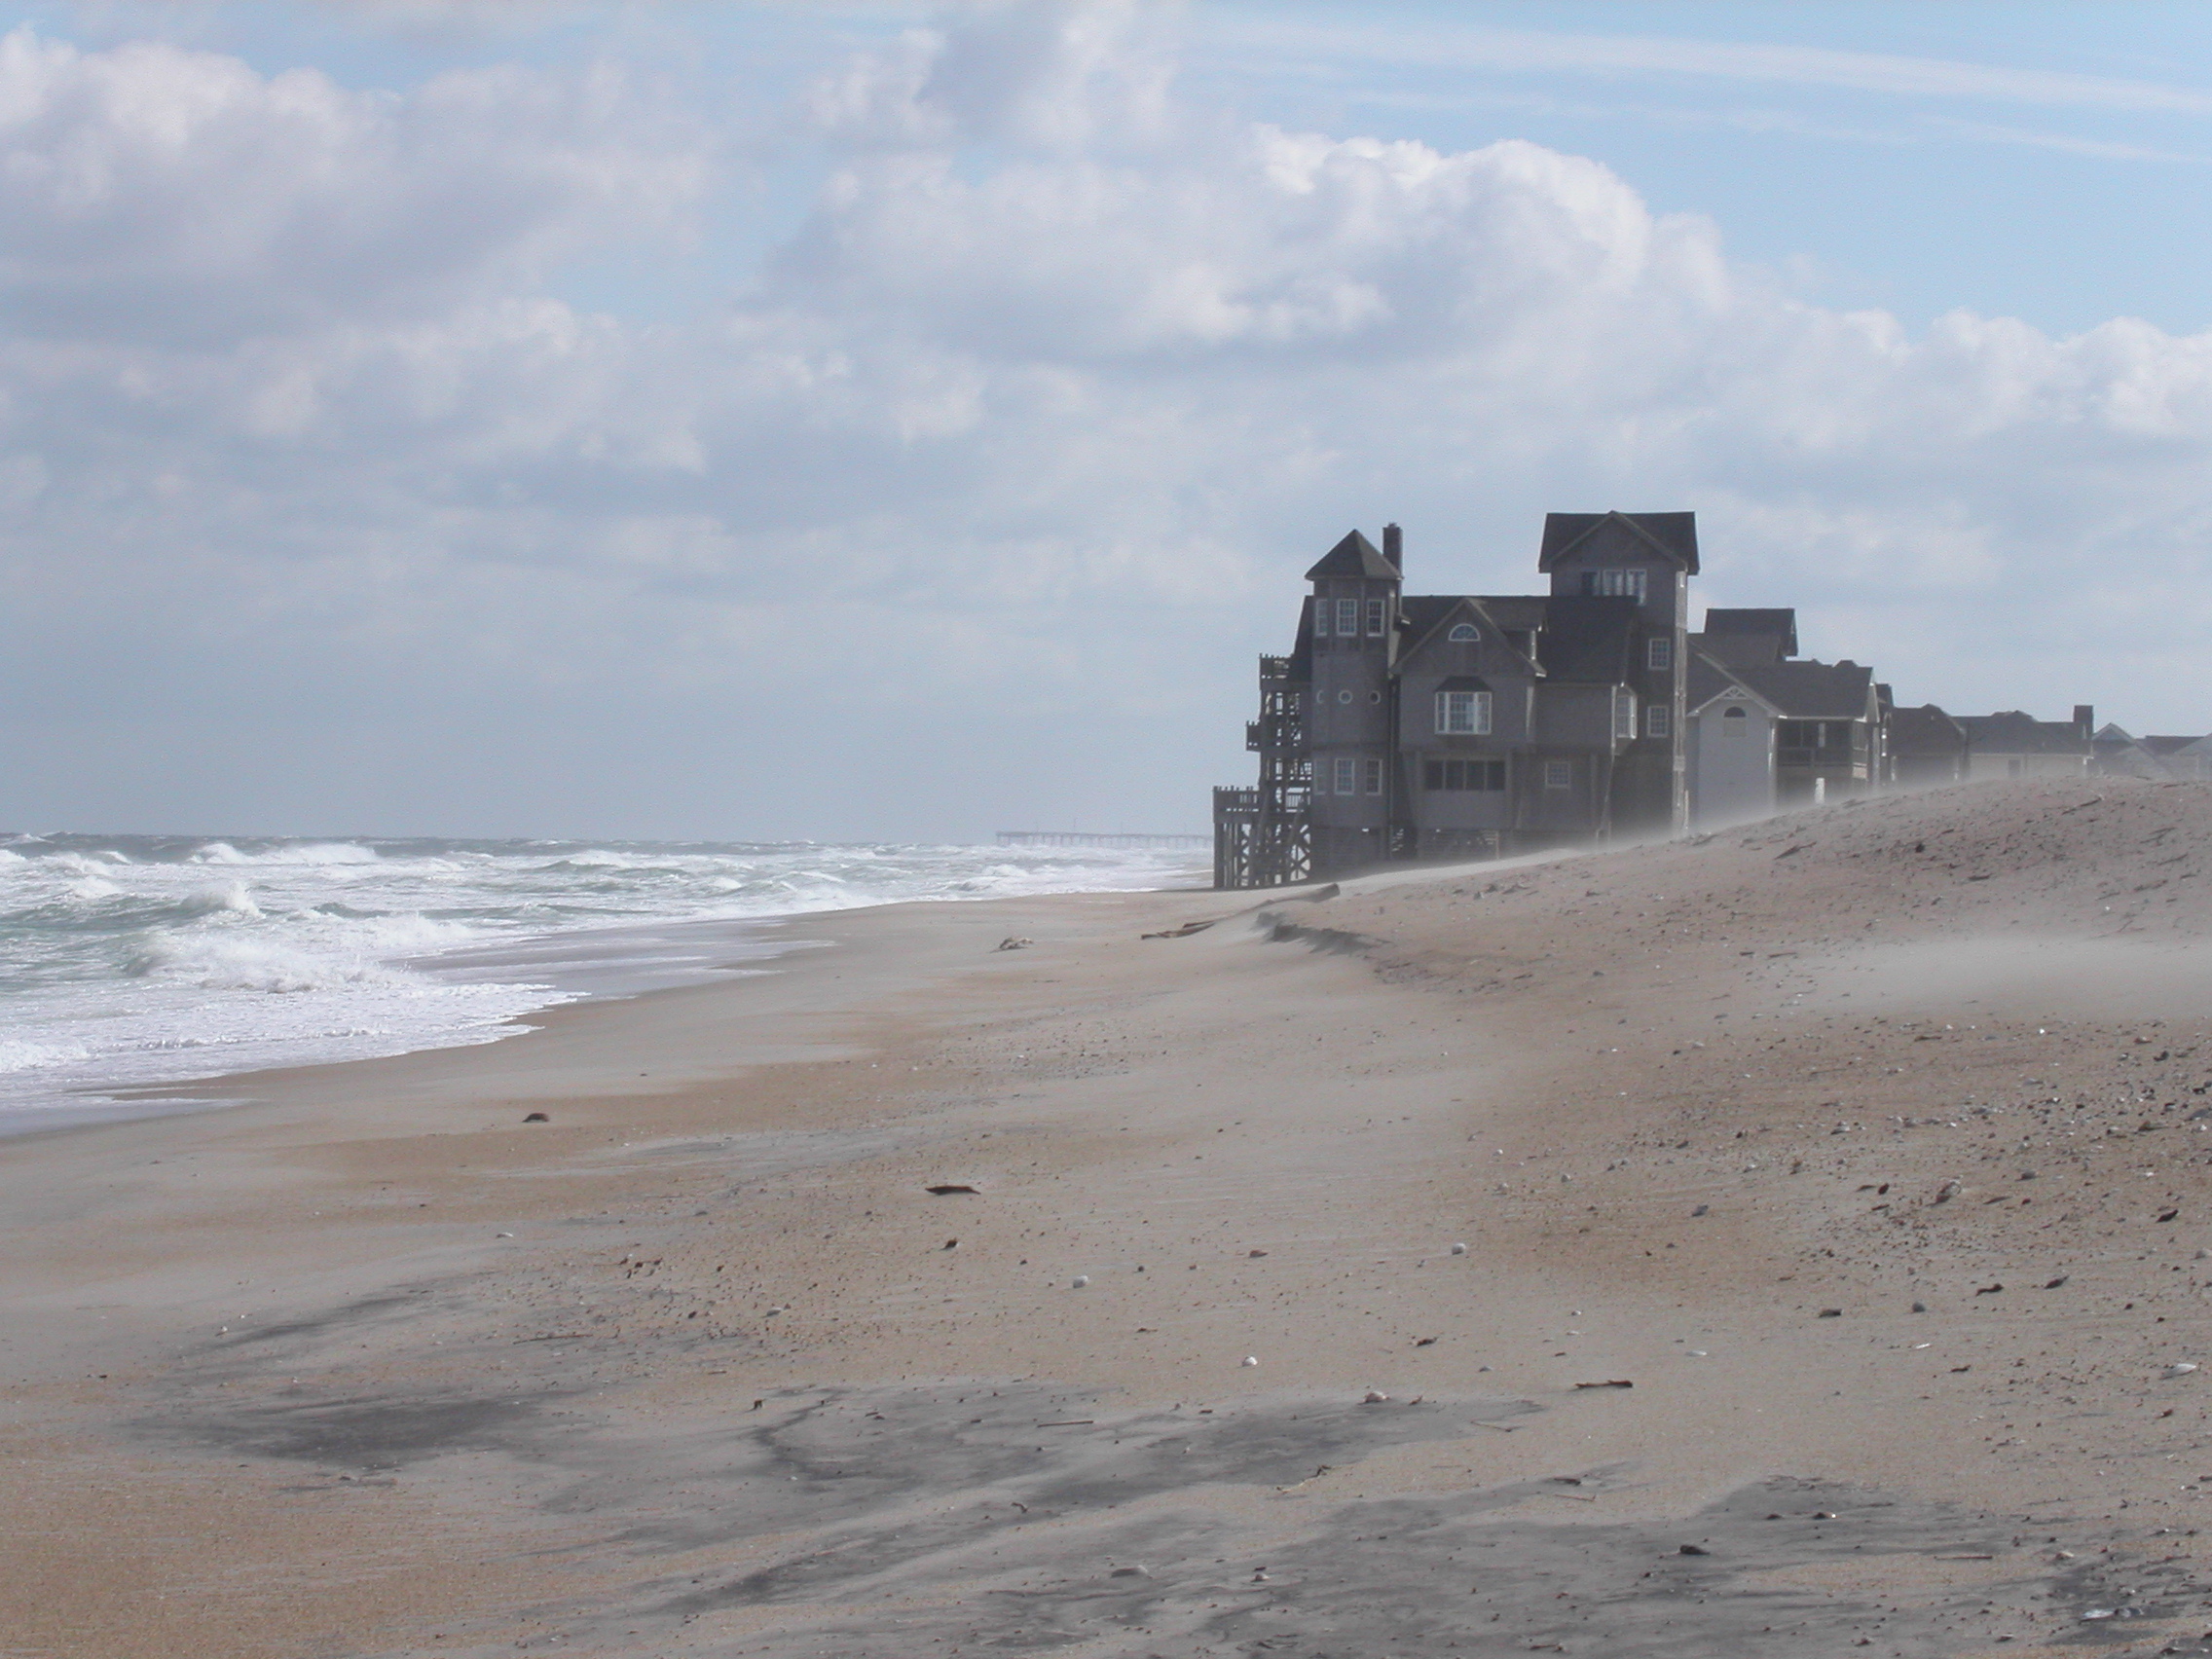
Beach house in Rodanthe, North Carolina
 photo Andrew Kemp

There are two basic ways to protect ourselves from sea level rise: reduce it by cutting pollution, or prepare for it by defense and retreat.
To do the job, we must do both.
We have lost our chance for complete prevention; and preparation alone, without slowing emissions, would — sooner or later — turn our coastal cities into so many Atlantises. 


Benjamin Strauss is the chief operating officer and director of the program on sea level rise at Climate Central, a research group.
Robert Kopp is an assistant professor of earth and planetary sciences at Rutgers University and associate director of the Rutgers Energy Institute.

Links :

Sunday, November 25, 2012

J Class Shamrock V sailing in Croatia


The beautiful 1930 sailing yacht Shamrock V in action in the Ionian and Adriatic seas.
Shot and edited by crew member Graham Capell, Co edited by his wife and crew mate Kristin Capell.

Saturday, November 24, 2012

NASA Operation Ice Bridge : High and Low over the Rift

This year Operation IceBridge has returned twice to the Pine Island Glacier, the site of a massive glacial crack poised to potentially create an iceberg the size of New York City.
Operation IceBridge returned to the Pine Island Glacier twice in 2012, and NASA glaciologist Kelly Brunt discusses the implications of the glacier's impending calving event.

PIG Calving Front Free of Sea Ice (acquired October 26, 2012) 
As spring clears out sea ice from Pine Island Bay,
the birth of a massive new iceberg may be more likely.

Crack in the Pine Island Glacier (acquired November 13, 2011)

A Block of Thwaites (acquired October 16, 2012)


With its protective sea ice barrier melted away, Antarctica's Pine Island Glacier grows ever closer to finally dropping its New York City-sized iceberg into the ocean, according to NASA.
The giant crack in Pine Island Glacier was first spotted by scientists with NASA's IceBridge mission in 2011 as they surveyed the massive ice shelf in their specially equipped DC-8 plane.
A second rift also formed and joined the northern side of the crack in May 2012, as captured on satellite images that track the incipient iceberg.

When IceBridge scientists returned this month, they discovered the original rift now has only about half a mile (less than 1 kilometer) to go before the 300-square-mile (770 square kilometers) berg forms.
The calving front of Pine Island Glacier is also free of sea ice, as shown in an Oct. 26 image from the Landsat 7 satellite.
Warm spring temperatures are melting the sea ice that rings the continent during the winter, and winds help push the remaining ice out to sea.
Sea ice acts as a buttress against waves, protecting the front of the glacier from calving, Kelly Brunt, a cryosphere scientist at NASA Goddard Space Flight Center, said in a NASA video about the Pine Island Glacier rift.
"So the fact that there's no sea ice in front of the Pine Island Glacier right now implies that it might be in a state that's sort of primed to calve," she said.

Links :

Friday, November 23, 2012

Image of the week : cloud streets over the Hudson Bay

NASA acquired November 13, 2012
>>> geolocalization with the Marine GeoGarage <<<

On November 13, 2012, the Moderate Resolution Imaging Spectroradiometer (MODIS) on NASA’s Terra satellite captured this view of cloud streets amidst northwesterly winds over Hudson Bay.

Cloud streets—long parallel bands of cumulus clouds—form when cold air blows over warmer waters, while a warmer air layer (or temperature inversion) rests over the top of both.
The comparatively warm water gives up heat and moisture to the cold air above, and columns of heated air called thermals naturally rise through the atmosphere.

The temperature inversion acts like a lid.
When the rising thermals hit it, they roll over and loop back on themselves, creating parallel cylinders of rotating air.
As this happens, the moisture in the warm air cools and condenses into flat-bottomed, fluffy-topped cumulus clouds that line up parallel to the prevailing wind.

Cloud streets can stretch for hundreds of kilometers if the land or water surface underneath is uniform.
Sea surface temperature need to be at least 21°C to 22°C degrees (39°F to 41°F) warmer than the air for cloud streets to form.

Thursday, November 22, 2012

South Pacific Sandy Island 'proven not to exist'

 Sandy ghost island with 2008 SHOM nautical map (7321/INT636)

SHOM ENC
overlayed on Google Maps with transparency
>>> geolocalization with the Marine GeoGarage <<<

 From BBC

Sandy island undiscovered

A South Pacific island, shown on marine charts and world maps as well as on Google Earth, does not exist, Australian scientists say.

Google Earth view
but also found in satellite imagery view of Nokia Maps or map view of Bing Maps 
using NASA Blue Marble imagery

The supposedly sizeable strip of land, named Sandy Island on Google Maps, was positioned midway between Australia and French-governed New Caledonia.

Neither the French government - the invisible island would sit within French territorial waters if it existed - nor the ship's nautical charts, which are based on depth measurements, had the island marked on their maps.
>>> geolocalization with the Marine GeoGarage <<< 

 extract of chart 5978 from SHOM (French Hydrographic Office)
no 'île Sable' in 1982 

 Nouvelle Calédonie SHOM ENC official vector chart FR273210 (scale : 1:1,500,000)
(other view with depths in meters)
no 'île Sable' in 2012 update

But when scientists from the University of Sydney went to the area, they found only the blue ocean of the Coral Sea.
The phantom island has featured in publications for at least a decade.


Scientist Maria Seton, who was on the ship, said that the team was expecting land, not 1,400m (4,620ft) of deep ocean.
"We wanted to check it out because the navigation charts on board the ship showed a water depth of 1,400m in that area - very deep," Dr Seton, from the University of Sydney, told the AFP news agency after the 25-day voyage.
"It's on Google Earth and other maps so we went to check and there was no island. We're really puzzled. It's quite bizarre.
"How did it find its way onto the maps? We just don't know, but we plan to follow up and find out."

Atlas map : Australian, N.Z. ports (British map 1922) 
(David Rumsey Historical Map Collection)
with 'Sandy island' indication

 Soviet Union atlas map (1967)
(David Rumsey collection)
with shoal indication instead of fictional 'Sandy island'

see other ancient maps from Rumsey collection on :
Maps of Sandy Island Through History
the non-existent "Sandy Island" has been drawn (or not) in some maps since the 1770's,
so long before the arrival of satellite imagery

Karte von Australien oder Polynesien, nach den Zeichnungen Reisebeschreibungen und Tagebücher der vorzüglichsten Seefahrer bis 1789 entworffen im Jahr 1792 (Gallica BNF)
(note : the existence of another 'Sandy island' in the North of New Caledonia island) 

NGA chart 56 Great circle sailing chart of the North Pacific Ocean
(edition sept 1973)
with shoal indication instead of fictional 'Sandy island'

 Ocean ArcGIS Basemap (ESRI) and also in Natural Earth II
with 'Sandy island'

New Caledonia and Vanuatu bathymetric and topographic map
with 'Ile de Sable' 
(also in GeoPortail overview)

 C-Map CM93/2 (2009) commercial vector map view on OpenCPN software
with 'Sandy island'

Navionics (2012) commercial vector map online view
with 'Sandy Island'

 Great Barrier Reef and Coral Sea bathymetry
in Google Earth (kmz) / e-Atlas
   with 'Sandy island'

Australian newspapers have reported that the invisible island would sit within French territorial waters if it existed - but does not feature on French government maps.

Sandy island from the GSHHS worldwide high-resolution shoreline data set (QGIS view)
Mike Prince, the director of charting services for the Australian Hydrographic Service, a department within the Navy that produces the country’s official nautical charts,
said the world coastline database incorporated individual reports that were sometimes old or contained errors.

 Sandy island in the VMAP-0 vector map file,
available from NGA
next version of widely used Digital Chart of the World (DCW)
also found in weather satellite picture (GOES NOAA)

 Global gravity (kmz) on Google Earth in the area of the supposed 'Sandy island'
(ref : Sandwell, D. T., and W. H. F. Smith,
Global marine gravity from retracked Geosat and ERS-1 altimetry)

Measured and estimated seafloor topography (STRM30+) kmz by Google Earth
(ref : Smith, W. H. F., and D. T. Sandwell, Global seafloor topography
from satellite altimetry and ship depth soundings)
which has been directly used by Google or GEBCO (General Bathymetric Chart of the Oceans)

Australia's Hydrographic Service, which produces the country's nautical charts, says its appearance on some scientific maps and Google Earth could just be the result of human error, repeated down the years.
A spokesman from the service told Australian newspapers that while some map makers intentionally include phantom streets to prevent copyright infringements, that was was not usually the case with nautical charts because it would reduce confidence in them.
Mike Prince, the director of charting services for the Australian Hydrographic Service, a department within the Navy, said that while some map-makers added non-existent streets in order to keep tabs on people stealing their data, that was not standard practice with nautical charts.
“[That would] reduce confidence in what is actually correct,” he said.

A spokesman for Google Earth said they consult a variety of authoritative sources when making their maps.
"The world is a constantly changing place, the spokesman told AFP, "and keeping on top of these changes is a never-ending endeavour'.'

 indication of 'Sandy island' (discovered by 'Velocity' whaling ship 1876 -photos-) on : 
Australia Coral Sea and Great Barrier Reefs
shewing the Inner and Outer routes to Torres Strait,
compiled chiefly from the Surveys of Captains Flinders, King, Blackwood, Stanley, Yule & Denham
RN 1802-60 with additions from Admiralty surveys in progress to 1888
Published at the Admiralty Decr. 19th 1860 under the Superintendence of Capt. Washington, R.N., F.R.S. Hydrographer

indication of 'Sandy island' on
(BNF Gallica)

ORSTOM bathymetry map 1979  (other bathy maps 1981 / 1987

 neither on Transas map

 neither on :
PlanetObserver Landsat satellite imagery (15m) (IGN GeoPortail view)
neither on :
http://explorateur-carto.georep.nc 
or http://carto.gouv.nc (on Google Earth : kmz)
with bathymetric data from SHOM multibeam echo-sounder surveys in 2008
(IRD 'Alis' ship with Simrad EM1002 and IFREMER 'Atalante' ship with Simrad EM12,
isobaths ZEE NC file -pdf map-
surveys tracks SHOM + IFREMER + IRD)

neither on :
Lansat satellite view on the area (or on Glovis USGS)

The BBC's Duncan Kennedy in Sydney says that while most explorers dream of discovering uncharted territory, the Australian team appears to have done the opposite - and cartographers everywhere are now rushing to un-discover Sandy Island for ever.

Links :