Sunday, July 13, 2025

1871 Petermann map of Svalbard and the Arctic Ocean

Originalkarte der I.
Deutschen Nordpolar-Expedition, 1868.
  1871 (dated)     20 x 14 in (50.8 x 35.56 cm)     1 : 5000000
source : Geographicus 
 
This is an 1871 Augustus Petermann map of Svalbard and the Arctic Ocean.
The map records the 1868 First German North Polar Expedition, which, to this day, maintains the records for the highest northern latitude reached by a sailing ship without auxiliary drive.

A Closer Look

Illustrating the 1868 First German North Polar Expedition, the map depicts the region from Svalbard south to the Shetland Islands and from Iceland and Greenland to Norway.
The expedition's track is highlighted using color to differentiate months.
The crew recorded water temperature readings every four hours, dated along the expedition's course.
Part of the September 1868 Swedish Expedition in the area is also traced.
Three views situated in the upper left depict one of the major hazards of polar exploration in the 19th century: sea ice.
Ships at that time were made of wood, and the expedition's leader, Carl Koldewey (1837 - 1908), had their vessel reinforced before setting out, likely with this scenario in mind.

The First German North Polar Expedition

The First German North Polar Expedition was an Arctic expedition led by Captain Carl Koldewey during the summer of 1868.
Inspired by the great German geographer Augustus Heinrich Petermann (1822 - 1878), the expedition left Bergen on May 24, 1868.
Given the primary objective of reaching Greenland's east coast, the ship and her crew reached sea ice on June 4 and were stuck by June 9.
They spent the next two weeks drifting with the current before they were able to break free of the ice and get underway again.
Once free, Koldewey continued with the expedition's secondary objective: reaching 'Gillis-Land' an island northeast of Svalbard, since it was apparent that reaching Greenland's east coast by sea was not possible.
The expedition proceeded along the sea ice to Svalbard but was stymied in its attempt to round south of the archipelago.
They reversed course on a second attempt to reach Greenland but were again unsuccessful.
Heading north one last time, the expedition tried to get past Svalbard to the north, and, in doing so, spent weeks exploring the Hinlopen Strait.
The Expedition also reached 81° 4' N on September 13, still a record for the highest northern latitude reached by a sailing ship without auxiliary drive.

The First German North Polar Expedition was not meant as a scientific expedition, simply an exploration.
Their orders were to achieve the greatest possible latitude and not to embark on a thorough investigation of the region or a thorough mapping of the coastlines.
Those activities would be undertaken by a subsequent expedition.
After returning to Bergen on September 30, Koldeway believed that the expedition was 'an unfortunate, completely unsuccessful one'.
However, the expedition achieved its goal of reaching an extremely high latitude, and the scientific data they recorded, which included extensive oceanographic, meteorological, and geomagnetic readings, proved invaluable.

Svalbard

Dutch explorer Willem Barentz (1557 - 1597) first discovered Svalbard in 1596, and the first recorded landing on the island happened in 1604.
During the early 17th century, whalers established the first settlements in the archipelago, and by the early 1630s, the heartiest would winter on the islands.
Russian hunters arrived in the late 17th century and set up relatively permanent settlements.
Nonetheless, by the 1860s, the islands were again largely uninhabited.
Svalbard became a destination for Arctic tourism in the 1890s.
Today, Svalbard's three principal industries are mining, tourism, and research.
It is also home to the Svalbard Global Seed Vault.

Saturday, July 12, 2025

Footage of Houthis' Magic Seas bulk carrier operation


Yemen's Iran-backed Houthis claimed responsibility on Monday for an attack that damaged a commercial vessel in the Red Sea and forced its crew to abandon ship.
The Houthis "targeted the Magic Seas ship... using two unmanned boats, five ballistic and cruise missiles, and three drones" on Sunday, military spokesman Yahya Saree said in a video statement.
He added that the ship was targeted for violating their ban on navigation to "occupied Palestine's ports."
 
Links : 


Friday, July 11, 2025

5 meters depth at Corner Seamount ?

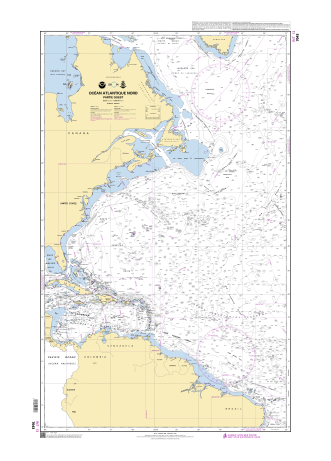
Raster chart 7043 (SHOM) visualization in Weather 4D R&N mobile app
5 meters depth in the middle of the North Atlantic Ocean ? 
 
That extremely shallow depth is surprising for a seamount setting—which are often much deeper—and suggests either a submerged pinnacle or perhaps a shoal very close to surfacing.
If you're planning navigation, diving, or research in that vicinity, you’ll definitely want to account for that potential hazard or point of interest.
Would you like to explore navigational charts around that coordinate, or dive into how that shallow patch might have formed? 
 

approximate position : 35.352336,-51.479050
 

 This is confirmed by NtM (112469) from SHOM published in 2011
(data issued from UKHO Taunton NtM 11-2149)
 
250 m depth in raster chart 7043
date : 12-04-2011

 
SHOM NtM issued from 
UKHO Notice to Mariner NtM 2149/11 (21wknm11) also published in 2011 :  
so 5 meters (2003) seems to be the corrected selected depth 
from original 250 m (even though this last one seems to have been established 4 years later in 2007)
 
UKHO chart 4407 / date 11-01-2011
 
actually original information from UKHO 
(current raster chart GB4411/GB4012/GB4013)
also visible in GB4407 Trinidad to the Mid-Atlantic Ridge in the GeoGarage platform UKHO set 
 
also shown on GB1CK000 ENC (UKHO)
Scale : 3000000 / Cat : 1 / Type : Overview
Edition_date : 20240522 / Edition : 2 
Update_date : 20250328 / Update : - 
 
Associated data for the 5.5 m sounding for GB1CK00 ENC (QTVLM software)
 
The UKHO was informed in 2007 of a reported depth of 250m.
This depth info was published as a NtM (5302/07) affecting 4 GB Charts in the 4000 series.
 
In 2011 the UKHO learnt of a reported depth of 5.5m that was originally reported in 2003.
 
The UKHO researched this observation from 2003 (in 2011) to understand further, in order to update navigational products if necessary.
The UKHO learnt that the 5.5m observation was reported to a National Hydrographic Office and to a National Coast Guard in 2003 but was not reported to the UKHO.
Upon further investigation by the UKHO, UKHO learnt that the crew of the vessel who reported this depth, noted that as they approached an ‘object’ on the surface, the depth sounder went from over 600ft (no bottom showing) to a depth of 18ft then the object which was assessed as at a depth of 5.5m.
 
Given the position of the 250m (reported 2007) and the position of the 5.5m (reported 2003 but only made aware to UKHO in 2011) and the scale of navigational products, under SOLAS we issued the NtM 2149/11 replacing the 250m (reported in 2007) with the 5.5m PA (reported in 2003).
 
As is the case with Reported Depths, the UKHO will chart them with the legend Rep (Year of report) and depending on criteria UKHO may also include a legend – PA which stands for Position Approx.
Which is what we have done in this case.
UKHO always would like a survey to be carried out to either prove or disprove a reported depth (or obstruction).
For this geographical area there has not been an appetite to undertake such a survey to our knowledge...
 
The vessel SV Journey who observed the depth in 2003 was a leisure vessel.
Depth information (and other observations) are used from leisure vessels for SOLAS where data is sparse.
UKHO does use bathymetric surveys but where there are areas that are lacking data, and the Hydrographic Office receives a report of a danger to navigation, it will be reviewed and included on the UKHO products.
If it is from a non-survey vessel, as in this case, UKHO will use the legend PA (mentioned above) to inform the mariner that the depth is position approx. 


5 m depth also visible on Transas nautical charts
 
but no 5 m depth in NGA raster chart
 
but no 5 m depth in Navionics Garmin raster chart
 
but no 5 m depth in C-Map raster chart
 
same : no 5 m depth in C-Map/Navico raster chart
 
no specific visualization of 5 m depth in Google Earth SOEST Hawaï seamounts database
 
no specific visualization of 5 m depth on STRM bathymetry
 

In 2005, NOAA conducted a mission called 05stepstones in the area :

This map shows the various peaks of the Corner Rise seamount cluster. 
The peaks are labeled with arbitrary numbers and are accompanied by estimated summit height, in meters, in parentheses.
Image courtesy of Les Watling, University of Maine.

In 2021, NOAA's Okeanos Explorer conducted a 30-day expedition to explore New England and Corner seamounts.
 

but not any data at the 5.5 m depth approximate position


NASA analysis shows irreversible sea level rise for Pacific islands


Pacific Island nations such as Kiribati — a low-lying country in the southern Pacific Ocean — are preparing now for a future of higher sea levels.
 
From NASA Earth Observatory 

Climate change is rapidly reshaping a region of the world that’s home to millions of people. 

In the next 30 years, Pacific Island nations such as Tuvalu, Kiribati, and Fiji will experience at least 6 inches (15 centimeters) of sea level rise, according to an analysis by NASA’s sea level change science team.
This amount of rise will occur regardless of whether greenhouse gas emissions change in the coming years.

The sea level change team undertook the analysis of this region at the request of several Pacific Island nations, including Tuvalu and Kiribati, and in close coordination with the U.S. Department of State.

In addition to the overall analysis, the agency’s sea level team produced high-resolution maps showing which areas of different Pacific Island nations will be vulnerable to high-tide flooding — otherwise known as nuisance flooding or sunny day flooding — by the 2050s.
Released on Sept. 23, the maps outline flooding potential in a range of emissions scenarios, from best-case to business-as-usual to worst-case.

“Sea level will continue to rise for centuries, causing more frequent flooding,” said Nadya Vinogradova Shiffer, who directs ocean physics programs for NASA’s Earth Science Division. 
“NASA’s new flood tool tells you what the potential increase in flooding frequency and severity look like in the next decades for the coastal communities of the Pacific Island nations.”

Team members, led by researchers at the University of Hawaii and in collaboration with scientists at the University of Colorado and Virginia Tech, started with flood maps of Kiribati, Tuvalu, Fiji, Nauru, and Niue.
They plan to build high-resolution maps for other Pacific Island nations in the near future.
The maps can assist Pacific Island nations in deciding where to focus mitigation efforts.

“Science and data can help the community of Tuvalu in relaying accurate sea level rise projections,” said Grace Malie, a youth leader from Tuvalu who is involved with the Rising Nations Initiative, a United Nations-supported program led by Pacific Island nations to help preserve their statehood and protect the rights and heritage of populations affected by climate change.
“This will also help with early warning systems, which is something that our country is focusing on at the moment.” 

Future Flooding

The analysis by the sea level change team also found that the number of high-tide flooding days in an average year will increase by an order of magnitude for nearly all Pacific Island nations by the 2050s. Portions of the NASA team’s analysis were included in a sea level rise report published by the United Nations in August 2024.

Areas of Tuvalu that currently see less than five high-tide flood days a year could average 25 flood days annually by the 2050s.
Regions of Kiribati that see fewer than five flood days a year today will experience an average of 65 flood days annually by the 2050s.

“I am living the reality of climate change,” said Malie. “Everyone (in Tuvalu) lives by the coast or along the coastline, so everyone gets heavily affected by this.”

Flooding on island nations can come from the ocean inundating land during storms or during exceptionally high tides, called king tides.
But it can also result when saltwater intrudes into underground areas and pushes the water table to the surface.
“There are points on the island where we will see seawater bubbling from beneath the surface and heavily flooding the area,” Malie added. 

Matter of Location

Sea level rise doesn’t occur uniformly around the world.
A combination of global and local conditions, such as the topography of a coastline and how glacial meltwater is distributed in the ocean, affects the amount of rise a particular region will experience.

“We’re always focused on the differences in sea level rise from one region to another, but in the Pacific, the numbers are surprisingly consistent,” said Ben Hamlington, a sea level researcher at NASA’s Jet Propulsion Laboratory in Southern California and the agency’s sea level change science team lead.

The impacts of 6 inches (15 centimeters) of sea level rise will vary from country to country.
For instance, some nations could experience nuisance flooding several times a year at their airport, while others might face frequent neighborhood flooding equivalent to being inundated for nearly half the year.

Researchers would like to combine satellite data on ocean levels with ground-based measurements of sea levels at specific points, as well as with better land elevation information. 
“But there’s a real lack of on-the-ground data in these countries,” said Hamlington. 
The combination of space-based and ground-based measurements can yield more precise sea level rise projections and improved understanding of the impacts to countries in the Pacific.

“The future of the young people of Tuvalu is already at stake,” said Malie.
“Climate change is more than an environmental crisis. It is about justice, survival for nations like Tuvalu, and global responsibility.”

To explore the high-tide flooding maps for Pacific Island nations, go to:
https://sealevel.nasa.gov