From Popular Mechanics by Meg Neal
Eight maps, from antiquity to today, that changed how we see the world.
When Christopher Columbus first set foot in what's now the Bahamas, it was the lucky sum of a 1,400-year-old cartographical error and Columbus's own miscalculations of the globe.
The Genoese explorer believed the Eurasian landmass to cover nearly 2/3 of the earth's circumference—the actual distance from Spain eastward to his target of eastern Asia was closer to 1/3 of the circumference.
Columbus’s image of the world was based on ancient maps that greatly overestimated the size of the Eurasian continent and depicted the planet’s circumference some 25 percent smaller than it actually was—a misjudgment compounded by his own wishful thinking and erroneous math.
By his calculation, India lay within a 2,500-mile voyage west of Spain.
He was off by about 8,000 miles.
Maps are a 10,000-year journey of humans trying to understand earth.
Columbus’s errors are only a chapter in a series of discoveries, theories, and mistakes that tell the story of maps and mapmaking.
Maps are a 10,000-year journey of humans trying to understand Earth.
In 1492, most people had no idea what the world looked like; even some impressively accurate maps were full of myths and mistakes, from fantastical monsters to entire missing continents to swaths of terra incognita, or “unknown territory.”
Over time, errors were corrected and empty spaces were filled in, and today, much of the population walks around with a map of the entire Earth in their pocket that’s so detailed you can see your own front door.
But to understand how we got here, look to these eight maps that tell the history of how we view the world.
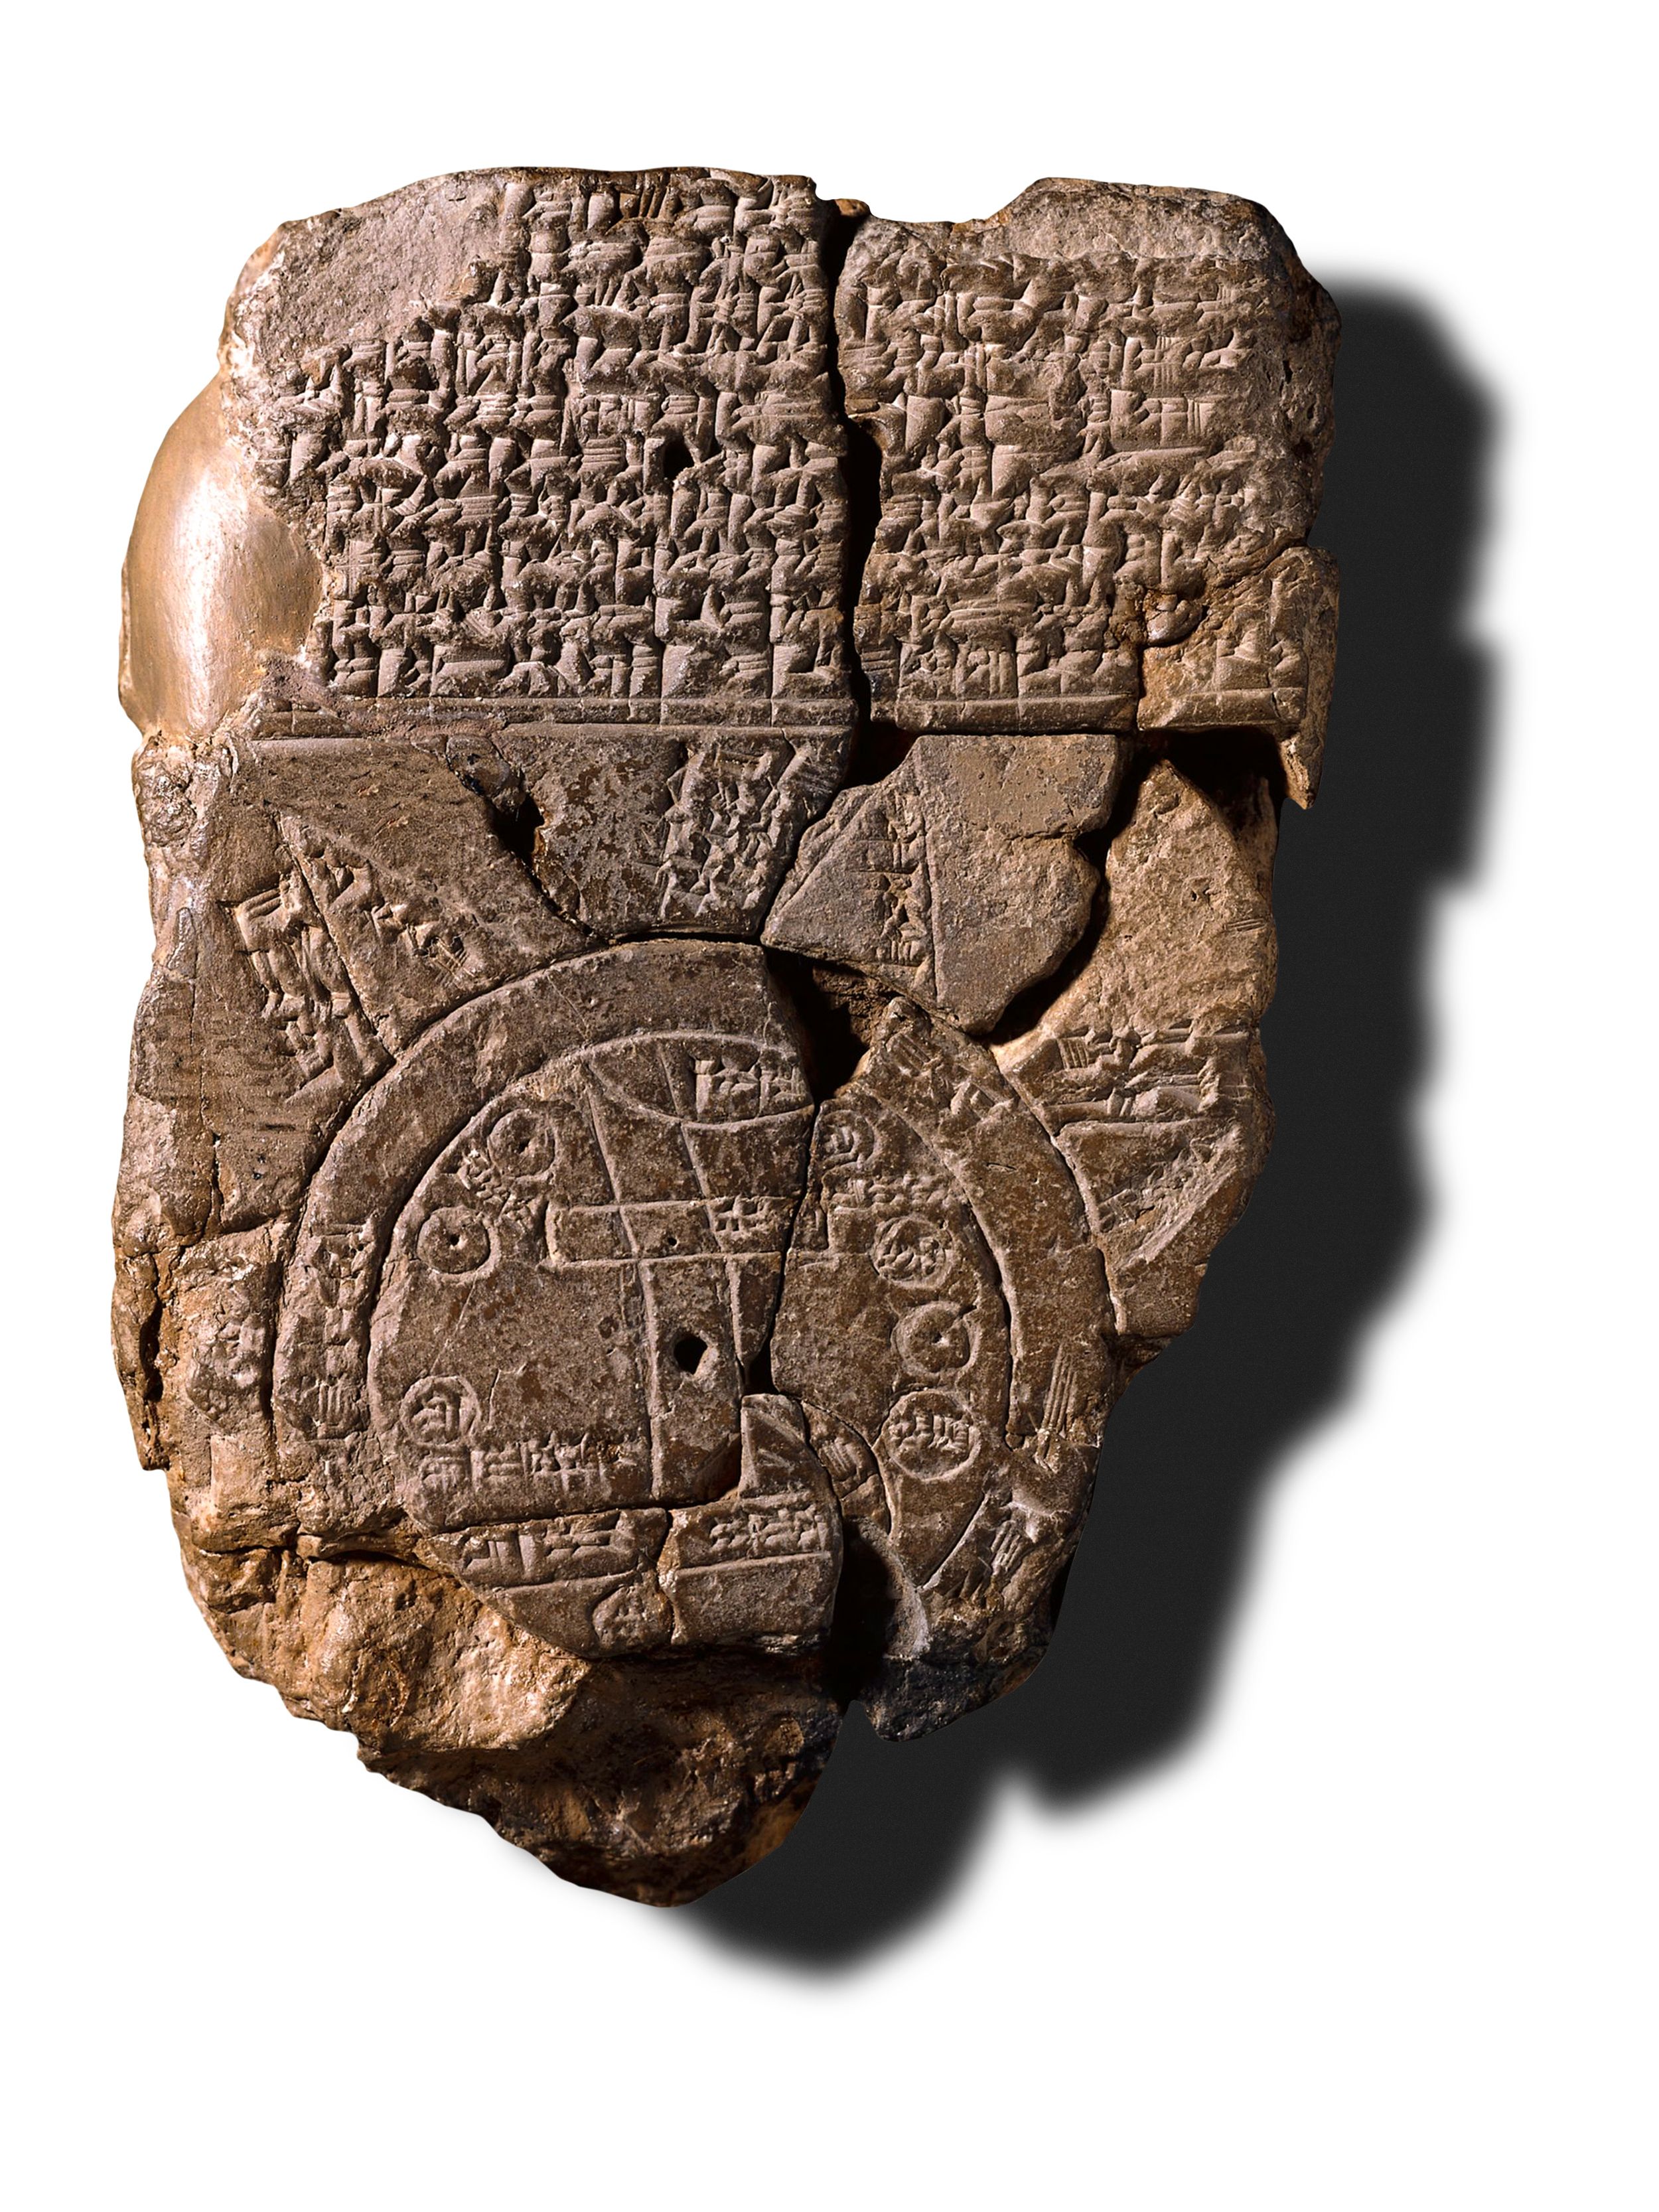
The oldest surviving world map : BABYLONIAN MAP OF THE WORLD
The Babylonian Map of the World, etched in the 6th century B.C.
Fine art images/heritage images getty images
The oldest surviving world map depicts the worldview of Babylonians circa 600 B.C.
The 5-inch stone tablet is centered around Babylon, the wide rectangle, which straddles the Euphrates River, depicted by the crooked lines running from top to bottom.
Babylon, likely the world’s most populous city at the time, is surrounded by neighboring cities represented by small circles, all within a greater circle to denote the ocean.
Though its geography is limited, this map reveals the inherent bias of mapmakers to place themselves at the literal center of the world.
Other early maps served more practical needs, such as the stick and shell charts built to denote currents around islands in the South Pacific over 2,000 years ago, or the Egyptian papyrus maps that led miners through the desert in the 12th century B.C.
But the Babylonian Map of the World is the earliest example of a political map used to champion a country or city.
The first world atlas : PTOLEMY’S GEOGRAPHIA
No original maps from Geographia survived, but this, the oldest recreation, was constructed in the 14th century according to Ptolemy’s map projection and locations
Phas/Universal Images Group via Getty Images
The Greeks were the first known culture to apply a scientific approach to measuring and mapping the world.
The philosopher Pythagorus theorized as early as the 6th century B.C.
that the Earth was round.
And by 200 B.C., the scholar Eratosthenes compared the angles of shadows cast simultaneously in two distant cities to accurately estimate the planet’s circumference within 1,000 miles.
Combining the work of earlier Greek scholars with travelers’ stories and town records from across the then-Roman world, Greek-Egyptian astronomer Ptolemy compiled Geographia, an eight-volume atlas that formed the basis for the next 1,500 years of mapmaking.
Completed around 150 A.D., Geographia served as a how-to manual for cartography.
Ptolemy explained map projections—depicting a globe on a flat plane.
And he listed the coordinates for 8,000 locations in Eurasia and northern Africa based on parallels of latitude and meridians of longitude, a precursor to today’s system.
Maps based on Ptolemy’s blueprint for the shape and size of the world informed Columbus’s voyage to the Americas and led Ferdinand Magellan’s expedition around the globe.
Yet his work disappeared with the fall of the Roman Empire, not reemerging for almost 800 years.
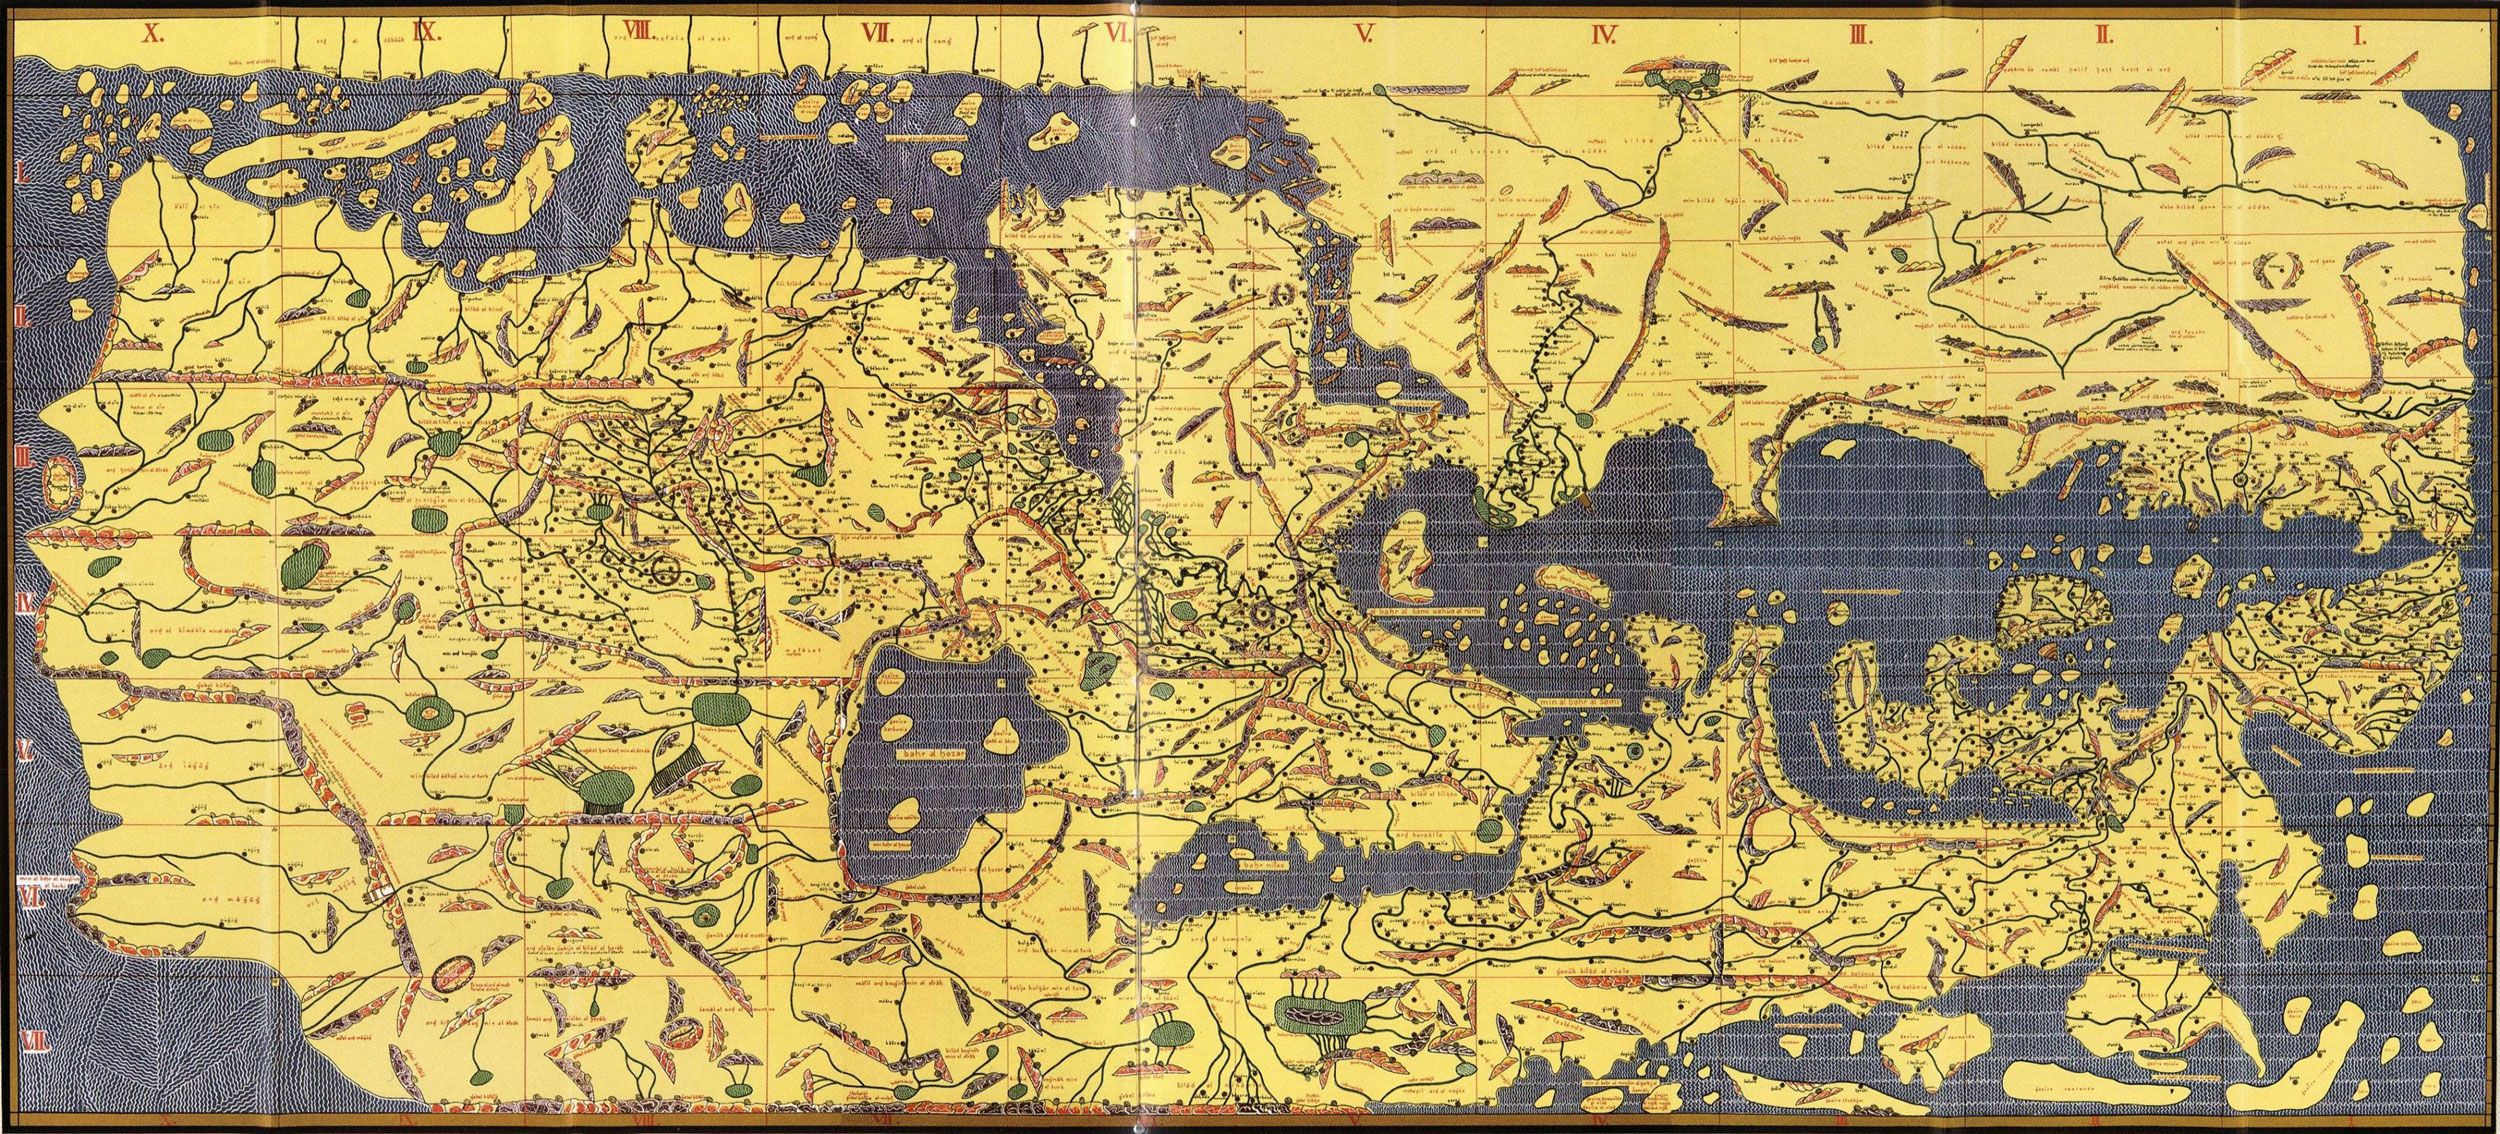
An update for the next millennium : TABULA ROGERIANA
Drawn by Muslim cartographer Muhammad al-Idrisi, this map of North Africa and Eurasia places south, the direction of Mecca, at the top.
Fine Art Images/Heritage Images/Getty Images
The Tabula Rogeriana, or Book of Roger, was completed by Moroccan cartographer Muhammad al-Idrisi in 1154.
Compiled over 15 years for King Roger II of Sicily—who hoped the map could inform and expand his rule—the book included a world map with 70 regional maps, each accompanied by a detailed description of their cities, roads, rivers, and mountains.
For the next three centuries, it was among the most accurate geographic works in existence of the known world.
It later helped guide Vasco da Gama’s voyage to India by sea.
Though it was produced for a Norman king in Italy, the atlas was a culminating achievement from the Islamic Golden Age—while science took a sabbatical in most of Europe during the early middle ages.
Al-Idrisi’s work was in large part based on Geographia, which was rediscovered and translated into Arabic around the 9th century.
Islamic cartographers built on Ptolemy’s work and corrected errors based on their knowledge of the growing empire.
They accurately drew the Indian Ocean as open and connected to the Pacific Ocean, instead of Ptolemy’s landlocked sea.
Islamic mapmakers also produced some of the most elaborate charts of the era, largely inspired by the need to determine the direction of Mecca from anywhere in the world.
Islamic world maps were oriented with south at the top, looking “up” toward the holy city.
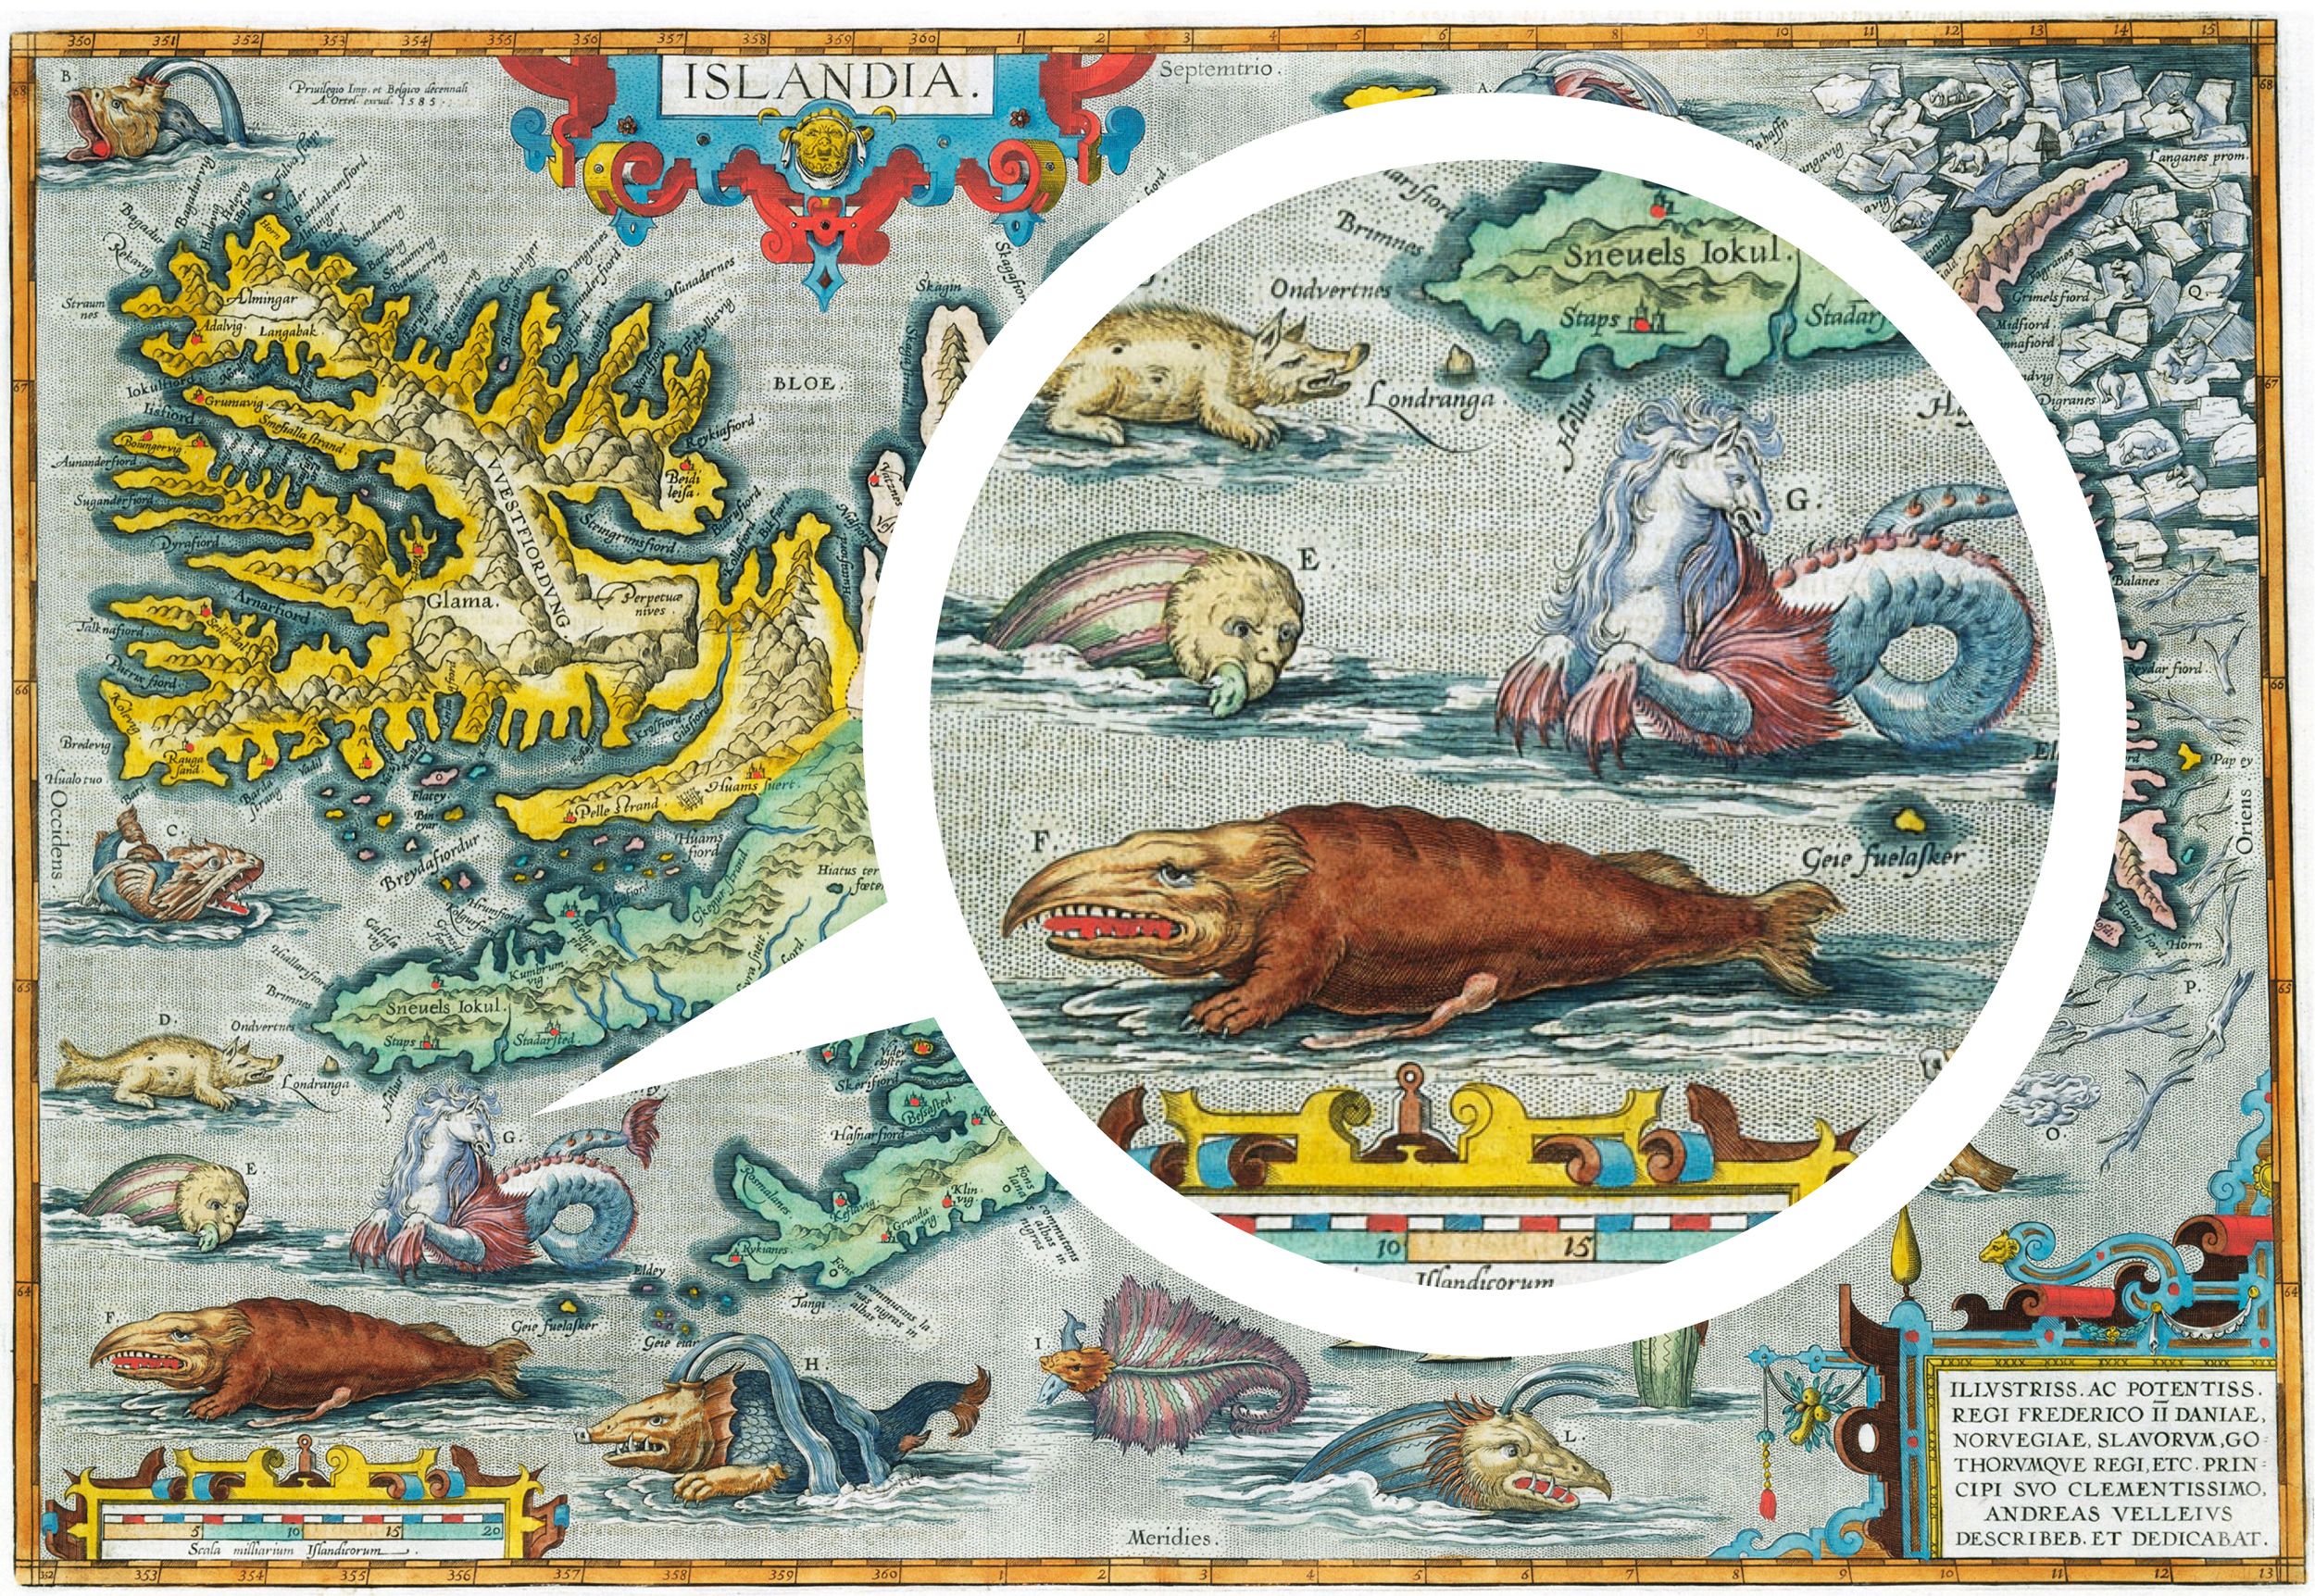
Where Be Dragons?
The famous warning “Here Be Dragons” is a map myth: It was never actually written on old maps, though a Latin version appears on one 16th-century globe.
Instead, the phrase represents the illustrations of monstrous sea serpents, toothy beasts, and strange peoples that frequently adorned medieval and Renaissance maps.
Fine Art Photographic Library/Corbis via Getty Images
In most cases, map monsters were simple decoration, strategically filling in the empty parts of the map.
(Cartographers are known to abhor a blank space.) But often, these imaginary beasts were seen as very real threats, born out of inflated travelers’ tales and infused with religious myth and folklore.
They were often drawn lurking in uncharted waters, where they signaled the dangers that lie beyond the known world.
On some medieval world maps, the inhabitants of distant lands are depicted as strange mythical peoples.
You’ll find the headless “blemmyes” with faces in their chests, the desert “sciapods” with a single giant foot to shield the sun, and the “antipodeans” who live on the other side of the world (the Australian continent from the Europeans’ perspective) and whose feet point in the opposite direction.
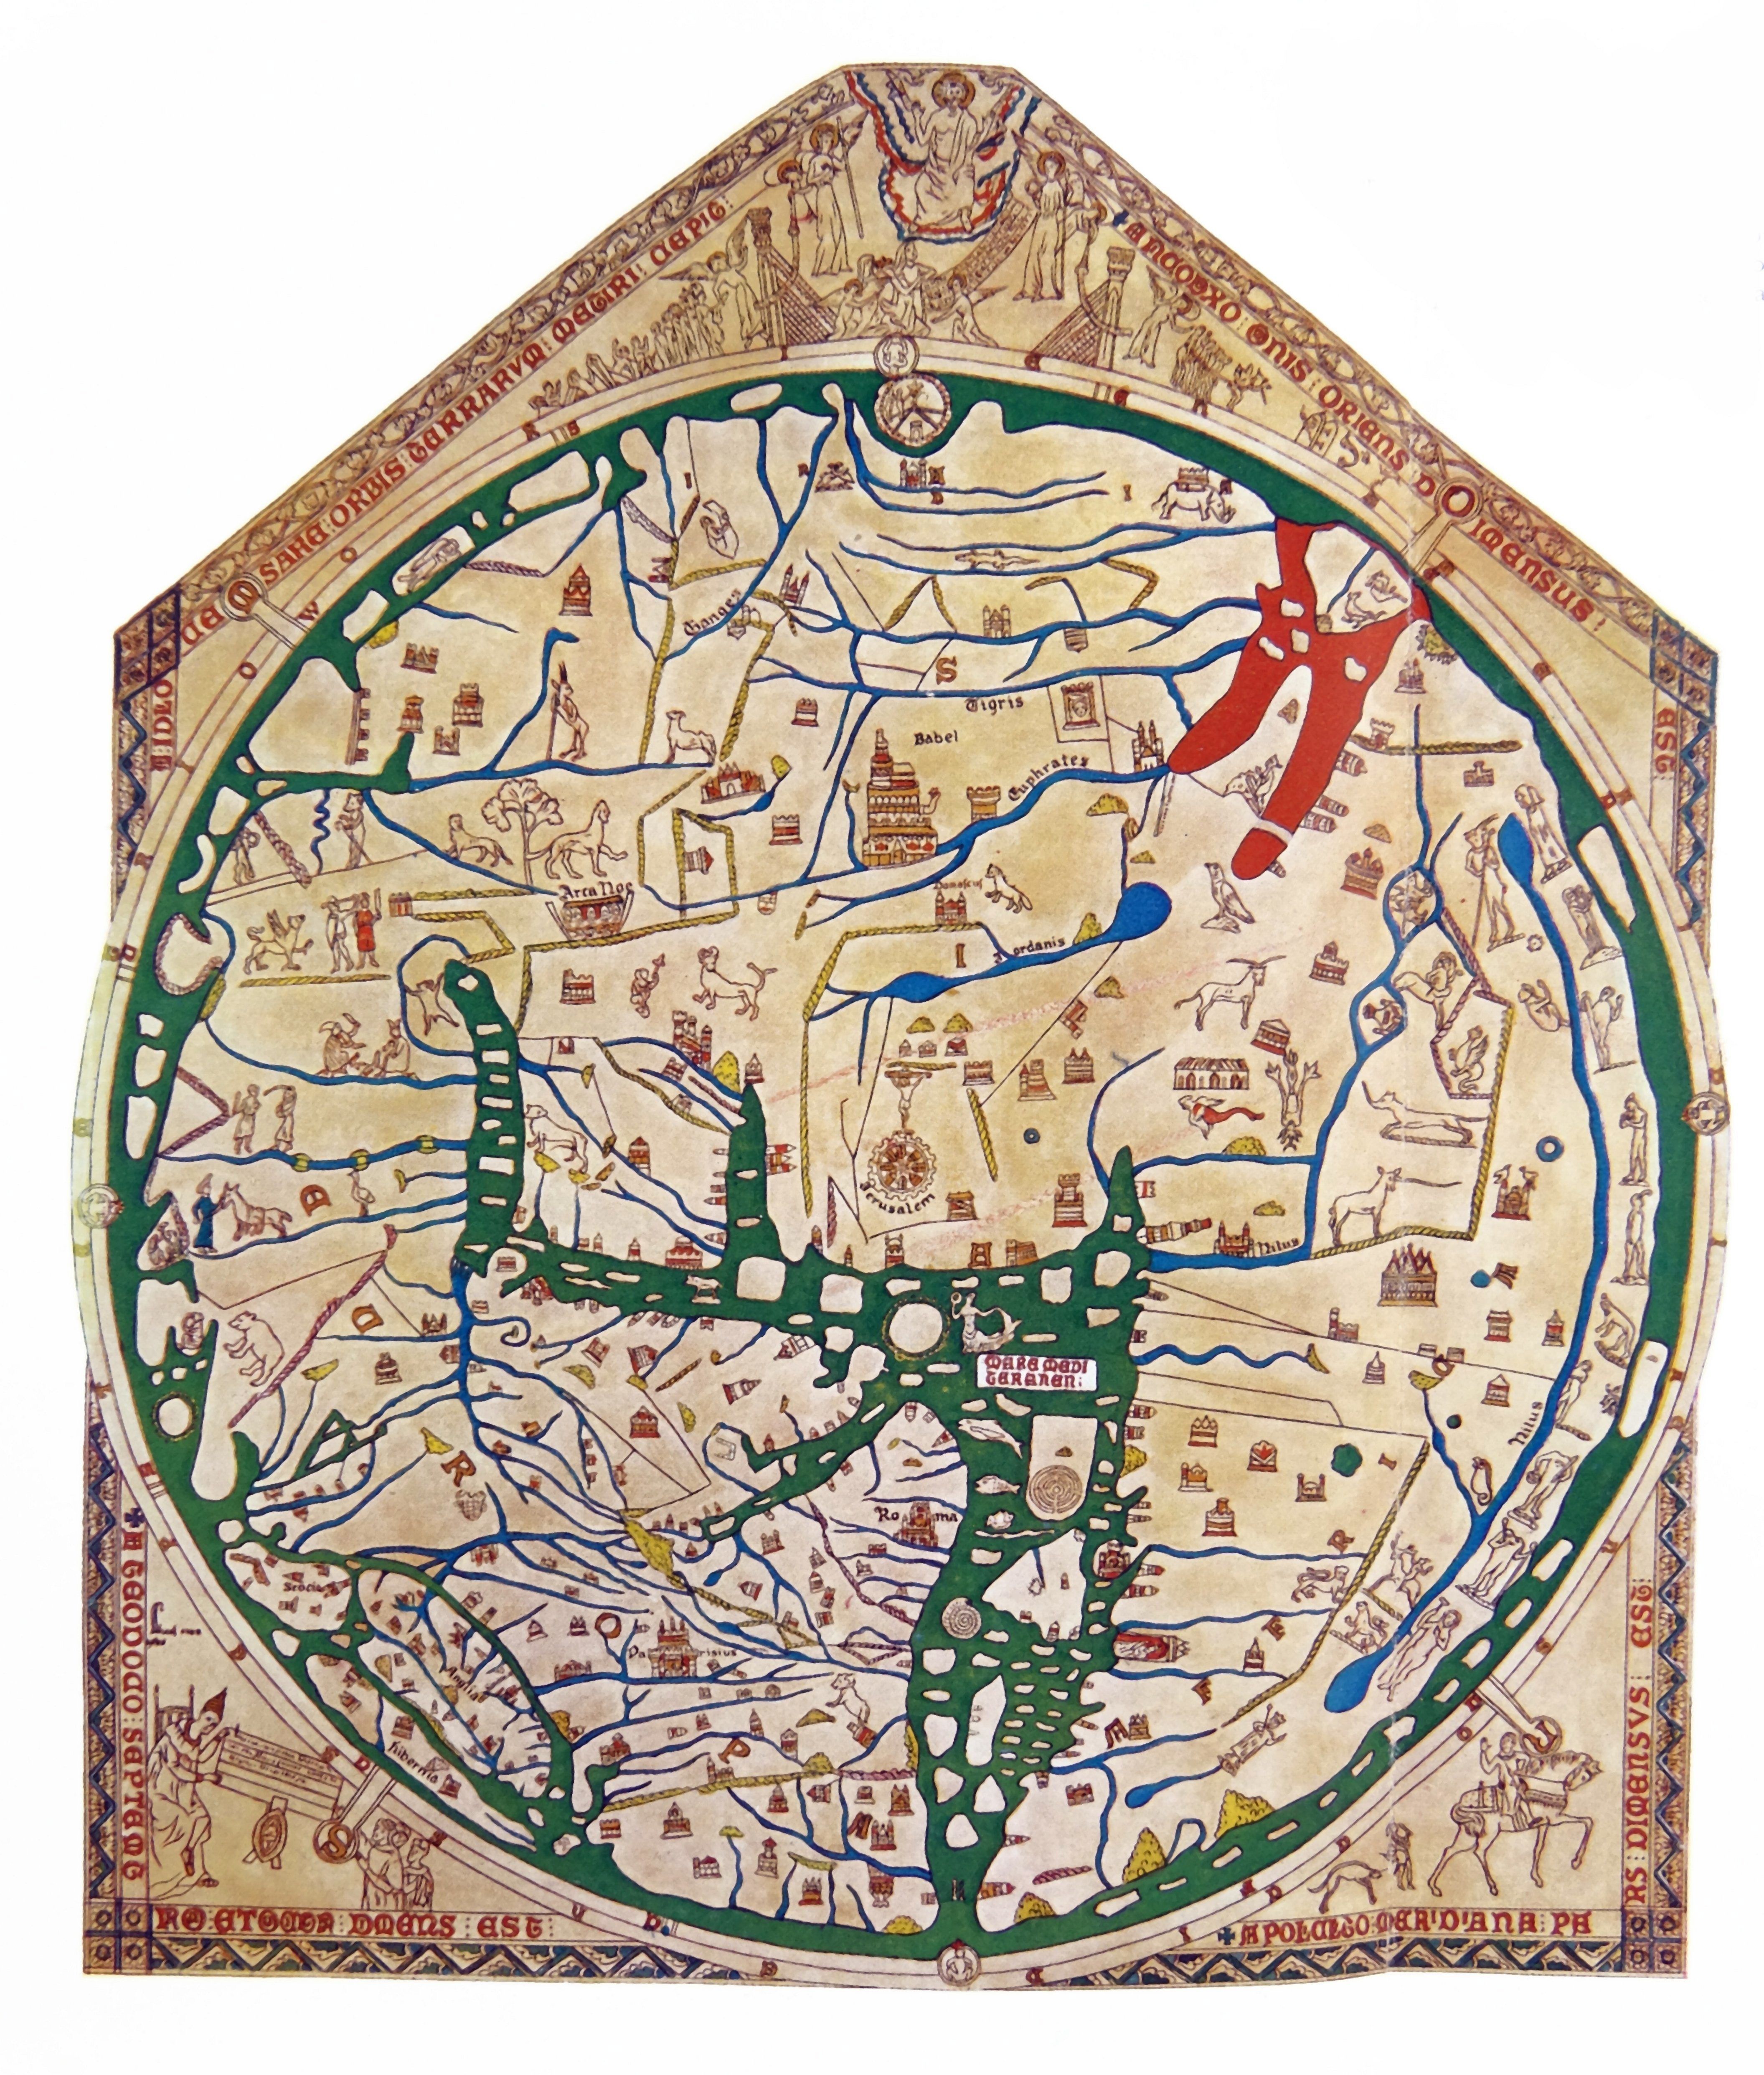
Mapping around Jerusalem : HEREFORD MAPPA MUNDI
A modern reproduction of the Hereford Mappa Mundi.
Europe is in the lower left quadrant.
Universal History Archive Getty Images
Back in Europe, maps told a spiritual story instead of a geographic one.
Much like how Babylon's ancient map gave a glimpse into their worldview, the medieval mappa mundi, or world maps, show how Western Christendom perceived the world.
The
Hereford Mappa Mundi, created around 1300 in England, is a fascinating peek into the medieval imagination.
Drawn on a huge piece of animal hide, it is the largest and most famous surviving world map from the middle ages.
The top depicts the Day of Judgment, one of many biblical scenes inked onto map, while images of wild beasts and fantastical monsters lurk on the edges of the world, representing the dangers of the unknown.
The Hereford Map represents the most common type of mappa mundi, the “T-O” map, so called because a “T” shape splits the world into three continents (Asia, Europe, and Africa) surrounded by an “O”-shaped ocean.
First described in the 7th century, T-O maps usually put Jerusalem at the center of the world and were oriented with east at the top, considered the holiest direction and the location of the Garden of Eden.
In fact, the term “orientation”
comes from the Latin root oriens meaning “east.” To “orientate” a map meant placing east at the top, and it was the standard of European mapmaking for centuries.
But that was about to change.
Navigation by compass : CATALAN ATLAS
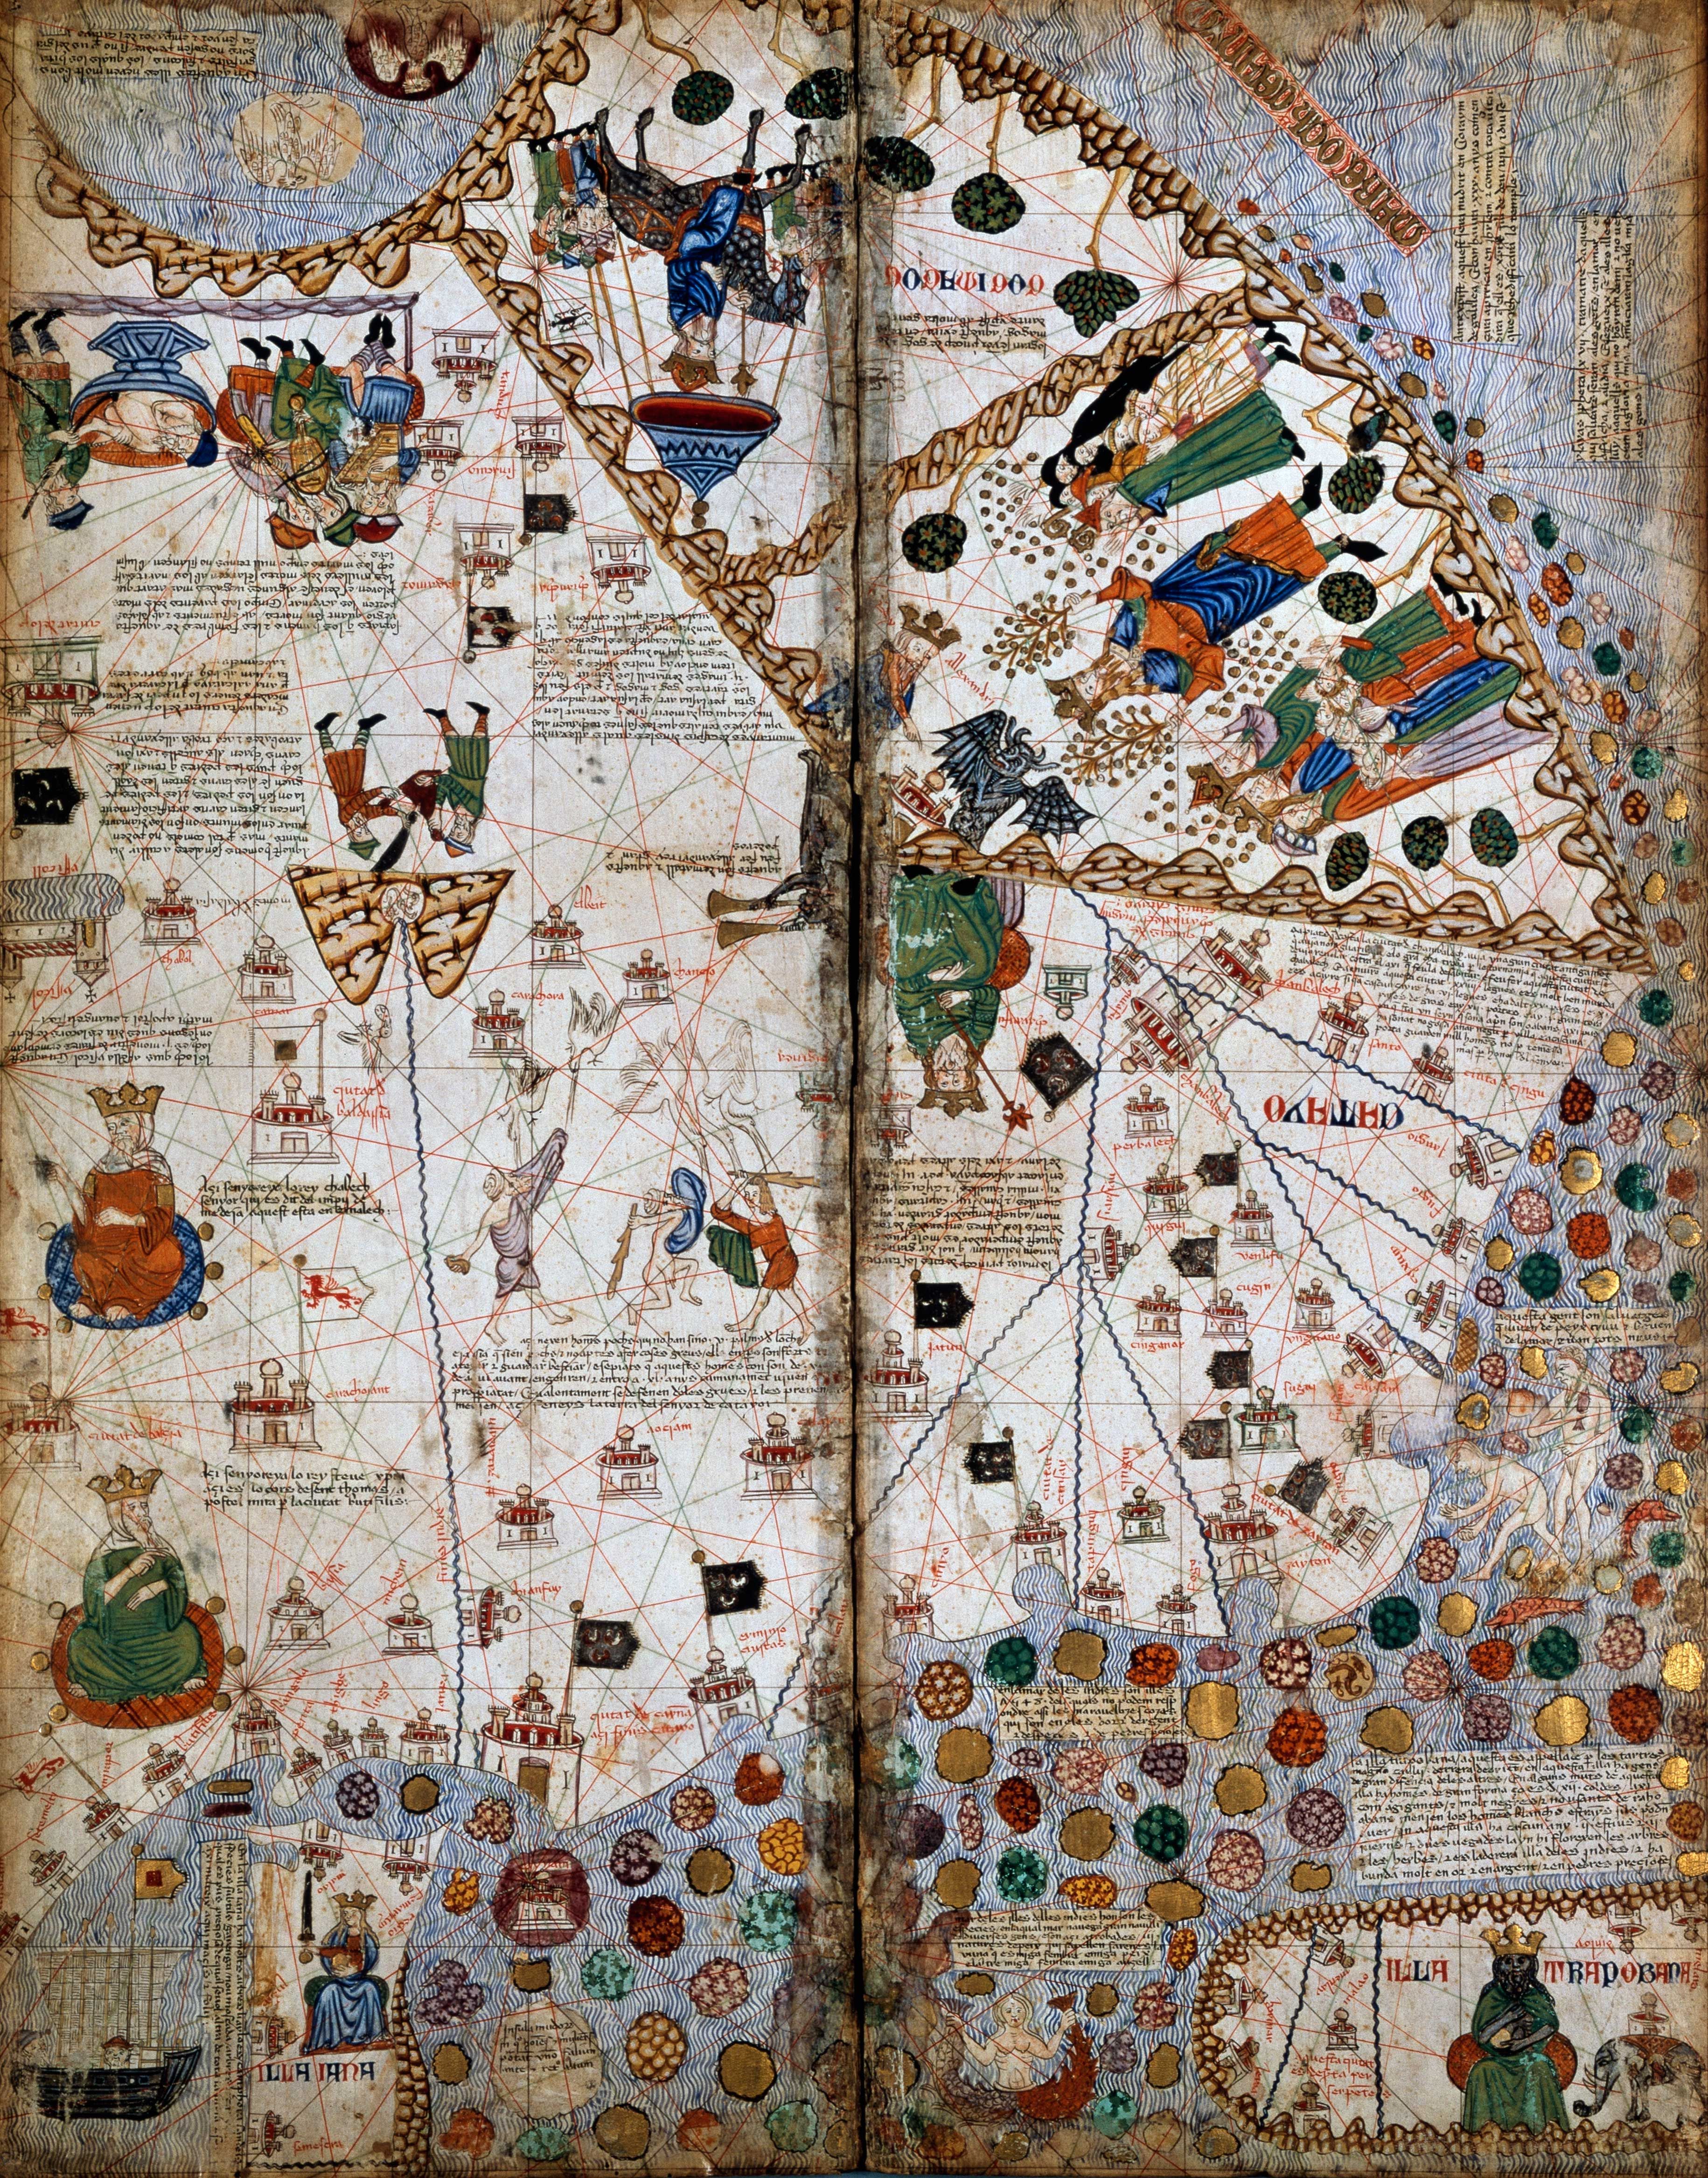
The two far right pages of the Catalan Atlas (pictured) depict central and eastern Asia based on Marco Polo’s travels.
De Agostini Picture Library/Getty Images
Ancient sailors navigated the seas by keeping in sight of land and observing the sun and stars.
If clouds rolled in, they pulled in their sails and waited for better visibility.
The discovery of the compass—a magnetized needle on wood, floating in water, aligning itself with the magnetic poles—changed navigation.
Sailors could safely venture into the open sea without visual cues.
First mentioned in 11th century China, the compass spread along the Silk Road connecting the East and West, and with it, a new type of European map came into vogue, called a portolan chart.
These nautical maps were covered in crisscrossed lines indicating the bearing of trade routes between ports.
The oldest surviving example, the Carte Pisane, dating to 1290, charts the Mediterranean and Black Sea with enough accuracy that ships could navigate with it today.
But the most famous and expansive portolan map is the Catalan Atlas.
Drawn over eight pages of vellum in 1375 by Majorcan cartographer Cresques Abraham, it was the first world map to include the compass rose and stretched from the western edge of Europe and North Africa to China’s eastern coast.
The first modern map : MERCATOR MAP OF THE WORLD
Mercator’s projection was inspired by the accuracy of portolan maps.
Dea Picture Library/De Agostini/Getty Images
The compass sparked a shift back to geographical maps made for practical navigation.
Religious symbolism defined most medieval European mapmaking.
(Maps could tell you the rough direction of Eden, but not how far away it was.) In the early 15th century, European monarchs began to explore the Atlantic and Indian Oceans in search of new trading routes to the East.
At the time, Ptolemy’s Geographia was translated into Latin, marking the start of a boom in exploration and mapmaking.
As the 16th century saw the most complete maps of the world, it also overcame one of the thorniest problems of cartography: how to navigate a spherical globe on a two-dimensional map.
Picture flattening an orange peel against a flat surface—it’s impossible to do so without distorting its shape.
Ptolemy had tackled this, but navigators still couldn’t achieve the simple task of plotting the shortest course between points on a map with a straight line.
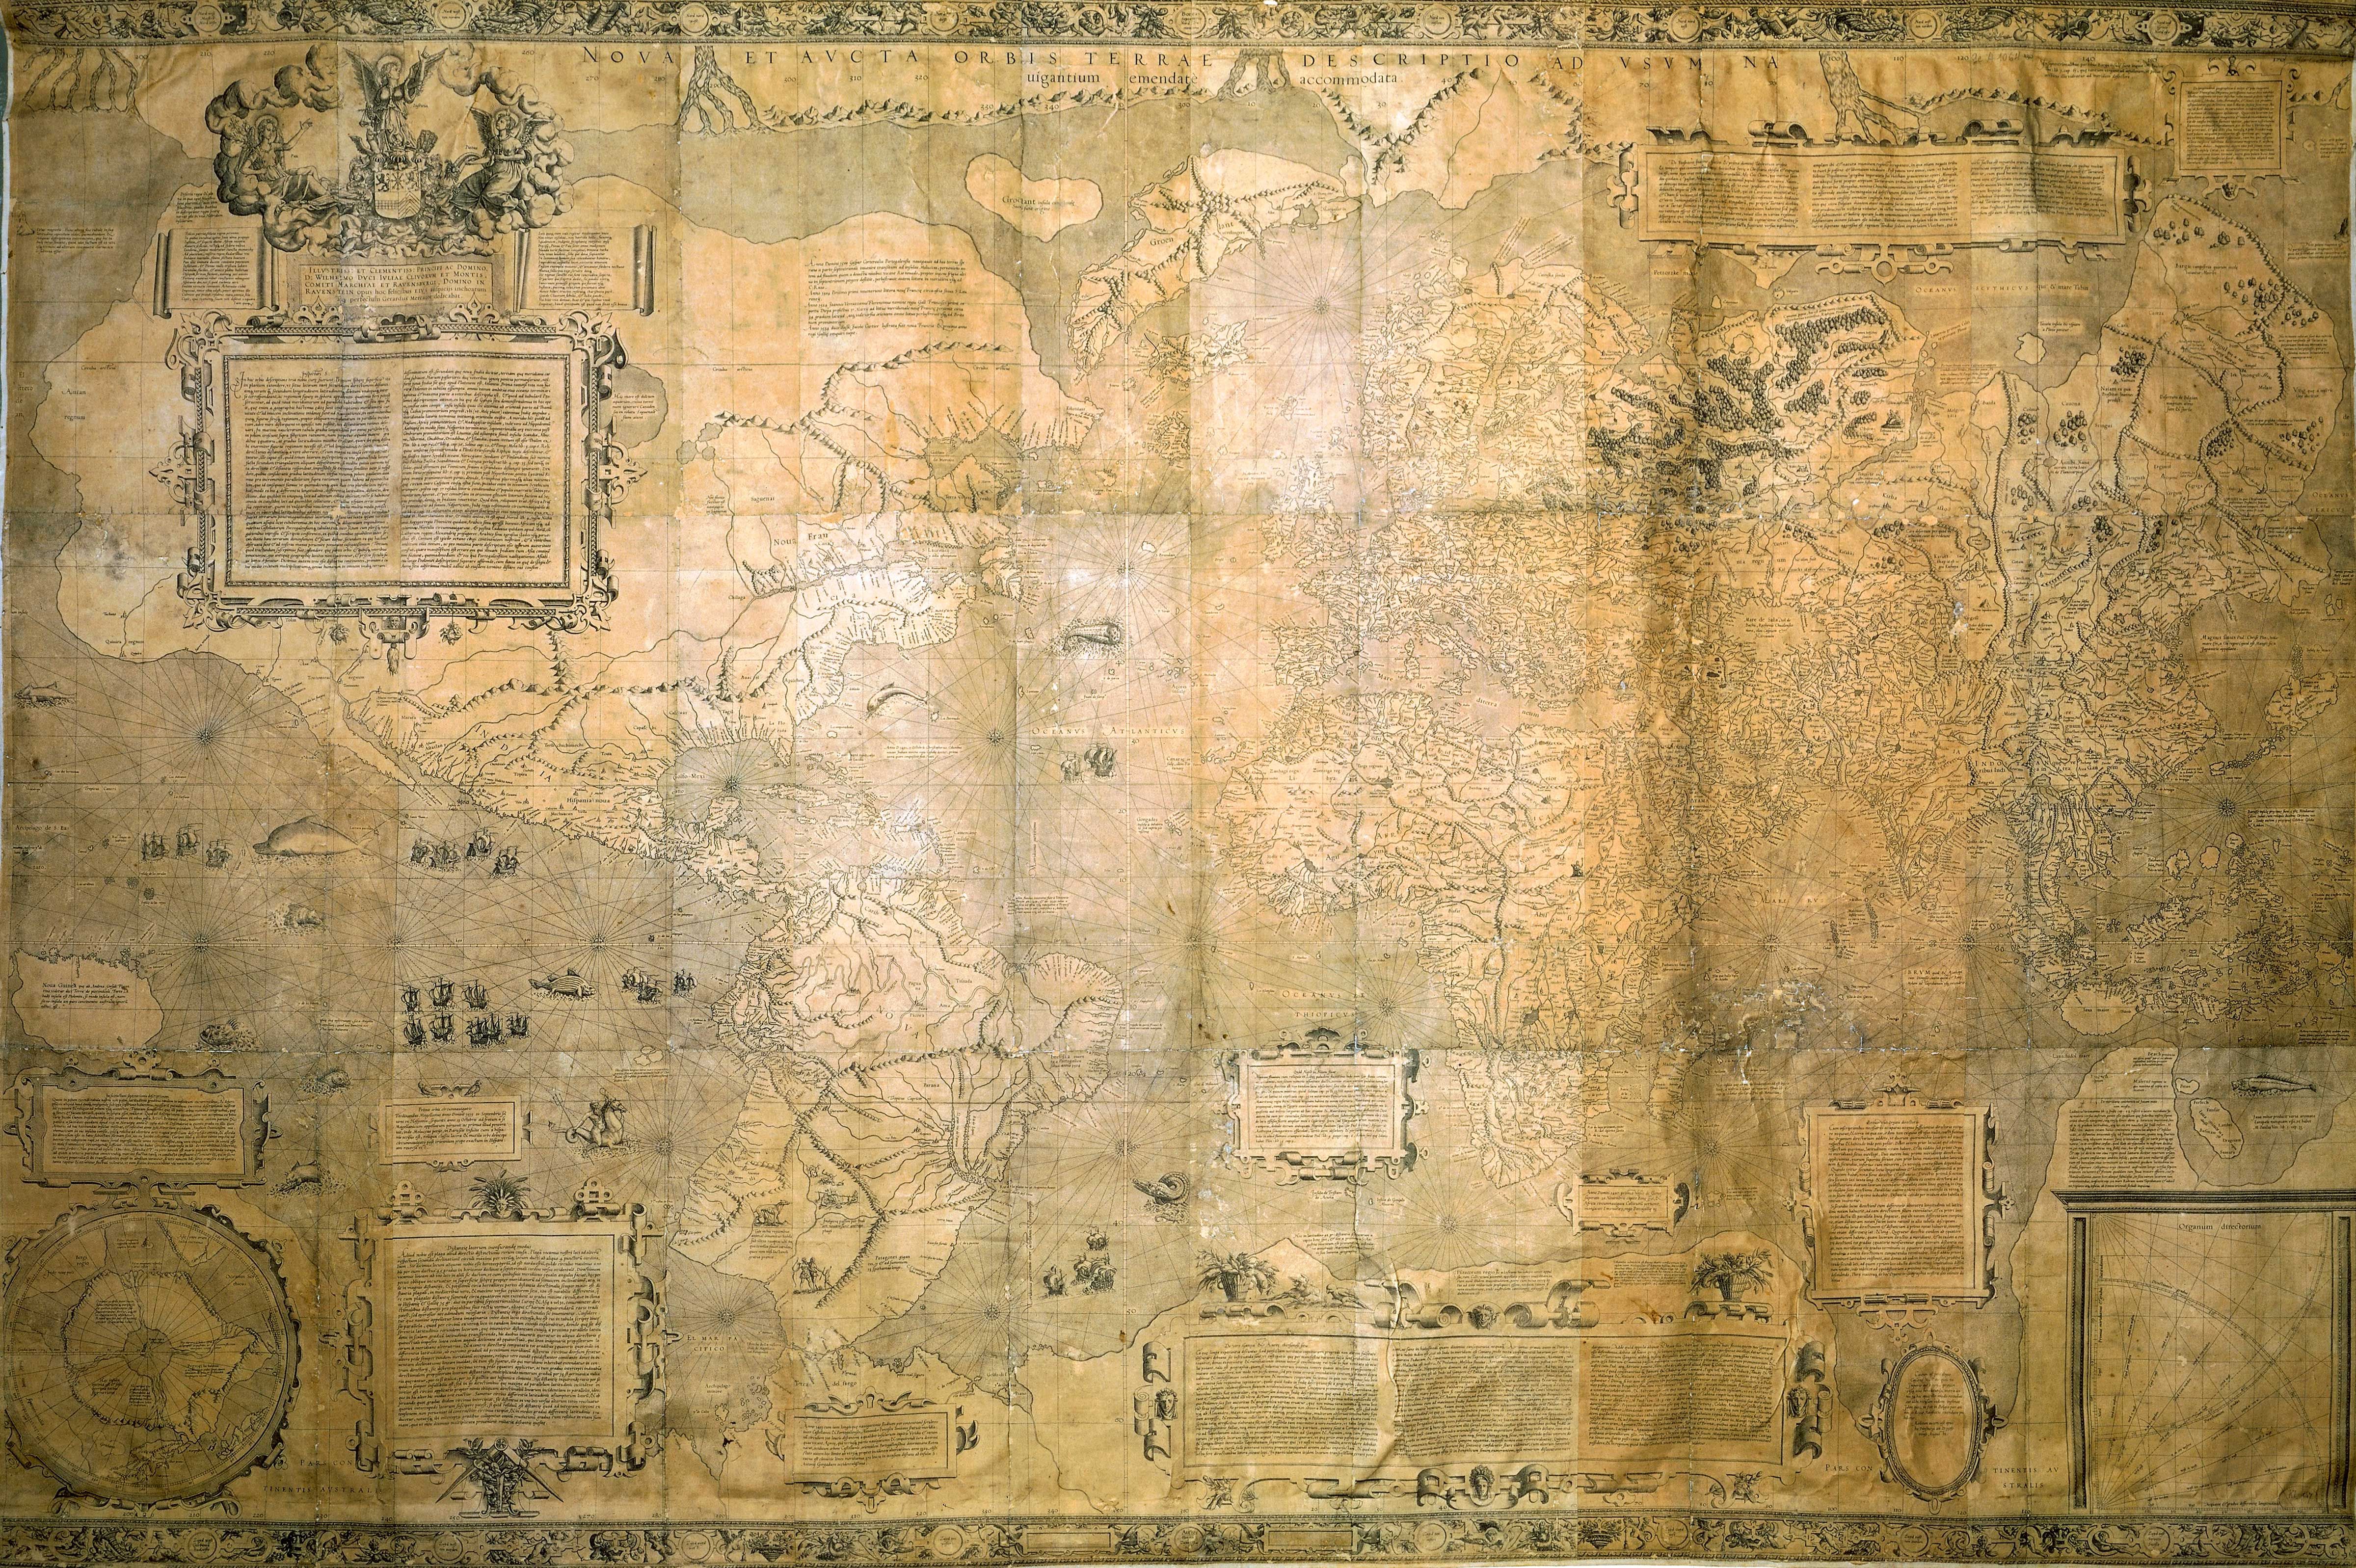
In 1569, Flemish-German cartographer Gerardus Mercator solved this millennia-old problem with a new map projection: Earth as a cylinder, which unrolled to a square grid of latitude and longitude.
The projection spaced lines of latitude increasingly far apart as they got farther from the equator.
The disadvantage of this projection, which we still see today, is that it distorted landmasses toward the poles.
Eurasia and North America are enlarged, while regions at the equator, such as most of Africa, appear misleadingly small.
Mapping from above : AERIAL MAP OF MANHATTAN
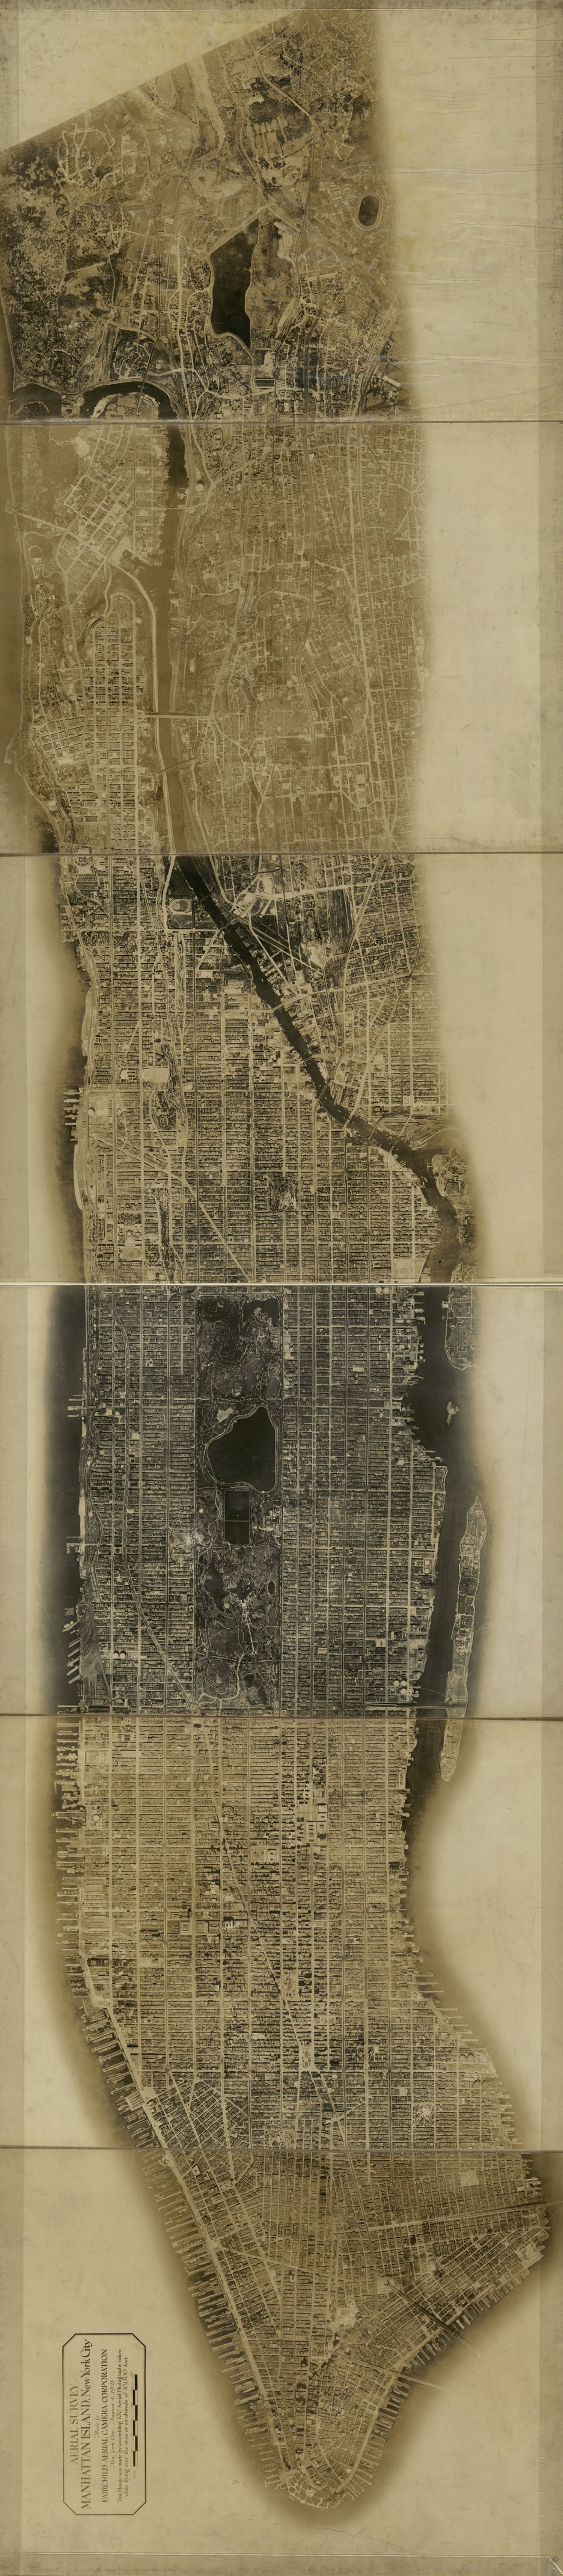
Manhattan was Fairchild’s second first aerial survey.
His first, a map of Newark, New Jersey, failed to gain notice.
Library of Congress, Geography & Map Division
The first photograph taken from the air was shot from a 260-foot-high hot air balloon in 1858.
It was an inauspicious start—and that photo of a small French village was lost—but aviation would revolutionize mapmaking.
From above, a photograph could gather a huge amount of data at a time, a major improvement on labor-intensive ground surveys.
When World War I broke out, maps became powerful weapons.
A detailed trench map of the front line allowed for artillery bombardments to be carried out without practice shots, retaining the element of surprise.
After the war, aerial photography spread to civilian use and in 1921 the Fairchild Aerial Map of Manhattan ushered maps into pop culture consciousness.
New York City entrepreneur Sherman Fairchild, who had been developing new aerial photography techniques for World War I, introduced an aerial camera that automatically snapped photos and turned the roll of film at timed intervals.
Mounted under a war-surplus biplane flying 10,000 feet high over New York, the camera snapped photos of the city every 27 seconds over a 69-minute flight up and down the island.
The negatives were then overlapped to form the detailed Manhattan grid with a precision that set the standard for the next 50 years of aerial mapping.
The world, in your pocket : GOOGLE EARTH, MAPS, AND STREET VIEW
Visit Machu Picchu via Google Earth and hike the Inca Trail with Street View.
Courtesy Google Street View
The Cold War drove the next leaps in mapping technology.
The launch of Sputnik sparked the development of GPS when MIT scientists realized they could track the Soviet satellite from the ground by observing how its radio signal changed as it moved, and likewise, objects on Earth could be located based on their distance from satellites.
Early satellite navigation experiments were developed by the U.S. military to track intercontinental missiles in the 1960s.
And by the early 1970s, the military launched the first Global Positioning System, NAVSTAR, which could determine precise spatial coordinates for anywhere on Earth.
Today a full constellation of GPS satellites (about 27) circles the globe twice a day, transmitting radio signals.
When an object on Earth’s surface receives a signal from at least three satellites, its precise geographic coordinates can be determined within centimeters.
In 2000, the Department of Defense lifted its policy of degrading the accuracy of its GPS tracking for civilian use.
From the ensuing technology boom, Google emerged with a trio of products—Earth, Maps, and Street View—that together created the most complete world map.
Released in 2005, Google Earth provided an interactive, 3D image of the globe formed from millions of overlapping satellite photographs overlaid on a 3D digital earth.
Close-up 3D details are added from aerial images that capture the depth of buildings and terrain.
Started in 2006 with vans driving around six major U.S. cities with GPS sensors and multi-lens cameras mounted on top, Google Street View recreates the Earth from eye level.
In 2017 the Street View cameras were updated with laser scanners that record the dimensions and depth of the objects being photographed to create a 3D view along the way.
These cameras, aided by crowdsourced data and machine learning, have mapped millions of miles of roads across 87 countries on all seven continents.
Combined with Maps, Street View and Earth literally put the world in billions of people’s hands.
It is now possible to navigate and explore nearly anywhere on Earth—try Everest Base Camp or Rome’s Coliseum—with a click and zoom.
The Longitude Problem
In 1714, the English government offered a £20,000 reward (about £1.5 million today) to anyone who could solve a problem that had baffled scientists and sailors for centuries: how to determine longitude—distance to the east or west—at sea.
Since antiquity navigators had been able to find their latitude fairly easily using celestial navigation.
But knowing how far you’d traveled on the globe’s east-west axis also required knowing the time of day at a set location to compare to the local time of the ship (determined by the sun).
This required a clock to track that reference time, but the pendulum clocks of the era did not accurately keep time aboard a rocking ship.
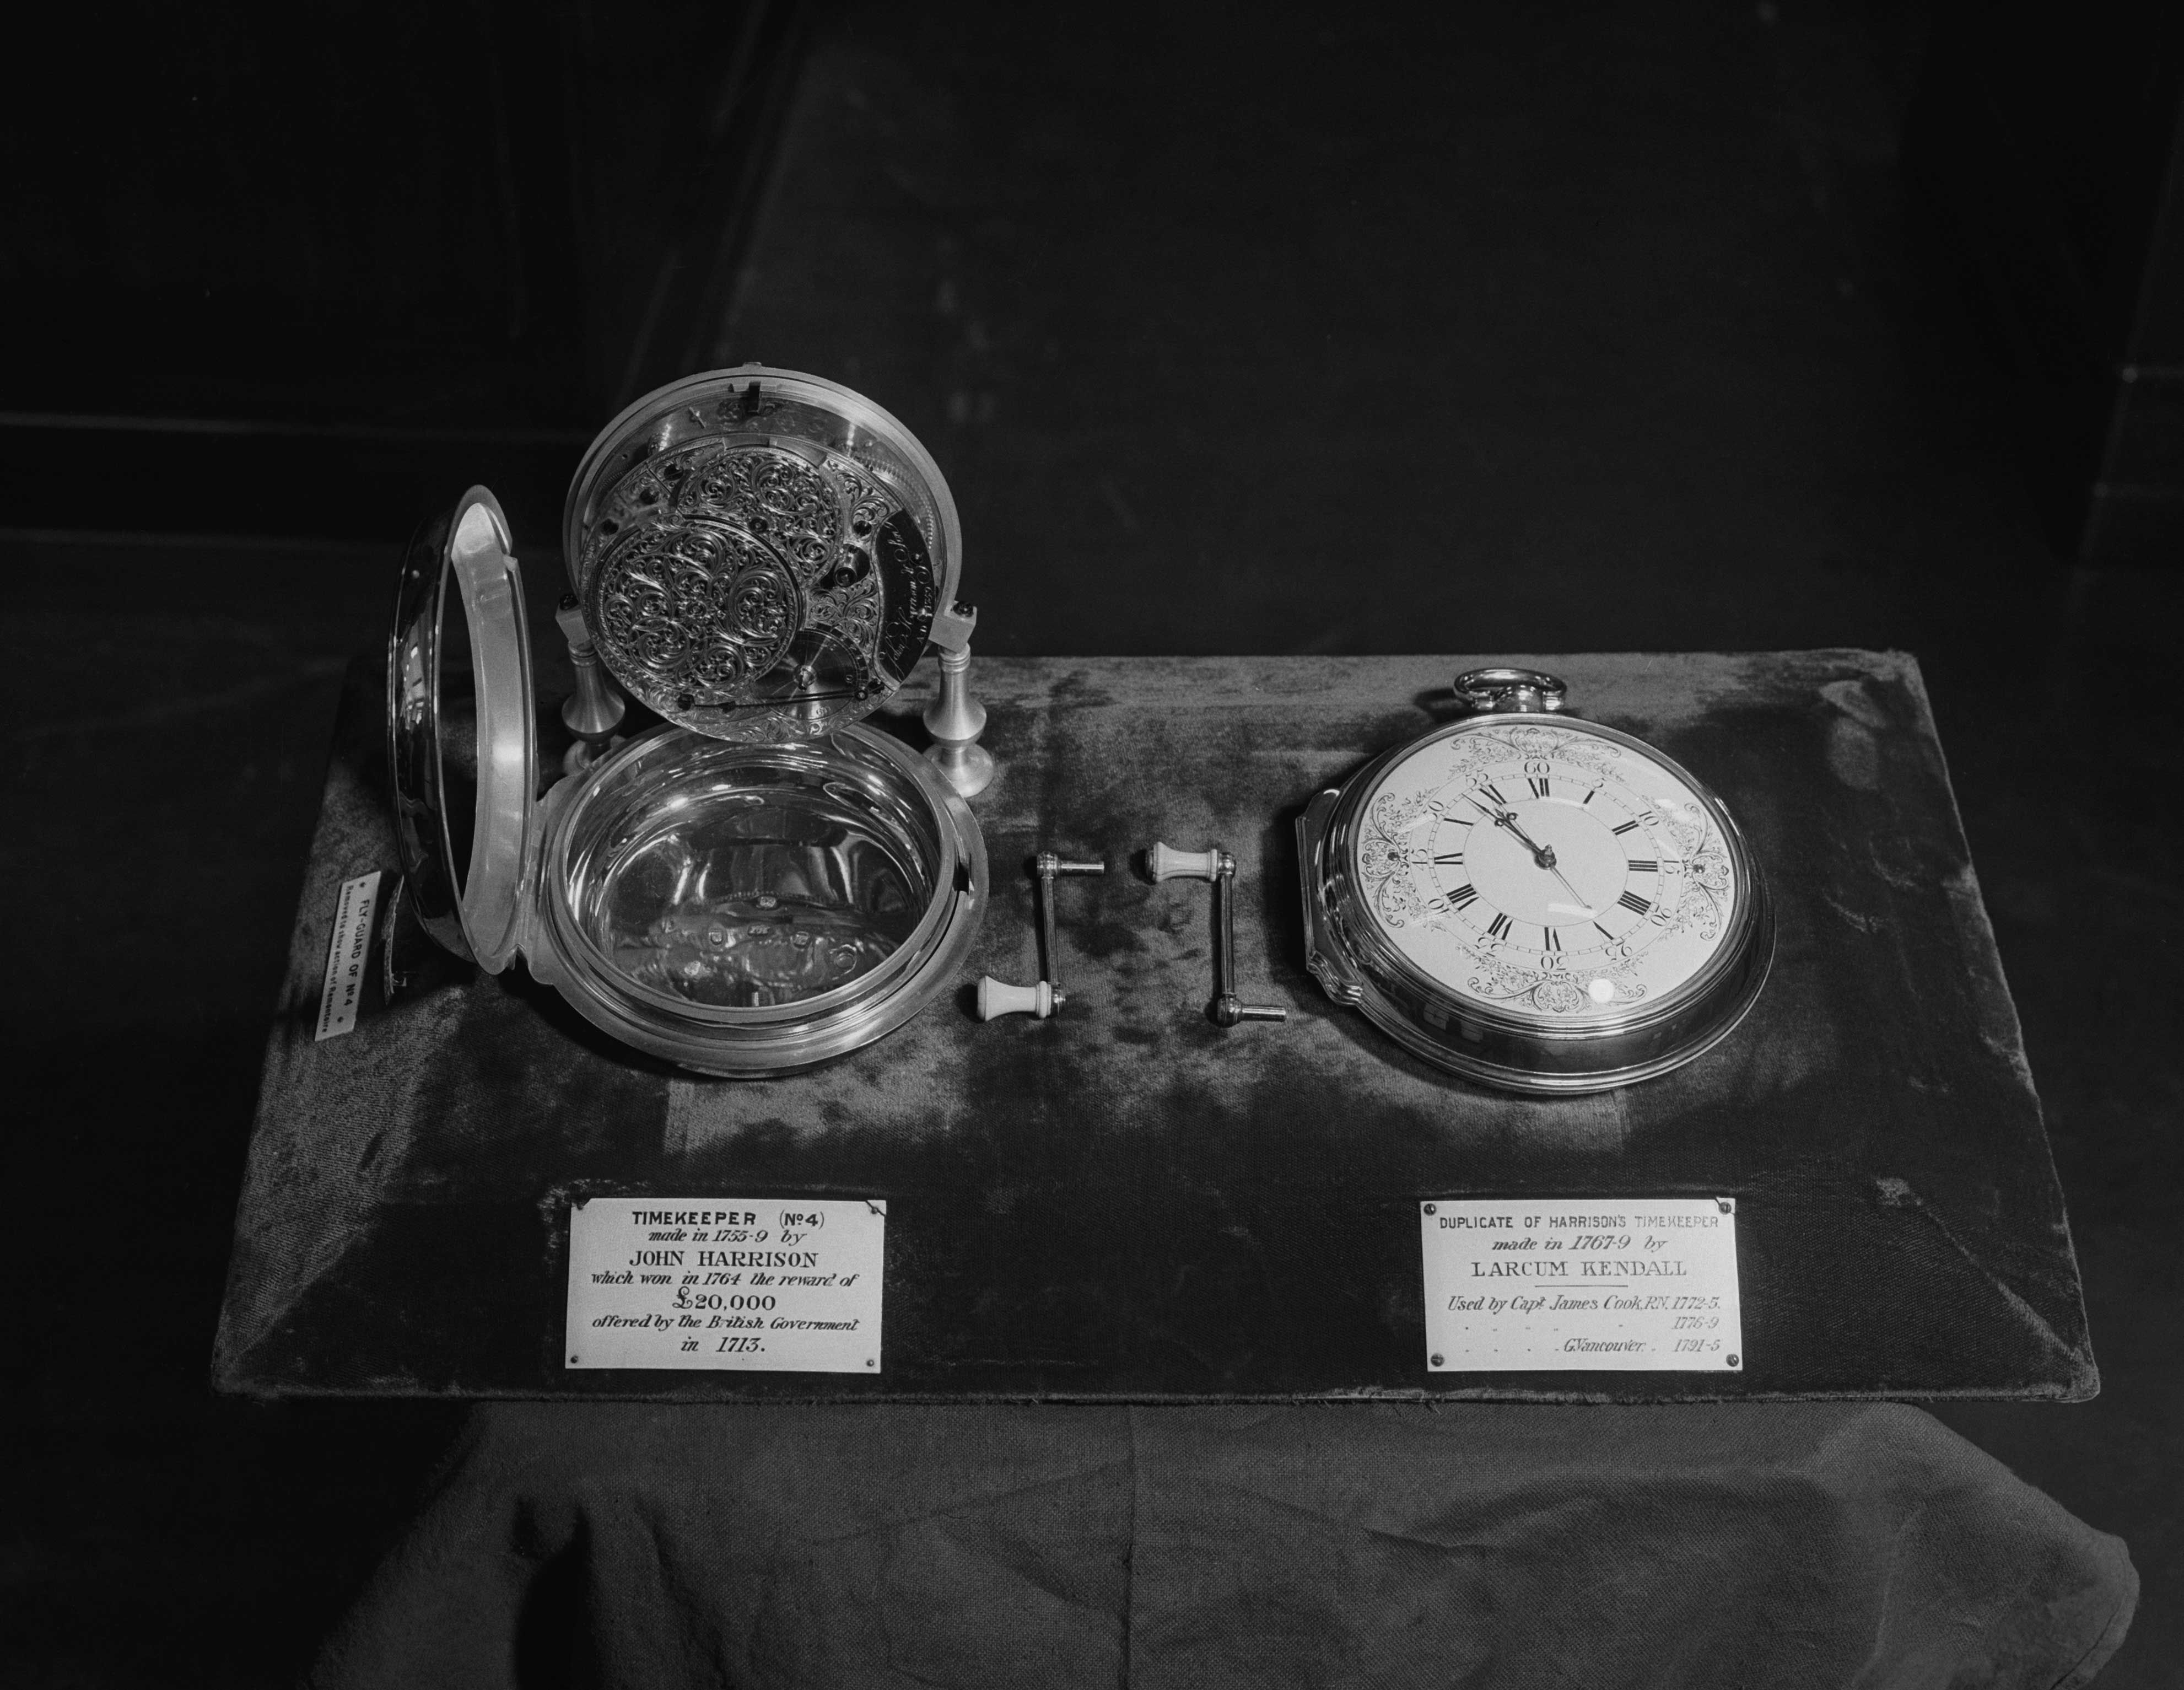
It took until 1761, when self-taught English clockmaker finally cracked the longitude problem—to the approval of England's Board of Longitude—with a mechanical clock that could reliably keep time at sea.
Harrison spent 40 years of his life developing his revolutionary sea clock, called a marine chronometer.
Monty Fresco/Topical Press Agency/Hulton Archive/Getty Images
Having spent decades developing prototypes, Harrison had a breakthrough when he discovered that high frequency oscillations were more stable than larger clocks, so he shrunk the device to speed up the vibration—it ticked five times per second.
The new “sea watch” looked similar to a pocket watch, but it was far more accurate than any timekeeping device at the time.
In 1765, the high-tech device was tested on a transatlantic voyage to the West Indies and passed with flying colors.
The chronometer achieved an unheard of precision of one second per month, allowing the navigator, Harrison’s son, to predict his landfall within a single mile.
The chronometer eventually became the standard tool for navigators to find their longitude at sea, and it remained so until it was replaced with radio signals in the early 20th century.
Links :