A Hydrospatial Information System for multidimensional data.
Science Sisters – Oceanography and Hydrography
Science Sisters – Oceanography and Hydrography
From Hydro by Rafael Ponce
The First Steps to Going Beyond Charting
Hydrographic offices (HOs) today exist in a world of accelerating technological change that is influencing human behaviour and creating new needs and ways of exploiting data to understand our world.
HOs have traditionally been the producers of nautical information for safety of navigation.
By the end of the 20th century, with the appearance of the IHO S-57 Standard, their main challenge was to evolve into a central database production system.
Now, the critical challenge and opportunity is to evolve from there into a true geospatial agency, developing a hydrospatial information system (HIS) capable of providing products and services for multidimensional analysis and evidence-based decision-making, to support the growing Blue Economy and the United Nations (UN) Sustainable Development Goals (SDGs), through apps and web browsers at the "speed of trust."
The technology to do this is here today; it is a matter of vision and desire to propel HOs and their customers toward the next frontier.
Hydrography is defined in the International Hydrographic Organization (IHO) S-32 Hydrographic Dictionary (IHO, 2019a) as: "The branch of applied sciences which deals with the measurement and description of the physical features of oceans, seas, coastal areas, lakes and rivers, as well as with the prediction of their change over time, for the primary purpose of safety of navigation and in support of all other marine activities, including economic development, security and defence, scientific research, and environmental protection."
Perhaps the most important data asset that a HO possesses is bathymetry.
Bathymetry takes a lot of effort and dedication to collect – in the past with mechanical methods such as rods and lead lines, and today with sound, laser and imagery.
The final result is a number consisting of a measurement at a specific location and time.
Underwater Acoustic Signals
While there used to be just a few of these numbers, due to the effort that they took to collect, with today’s automation there can be billions of measurements.
Regardless of how many depths are collected, their main purpose is to populate a navigational chart, and collecting bathymetry for chart production is considered the traditional use of the data.
However, these same sound signals, or pings, are used for the sea-floor characterization of sub-bottom sediment layers, with sonars used as sediment profilers, often called sub-bottom profilers (SBP).
Using frequencies ranging from 1 to 10kHz, hydrographers can map the seabed and sub-bottom layers from sonar reflections, and obtain a better understanding of the sea floor’s physical properties.
The echoes are displayed graphically on the screen by reconstituting a vertical cross-section of sediment layers.
Using echo amplitude processing techniques and calibrated Sound Bottom Profiles, it is possible to retrieve the reflection and absorption coefficients associated with sediment layers crossed by the signal and to use these to classify the layers and identify sub-bottom areas of interest.
This is particularly relevant in providing additional uses and benefits, including contributing to the establishment of a country’s extended continental shelf, resulting in billions of dollars in economic value.
Chart Production and Location Intelligence
In the late 1990s and early 2000s, the challenge for HOs was to build central database systems from which paper/raster and Electronic Navigational Charts (ENC) and other information products could be created simultaneously.
Some HOs have achieved this; others are in the process of doing so.
In general, nearly all HOs, just like their land-based National Mapping and Geospatial Authority equivalents, understand the advantages of having a central database for the production of a multitude of information products, and the technology to build an enterprise production system is readily available through Geographic Information Systems (GIS).
Of course, we acknowledge the challenge of migrating to a new S-101 production system, but it is moving in slow motion compared to the marine world needs of today, and automation will support a smooth transition when migration to S-101 happens.
Now that we are entering the third decade of the 21st century, the challenge is to evolve the existing chart production system into a location intelligence system.
This will be enabled as production continues to transform through automation and we can focus our resources on expanding the use of hydrographic and oceanographic data in response to new demands from the marine world.
This expansion requires building a spatial data infrastructure (SDI), based on good governance, technology and people, to address these new demands – in this case, a Marine Spatial Data Infrastructure (MSDI).
Like other SDIs, it should utilize the best practices laid out in the UN Global Geospatial Information Management (UN-GGM) Integrated Geospatial Information Framework (IGIF).
An MSDI based on the IGIF will serve as the framework to develop a HIS and distribute new products and services, and to make existing ones available for a much larger user group, significantly raising the level of importance of HOs.
Such an infrastructure also increasingly needs to disseminate results as fast as possible, given the bandwidth of information transfer.
Where this once meant carrying paper surveys from the ship by hand, it is now only limited by the bandwidth of satellite throughput and web-based dissemination (which is rapidly improving through market innovation driven by applications).
This allows for collaboration in real time and helps increase the speed of trust by bringing the experts to the ship virtually, rather than waiting for the next voyage or year.
We can say that oceanography is indispensable for hydrography to be successful.
Physical oceanography parameters (such as pressure, temperature and density) combined with chemical parameters (such as salinity) are used to determine sound velocity profiles which, together with tidal data, help to determine bathymetric measurements.
These datasets, which are already collected by HOs, are very important for other applications and studies.
Biological factors also affect the sound profile, and understanding its variability with tide and wind action often leads to more questions than answers.
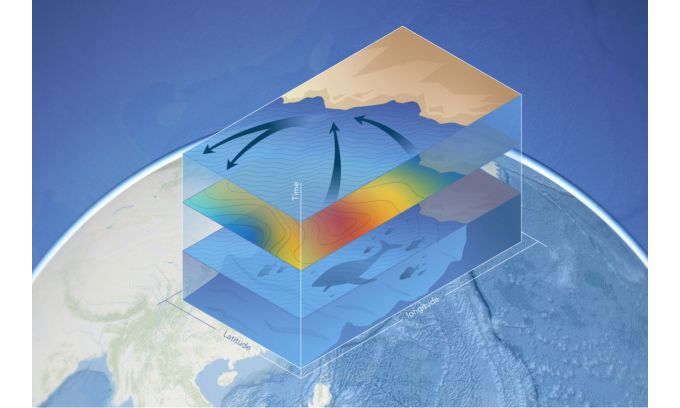
These issues are fundamental to what we might now call ocean weather (Hughes Clarke, 2017), and they contribute to the creation of an oceanographic information system (OIS).
This OIS is also part of the HIS and the next step of a HO toward achieving a digital transformation.
This oceanographic information is part of the location intelligence used in the HIS to identify, understand and predict the occurrence of phenomena, and in turn it too can be shared to the broader marine communities of use.
Multidimensional Marine Data Analysis
Bathymetry, sediment types, tides, currents, water mass physical characteristics and more can be used for marine data analysis.
HOs, through a HIS, play an increasingly important role in this.
Evidence of that relevance can be found in a recent study that shows how the rise in ocean temperatures is affecting sea grass, which together with mangroves and salt marshes stores up to 100 times more carbon than tropical forests, and at 12 times the speed (Aydin, 2017).
In identifying these environmental conditions, sea surface and water column temperatures, along with depth measurements and their trends and other oceanographic parameters, are very important.
For more information, please view the Transforming an MSDI into a Modern Hydrospatial Infrastructure webinar.
The use of bathymetry is fundamental for determining depth zonation for the classification of different types of ecosystems.
Marine mapping using echo-sounding technology detects not only the seabed morphology but also the presence of fauna and other materials in the water column, as mentioned above (volume backscattering).
Based on the deep scattering layer (DSL) and higher-density sound-scattering layer (SSL), scientists can detect animals moving vertically at different times of the day for feeding and protection.
These acoustic signals help to define the epipelagic and mesopelagic depth zones that can be correlated to climate change phenomena and, with the use of GIS models and algorithms in an MSDI, can predict biomass accumulation due to temperature-driven metabolism, growth, and trophic efficiency in the food chain (Costello and Breyer, 2017).
In classifying different pelagic regions, depth for stratifying the ocean is the first required parameter, which is valuable and more difficult to assess accurately as we go deeper and farther away from the coast.
Temperature and salinity measurements (parameters that, depending on the instrument type, are sometimes collected during hydrographic surveys) are also required.
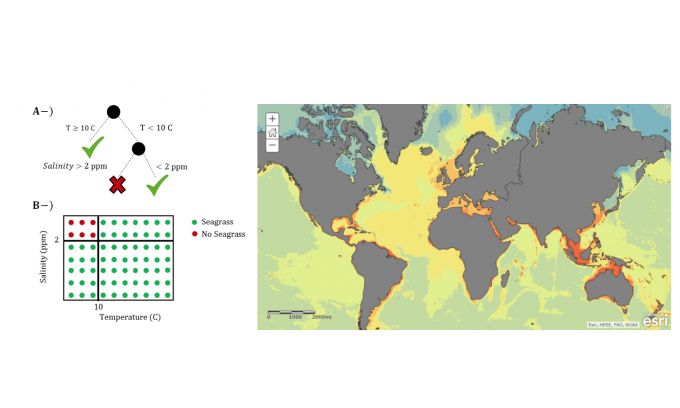
A decision tree, created using ArcGIS Pro, for classification of sea grass.
A statistically-based classification of seabed habitats can be influenced by data contained in a HIS, such as bathymetry, slope, sediment thickness and geomorphology.
Surface primary production, bottom temperature and oxygen level complement the HIS data to identify different seascape types and then define a Marine Protected Area (MPA) network that can be used to analyse environmental variability in the water column and to compare the surface and the seabed.
This analysis allows scientists to classify blocks of ocean water mass as Ecological Marine Units (EMU) and to identify pelagic zones around the world.
EMUs provide a 3D framework up to a depth of 5,500 metres to stratify ocean sampling (Costello et al., 2018), where bathymetry is the geospatial foundation on which everything else is plotted.
These EMUs can be built at any area coverage level, from the worldwide network through the public-private partnership led by the US Geological Survey (USGS) and Esri, using the National Oceanic and Atmospheric Administration’s (NOAA’s) oceanographic data and commissioned by the Group on Earth Observations (GEO), to regional and local networks that can be built through an MSDI.
Combined with the fundamental contribution from a HIS of HOs in partnership with other agencies, these organizations support the wise use of the ocean for development and environmental resilience.
For example, to improve the regional ocean observation within the Marine Biodiversity Observation Network (MBON) (Esri, 2018), the determining seascapes project is funded under a National Aeronautics and Space Administration (NASA) Research Opportunities in Earth and Space Science (ROSES-16) A.50 GEO Work Programme.
This will evaluate dynamic seascapes on a global scale with a case study that focuses on the Arctic.
It includes comparisons of boundaries of surface seascapes with surface EMUs, particularly on seasonal scales, and comparisons of species distributions across classification schemes.
This joint effort will also facilitate the delineation of a useful MBON framework from pole to pole (Wright et al., 2018).
All of these examples highlight the relevance that a HIS, as a component of an MSDI, has in multidimensional marine data analysis and in the creation of new products and services that can be used for a wide variety of applications, involving the monitoring and evolution of our planet, from micro to macro levels and from environmental protection to economic and social development.
The Blue Economy
The World Bank defines the blue economy (World Bank, 2019) as the “sustainable use of ocean resources for economic growth, improved livelihoods and jobs while preserving the health of ocean ecosystem.”
The blue economy concept suggests that better stewardship of ocean resources that allows for sustainable development while managing the exploitation of marine and maritime resources – such as offshore energy, shipping, commercial fishing and mining – will ensure sustainable ocean health and a productive national economy.
The following are some important blue economy facts (The Commonwealth, 2019):
- the total global ocean economy is valued at around US$1.5 trillion per year;
- 80% of global trade by volume is carried by sea;
- fisheries provide 350 million jobs worldwide;
- aquaculture provides 50% of fish for human consumption and is the fastest-growing food sector;
- by 2025, it is estimated that 34% of crude oil production will come from offshore drilling.
Shipping is a fundamental activity that contributes to the blue economy.
However, several measures have to be taken to make it safe, efficient and sustainable, from greenhouse gas (GHG) emissions control to the International Convention for the Prevention of Pollution from Ships (MARPOL) discharge regulations, and from the International Maritime Organization (IMO) International Convention for the Safety of Life at Sea (SOLAS) to e-navigation and port operations.
The shipping industry and naval forces are the main customers of HOs, consuming ENCs, paper and raster charts, and foundational maritime information for Artificial Intelligence (AI) such as finding obstructions to navigation (e.g. shipwrecks).
It is clear that there is no question about the contribution of hydrography to the blue economy.
Up-to-date charts distributed in a timely manner reduce the risk of accidents at sea and improve efficiency with better navigational routes.
These products are also used ashore, where monitoring ship traffic and port operations is important not only for safety and efficiency but also for regulating shipping emissions by including Automatic Identification System (AIS) data (location and speed) in a GIS, with parameters such as engine power and fuel consumption rates to estimate emissions in time and space.
This has been an important application in the Green Ports movement.
A HIS would provide the necessary resources to efficiently plan for navigation routes, ship speeds, bilge water management and port services.
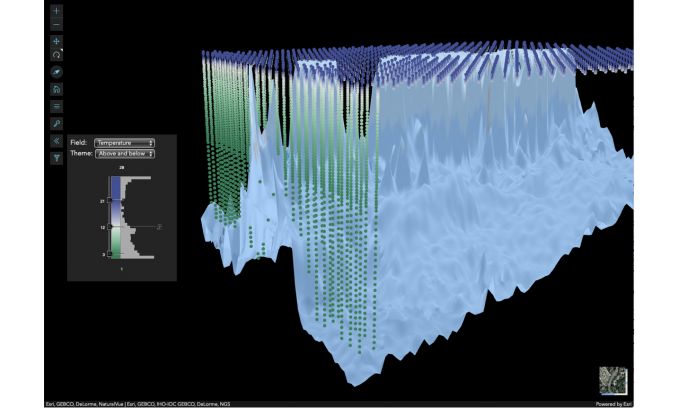
Ecological marine units 3D visualization.
Maritime Boundaries Delimitation
Maritime Boundaries Delimitation
One area that has always been critical for a maritime nation’s development is the realization of its maritime limits and boundaries, which will be defined in the new IHO S-121 Maritime Limits and Boundaries product specification.
Based on the UN Convention on the Law of the Sea (UNCLOS), these maritime limits define what level of jurisdiction and what resources a maritime nation has rights to beyond the shoreline.
Part of the responsibility of determining these limits lies with the national HO, which intervenes in delimiting the baselines.
These baselines determine the establishment of the territorial sea, contiguous zone and exclusive economic zone.
This information, along with the foot of the continental slope derived from bathymetric analysis, is combined with other criteria to determine the extended continental shelf zone.
The proper and accurate justification for claiming these areas is backed up by hydrographic, oceanographic, geological and geodetic data, which therefore has a very significant effect on a nation’s economy, usually measured in billions of dollars, and environmental well-being.
Nautical charts are the legal documents that describe the above-mentioned maritime boundaries.
These lines are used by mariners to know where they are and what legal jurisdiction they are sailing in and thus what activities are allowed within those waters.
The law enforcement agencies also use this geospatial information to ensure that the regulations are not violated and for resource surveillance in the water column, seabed and subsoil.
UN Sustainable Development Goals
At a global scale, nothing is more relevant than the UN Sustainable Development Goals (SDGs), an ambitious call for action to help countries achieve 17 social and economic development objectives by the year 2030.
Location information plays a very important role in measuring and making progress on the SDGs.
This is particularly true in the maritime community to achieve SDG-14, Life below Water.
Hydrographic information (bathymetry) is also the foundation of the ‘Elevation and Depth’ theme.
Comprehensive and authoritative bathymetric data complemented by geological and soils datasets from the seabed in a HIS are essential features to be provided by national HOs.
The nautical chart is also fundamental in the ‘Transport Networks’ theme, to identify marine and inland waterways that impact SDGs 2 (Zero Hunger), 3 (Good Health and Well-Being), 8 (Decent Work and Economic Growth), 9 (Industry, Innovation and Infrastructure) and 11 (Sustainable Cities and Communities) (UN, 2019a).
While a HIS can provide new products and services to support SDG-14, traditional products such as nautical charts have a very significant (and sometimes overlooked) impact on several other SDGs.
An important effort is being made by the UN Statistics Division and the UN-GGIM members to maintain an Open SDG Data Hub, which contains over one million observations.
An SDG indicators API has been created to give programmatic access to the global indicators database using the OpenAPI specification and thus to enable live information services to be provided.
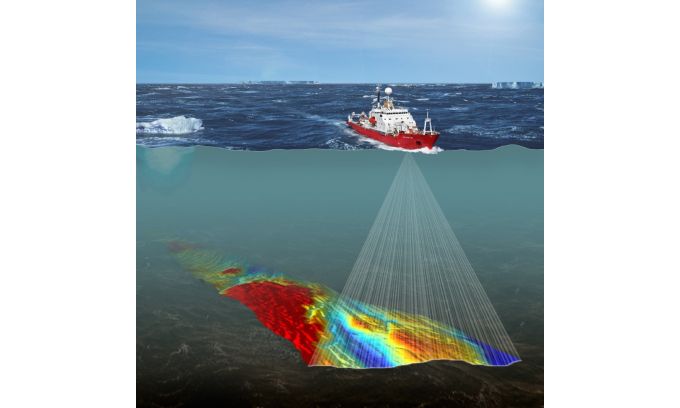
Collecting bathymetric data using multibeam echosounders (MBES).
(Courtesy: iSURVEY Group)
(Courtesy: iSURVEY Group)
Hydrospatial Information System
The UN Economic and Social Commission for Asia and the Pacific (ESCAP) has created a gateway to data portals, enabling people to access and download statistical information and filter it by specific SDG (ESCAP, 2019).
From here, the Resource Watch, which provides hundreds of datasets on the state of the planet and human well-being, can be accessed (ResourceWatch, 2019).
Filtering the data by the world oceans will render dozens of layers containing relevant hydrographic, oceanographic, biological, shipping and other information that users can combine for their own analysis.
This is an example of how a HIS can support this important global endeavour.
A HIS organizes hydrographic, oceanographic and other maritime data to focus on the business value of three main areas: marine environment, the blue economy, and maritime safety and security.
Recognizing that demand for hydrographic data is growing, and developing the technology to address those demands are the first steps to going beyond charting.
A clear vision will be required to establish the strategy for determining the destination of the HOs and the route to successfully reach the next geospatial frontier using HIS.
No comments:
Post a Comment