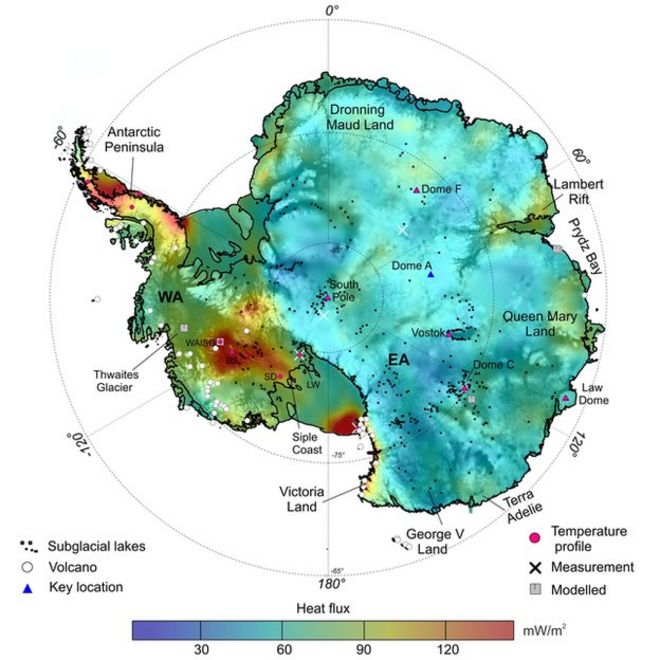
Hotspots are located under West Antarctica; in contrast, the East is broadly relatively cold
This is the best map yet produced of the warmth coming up from the rocks underneath the Antarctic ice sheet.
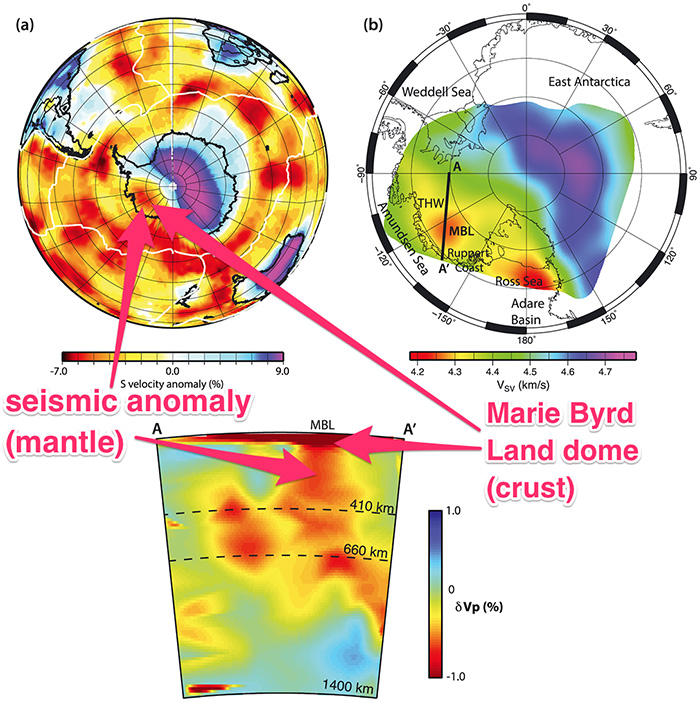
Measurements suggest a hot plume of mantle rock below West Antarctica.
(Helene Seroussi et al./JGR Solid Earth; Business Insider)
(Helene Seroussi et al./JGR Solid Earth; Business Insider)
This "geothermal heat flux" is key data required by scientists in order to model how the White Continent is going to react to climate change.
If the rock bed's temperature is raised, it makes it easier for the ice above to move.
And if global warming is already forcing change on the ice sheet, a higher flux could accelerate matters.
The map was made by researchers at the British Antarctic survey and is published in the journal Geophysical Research Letters.
"The heat coming from the Earth’s interior is important to understand the overall conditions that control the dynamics at the base of the ice sheet and hence the ice flow,” explained Yasmina Martos, currently affiliated to the US space agency.
"If this heat flux is elevated, the ice base can melt and produce water that acts as a sliding film.
"One result of our study is that the heat flux is higher underneath West Antarctica, where more ice is currently melting, than underneath East Antarctica.
"Even a little melting at the base helps the ice sheet to slide faster.
We also identified areas of low heat flux, which will help stabilising the ice sheet," she told BBC News.
/cdn.vox-cdn.com/uploads/chorus_image/image/57420907/greene1HR.0.jpg)
A map of Antarctica shows where Totten Glacier is.
Map: Chad A. Greene, University of Texas Institute for Geophysics, 2017
The West contributes most to sea level rise currently, but this is a consequence of warm ocean water eroding glacier fronts - not from the interior ice sheet being melted by underlying warm rock
No-one has actually drilled through the kilometres of ice in Antarctica to take the temperature of the bed.
Instead, the BAS team inferred the likely warmth of rocks from their magnetism.
This property can be sensed by instruments flown across the surface of the ice sheet by planes.
What happens next is a smart calculation.
Scientists know the temperature (580C) at which hot minerals lose their magnetism, so if they can gauge how close to the rock-ice interface this occurring then they have a means of estimating the heat flux.
The new map is said to represent a 30-50% improvement on previous efforts.
Surface wind causes warm water to upwell at the continental shelf break, the warm water melts Totten Ice Shelf from below, and the glacier responds by speeding up.
Chad A. Greene, University of Texas Institute for Geophysics, 2017
It supports - but with far more detail - the established idea that East and West Antarctica are very different provinces.
The East is a giant chunk of old, cold continental crust.
The West, however, underwent recent rifting in the Cretaceous (100 million years ago) that has pulled it apart.
"This rifting has thinned the crust and brought hot material from deep down in the Earth - from hundreds of km down - to within 100km or so, or even maybe less, of the rock surface," said co-author Tom Jordan.
"It confirms what you would expect from the sparse, exposed geology in West Antarctica where we have volcanoes."
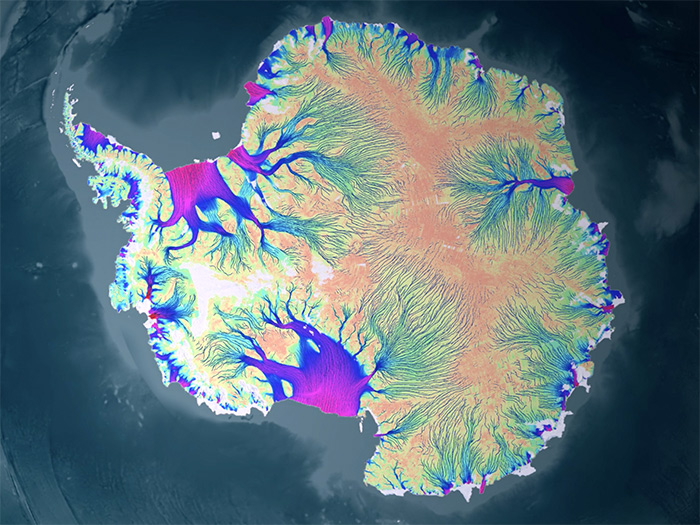
One of the great advances in polar science in the past decade is the recognition that there is a really extensive hydrological network under the ice sheet.
Rivers of water feed huge subglacial lakes that fill and burst their banks periodically. Satellites see the top of the ice sheet heave and relax when this happens.

Illustration of flowing water under the Antarctic ice sheet.
Blue dots indicate lakes, lines show rivers.
Marie Byrd Land is part of the bulging "elbow" leading to the Antarctic Peninsula, left center.
Credit: NASA / NSF/Zina Deretsky
Any projections of future change in Antarctica and its contribution to sea level rise through the loss of ice have to take this basement hydrology into account, and the variations in geothermal heat flux are a critical part of the overall picture.
One research project that will see an immediate benefit from the map’s data is the quest to drill the oldest ice on the continent.
Europe, America, China and others are seeking a location where they can collect a core of frozen material that contains a record of past climate stretching back at least 1.5 million years.
This information - about historic atmospheric conditions including carbon dioxide levels - can be deciphered from tiny air bubbles trapped in the ice.
Map of antarctic ice flow speeds (2011).
But the whole endeavour depends on the base of the ice sheet being undisturbed.
Places with a warm rock underbelly are therefore to be avoided, obviously.
"It is very exciting to see the implications this new heat map has for many communities, including new generations of ice sheet and sea level models," said Dr Martos.
"I am very glad we are contributing an important aspect at unprecedented detail. The Earth’s interior has a lot to tell us in terms on how the ice behaves."
Links :
- BBC : Decoding Antarctica's response to warming / Shells record Antarctic glacier retreat / Big ice melt scenarios 'not plausible' /
- The Verge : East Antarctica’s biggest glacier lost ice because of warm water and strong winds
- Wired : For scientists predicting sea level rise, wind is the biggest unknown
- The Independant : Antarctica is being rapidly melted from below says Nasa, and it thinks it knows why
- Scientific American : How Wind Might Nudge a Sleeping Giant in Antarctica
- The Conversation : Warm waters melting Antarctic ice shelves may have appeared for the first time in over 7,000 years
- Business Insider : Hot rock under Antarctica may be melting some of its ice sheets from the bottom-up
- The Atlantic : A Photo Trip to Antarctica
No comments:
Post a Comment