Saturday, August 17, 2013

Tracking a super storm

Hurricane Sandy's near-surface winds are visible in this NASA GEOS-5
global atmosphere model computer simulation that runs from Oct. 26 to Oct. 31, 2012.

The model works by dividing Earth's atmosphere into a virtual grid of stacked boxes.
A supercomputer then solves mathematical equations inside each box to create a weather forecast predicting Sandy's structure, path and other traits.
The NASA model not only produced an accurate track of Sandy, but also captured fine-scale details of the storm's changing intensity and winds.


Friday, August 16, 2013

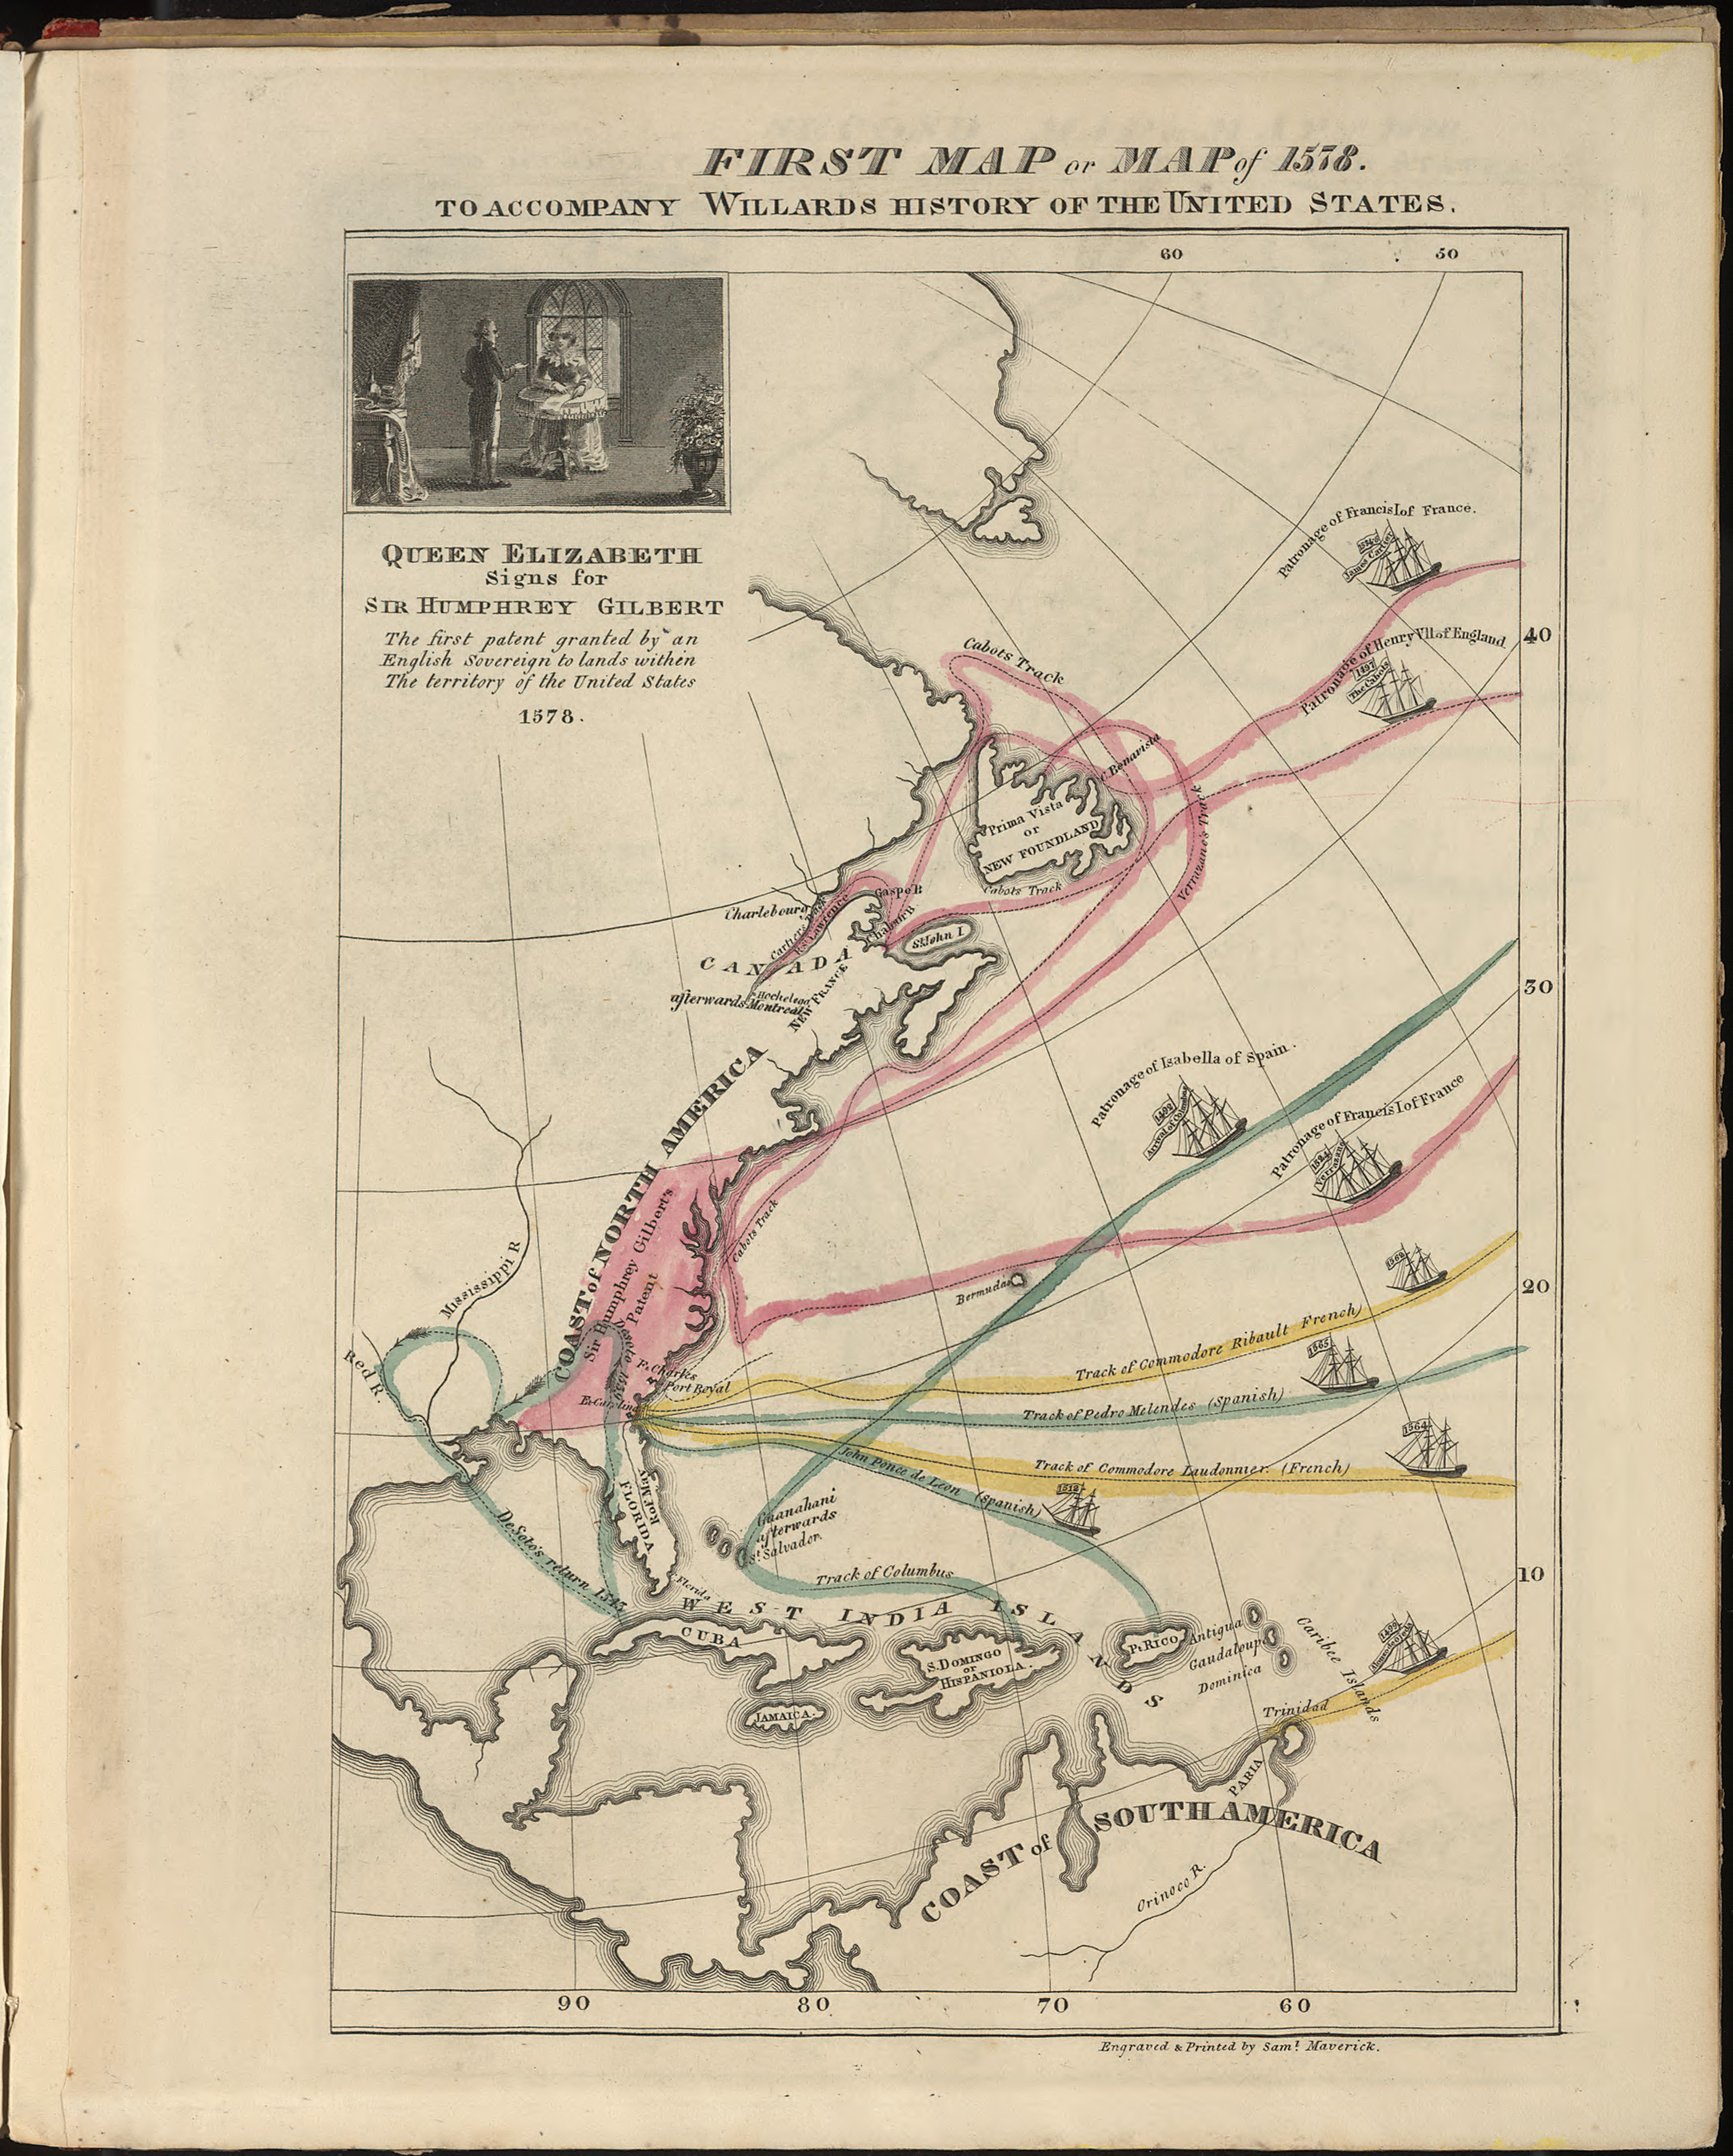
First map of American History

First Map, or, Map of 1578 to Accompany Willard's History of the United States
Emma Willard, “First” Map of American History
see David Rumsey collection

“Willard’s second map in the atlas marked the earliest voyages to America, and took pains to represent change over time. Note the inclusion of failed voyages and settlements.”

Links :

Thursday, August 15, 2013

Pollution of Indonesian waters on full display in surf photos

 Local Indonesian ripper, Dede Suryana, dodging a hefty lip and the unfortunate byproduct of human beings.
Photo: Noyle

From PSFK

Once known for its pristine beaches, Untung Jawa Island, just an hour ride from Jakarta, is now known as ‘trash island’ with hundreds of tons of plastic, styrofoam, and the occasional dead body washing ashore, according to The Asia Sentinel.
Indonesia is a paradise for surfers that travel to remote islands to surf perfect waves but the idilic scenario you’d expect is ruined here with the repulsive debris floating around like the native fauna.

After flights, layovers, car rides, and boat trips, things got serious somewhere in Indonesia.
Photo: Noyle

Hawaiian based surf photographer Zak Noyle captured in stunning shots of how the ocean swell brought massive surges of trash when he was shooting Indonesian surfer Dede Surinaya in a remote bay near Java.

Bede Durbide, all style in the tube.
Photo: Noyle

Tourism is the country’s fifth-largest foreign currency earner and in danger of being ruined by the polluted ‘Wonderful Indonesia’ image.
This was a dangerous shoot because there were large objects in the water, including tree trunks, Noyle said to Surfer Magazine.
“But it was worthwhile because of the international response generated by the images.”


Wednesday, August 14, 2013

Explore the ocean floor via live cam, in high definition, right now

Underwater live stream
From io9

Stop what you're doing and watch this.
Below the fold are three high-definition streams of the ocean floor, currently broadcasting LIVE via NOAA's new 6,000-meter remotely operated vehicle (ROV), Deep Discoverer.
It's... well... let's just say you might want to clear your schedule for the day.

The Northeast U.S. Canyons Expedition is one of the first exploration missions that lets onshore audiences tune in live, with access to real-time, high-quality video footage from deepwater areas.


For the last month or so, scientists aboard NOAA Ship Okeanos Explorer have been working with onshore technicians to better understand the ecology of one of the most poorly understood locations on Earth: the ocean floor.
The mission's specific goal is to explore deep-sea habitats and marine life along the Northeast U.S. Canyons and at Mytilus Seamount, regions of the seafloor situated a few hundred miles off the coast of New England.
To do it, researchers are using a brand new 6,000-meter ROV named Deep Discovery and a sweet camera setup to bring the community closer to the science than ever.


The exploration area for this community-driven expedition was identified based on the discussions and information stemming from the May 2011 Atlantic Basin Workshop and priority area input received from other NOAA programs and the management community.
Using this input, and data acquired during previous Atlantic Canyon Undersea Mapping Expeditions (ACUMEN Project), NOAA and the broader science community have identified a number of exciting targets to explore during the two cruise legs, commencing the next steps in systematic exploration.
In the coming weeks, we expect to explore cold seeps, deep coral communities, undersea canyons, landslide features, and a seamount.

Featured below is the first of three (!) live feeds, all currently streaming live via Okeanos.
The dives are being narrated by mission scientists and technicians.
I've been watching all morning (several hours at this point) and it has been consistently engaging.
Be warned: these feeds are MAJOR time-sucks.
Tons of deep-sea marine life to be had (a swordfish literally just swam by on feed 1) and giddy scientists to narrate the whole thing.
The excitement is palpable.
You feel like you're on a deep sea dive, trying to get squids like the one up top to chase laser pointers (oh yeah, the ROV is equipped with a laser pointer).
It's genuinely incredible.

Enough talk. Here's the primary feed along with the description for today's dive:

Visit http://www.explorationnow.org for live video streams from ships of research and exploration around the world.
This is an Expedition Summary of the recent work by the E/V Nautilus, presented by Exploration Now.

Read more about the mission and its educational aims over at NOAA,
where you can also watch ALL THREE FEEDS SIMULTANEOUSLY.

Tuesday, August 13, 2013

USGS maps California seafloor in unprecedented detail


>>> geolocalization with the Marine GeoGarage <<<

From RedOrbit (Peter Suciu)

While California offers an impressive shoreline, new research has been able to look beyond just the surface and has been used to reveal the hidden seafloor in unprecedented detail.

Three new products in an ongoing series were released last week by the US Geological Survey (USGS), and include a map set for the area offshore of Carpinteria, a catalog of data layers for geographic information systems and even a collection of videos and photos of the seafloor along the entire Golden State.

This data is available now as part of the California Seafloor Mapping Program from the Pacific Coastal & Marine Science Center.
These map sheets display seafloor morphology and character and further identify potential marine habitats. The maps also illustrate both surficial seafloor geology and shallow subsurface geology.

These three new USGS products were released on August 9, 2013.
The CSMP is a cooperative program to create a comprehensive coastal/marine geologic and habitat base map series for all of California’s State waters.


>>> geolocalization with the Marine GeoGarage <<<

The CSMP was originally developed to support the design and monitoring of marine reserves, through the Marine Life Protection Act (MLPA), but the accurate statewide mapping of the seafloor will also be used to improve climate change and ocean circulation models, and help evaluate the potential for ocean energy.
Moreover, it will be used to improve the understanding of the ecosystem dynamics, identify submerged faults and improve the understanding of tsunami potential.

It will further help improve the understanding of sediment transport and sand delivery, and could be used to enable more effective regulation of offshore development, while helping improve maritime safety.

The USGS is just one key partner in the CSMP, which has been a historically ambitious collaboration between state and federal agencies, academia, as well as the private sector.

“A program of this vast scope can’t be accomplished by any one organization.
By working with other government agencies, universities, and private industry the USGS could fully leverage all its resources,” said USGS Pacific Region Director Mark Sogge in a statement.
“Each organization brings to the table a unique and complementary set of resources, skills, and know-how.”


>>> geolocalization with the Marine GeoGarage <<<

The programs include the USGS California Seafloor Mapping Program Map Series, the USGS California Seafloor Mapping Program Data Catalog and the USGS California Seafloor Mapping Program Video & Photo Portal.

These include three map sets that were created through the collection, integration, interpretation, and visualization of swath sonar data, acoustic backscatter, seafloor video, seafloor photography, high-resolution seismic-reflection profiles, and bottom-sediment sampling data.
The Offshore of Carpinteria map area lies within the central Santa Barbara Channel region of the Southern California Bight.

An additional 14 other map sets are being formatted for publication; the full California State Waters Map Series will comprise 83 such seafloor maps that span the state’s entire coast.

The data catalog further includes large geospatial digital files including bathymetry, acoustic backscatter, offshore geology and geomorphology, faults, folds, potential marine habitats, seafloor character, sediment thickness, as well as visual observations of bottom habitat from video.
This catalog (USGS Data Series 781) provides all GIS data layers with the map sets published by the California Seafloor Mapping Program.

The Video and Photo Portal now provides video and photographs of seafloor segments off California, from the US-Mexico border to the Oregon State line.
The images presented in this micro-site were taken by video and still cameras that were towed approximately three feet above the seafloor.
More than 340 miles of trackline video and 87,000 photographs have been taken to date.

Part of the USGS’s goal of this project is to ensure that the coastline is protected for years to come.

“The Ocean Protection Council recognized early on that seafloor habitats and geology were a fundamental data gap in ocean management,” added California’s Secretary for Natural Resources and Ocean Protection Council Chair John Laird.
“After an impressive effort by many partners to collect and interpret the data, the maps being produced now are providing pioneering science that’s changing the way we manage our oceans.”