Tuesday, March 2, 2021

ClimaCell, an ambitious private weather firm, plans to launch its own satellites

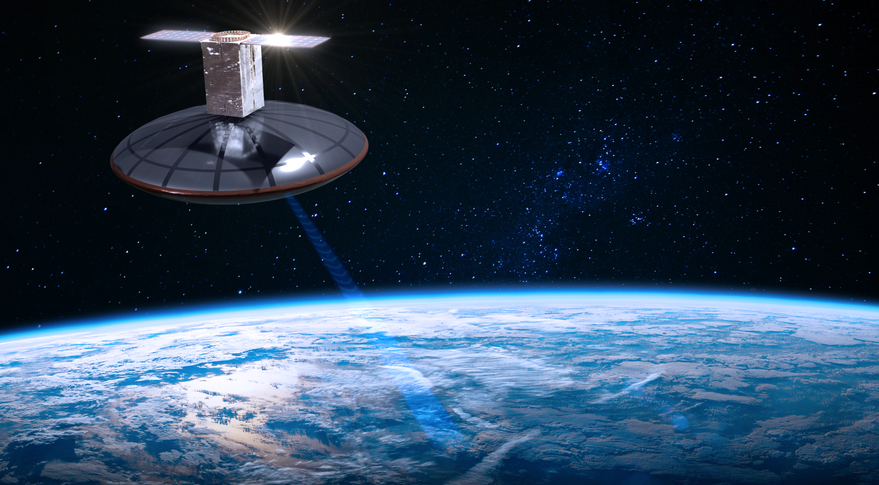
 Artistic rendering of a ClimaCell satellite. (ClimaCell)
 
From WP by Andrew Fredman

The company would be the first to operate a satellite fleet to improve its own forecasts, rather than selling the data to others


ClimaCell, a growing private weather company based in Boston whose customers include airlines, maritime shipping firms and everyday consumers, plans to spend $150 million during the next few years to launch its own satellite radar constellation.
The goal, company leaders said in an interview, is to make its own forecasts more reliable, thereby benefiting its clients, the public through its weather app and policymakers.

This aim contrasts with the business of most, if not all, space companies today that are pursuing weather applications. 
These firms, such as GeoOptics and Spire, have business models based on selling the data for others to use in forecasting the weather, with customers that include federal agencies.
However, ClimaCell would use its own technology, which already includes proprietary weather modeling, to take advantage of the data it gathers from space.

The end result, if all goes well, would be a vertically integrated weather company whose operations range from generating its own data to sifting through that information using computer models and turning that into products aimed at improving how businesses operate.

According to ClimaCell co-founder and chief executive Shimon Elkabetz, ClimaCell has several dozen scientists and engineers now dedicated to developing and eventually deploying a fleet of small space-based weather radars that could gather real-time data of every location on the globe at any time.
This would be a major leap forward for radar coverage over data-sparse regions, he said, such as Africa, South America and the oceans.

The satellites would carry a Ka-band radar instrument, Elkabetz said, which he compared to a research mission that NASA has carried out known as the Global Precipitation Measurement (GPM) satellite.

GPM consists of a dual-frequency radar that allows it to get a three-dimensional view of precipitation falling within a storm, including by seeing the distribution of different droplet sizes within the clouds, according to Dalia Kirschbaum, who heads NASA’s hydrological sciences lab at the Goddard Space Flight Center in Greenbelt, Md.

The downside to GPM is that it is just one satellite. 
“When you have a single orbiting spacecraft, if you don’t get a good [pass over] a storm, then you just miss it,” she said.

The space agency has also launched small satellites, such as rainCube, which was deployed from the International Space Station, to help solve the challenge of building powerful radars in small boxes, Kirschbaum said.
“The instrument will offer similar capabilities” to the radar aboard GPM, Elkabetz said, “in terms of both resolution and sensitivity, but exceed the swath,” or scan footprint, by a factor of more than two.

To accomplish this, the company is planning to use its own technologies to develop a new radar and antenna. ClimaCell is seeking to lower the costs per satellite by at least half compared with the NASA satellite, which scans a location on Earth only every three days.
The cost savings, Elkabetz said, “will allow us to scale this from a single-satellite mission to a constellation of dozens of satellites that enables global coverage with high revisit rates.”

Rei Goffer, co-founder and chief strategy officer at ClimaCell, said revisit times, the interval between instances when the satellite passes over the same location on Earth, would be one hour in the company’s planned satellite constellation.
“We are not going to space just because it’s cool,” Goffer said in an interview, but instead are trying to solve a data gap that could allow the company to make far more accurate forecasts.

Outside experts, such as Brian Weeden of the Secure World Foundation, questioned whether the new satellites would interfere with other spacecraft also operating within the Ka band of spectrum, including planned 5G satellites and other weather satellites already in low Earth orbit.

Elkabetz said he expects to encounter skepticism from those who may not believe that ClimaCell has solved some of the technical challenges in developing and deploying these satellites.
If he were not involved in the project already, he would not believe it, either, he said.

“I respect anyone who thinks it’s difficult, and as we are able to reveal in the future how it works, hopefully people will be able to witness it themselves,” he said in an interview.

Marshall Shepherd, director of the University of Georgia’s atmospheric sciences program, said he sees this project as a way to better predict weather extremes.
“Precipitation is at the heart of many weather-related extremes ranging from flooding to hurricanes, yet is very difficult to measure on global scales,” Shepherd said in an email.

Estimates of rainfall rates on July 8, 2019, a day that brought flooding to the D.C. region, from NASA's Global Precipitation Measurement Core Observatory. (NASA)

“I am not surprised that scholars are exploring new ways to provide measurements with the accuracy and resolution useful for applications.”

ClimaCell has raised a substantial amount of money for a recent entrant into the weather forecasting business: about $112 million in venture capital funding, with the most recent round closing in July 2020.

Elkabetz noted that most of the world still does not have radar coverage, including in Latin America, Africa, the Middle East and Asia.
“The system’s capabilities will enable new modeling and analytics with precision never before available in the developing world,” he said.

“The data will power applications such as monitoring the conditions favorable for locust reproduction and migrations, as well as conditions that lead to devastating infectious diseases such as malaria, which put millions of lives and livelihoods at risk,” Elkabetz said in a statement.

The satellites could significantly help hurricane forecasts, he said, since they would provide details about the structure and evolution of such storms.
The National Hurricane Center has utilized data from the GPM mission and previous weather satellites for forecasting purposes.

The chief engineer for the program is John Springmann, who has worked with private sector space firms including SpaceFlight industries, which launched the BlackSky constellation.
The team has also been working with Kerri Cahoy, co-director of the small-satellite center at MIT.

ClimaCell is aiming to launch its first radar satellite in the third quarter of 2022.

Through the company’s nonprofit arm known as ClimaCell.org, the satellite data could flow to areas where improved forecasts are desperately needed, mainly in the developing world, Goffer and Elkabetz said.

Links :

Monday, March 1, 2021

Brunt Ice Shelf in Antarctica calves

First imageFirst image of the newly calved Brunt Ice Shelf from Sentinel 2!
Taken (26th Feb) at 09:40:19 UTC.

From BAS

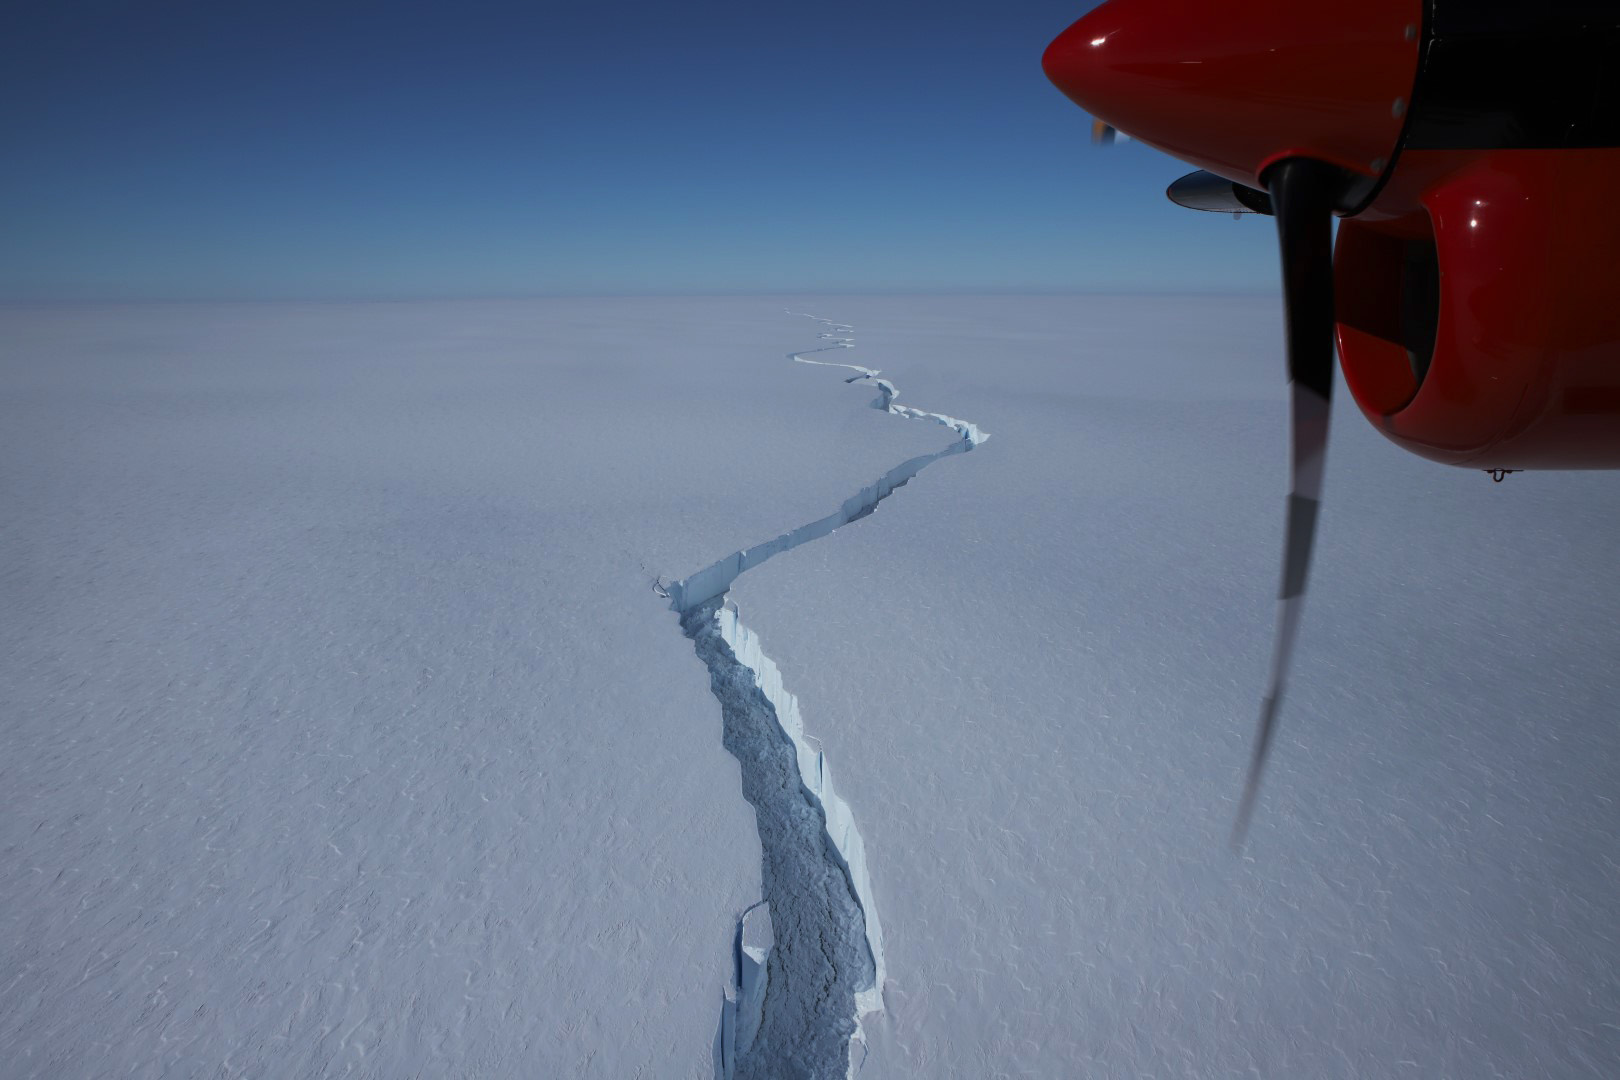
A huge iceberg (1270 km²) the size of the county of Bedfordshire has broken off the 150-m thick Brunt Ice Shelf, almost a decade after scientists at British Antarctic Survey (BAS) first detected growth of vast cracks in the ice.


The Brunt Ice Shelf is the location of British Antarctic Survey’s (BAS) Halley Research Station.
BAS glaciologists, who have been expecting a big calving event for at least a decade, say that the research station is unlikely to be affected by the current calving.
The 12-person team working at the station left mid-February by BAS Twin Otter aircraft.
The station is now closed for the Antarctic winter.

North Rift crack photographed by Halley team in January 2021
The first indication that a calving event was imminent came in November 2020 when a new chasm – called North Rift – headed towards another large chasm near the Stancomb-Wills Glacier Tongue 35 km away.
North Rift is the third major crack through the ice shelf to become active in the last decade.

During January, this rift pushed northeast at up to 1 km per day, cutting through the 150-m thick floating ice shelf.
The iceberg was formed when the crack widened several hundred metres in a few hours on the morning of 26th Feb, releasing it from the rest of floating ice shelf.
 
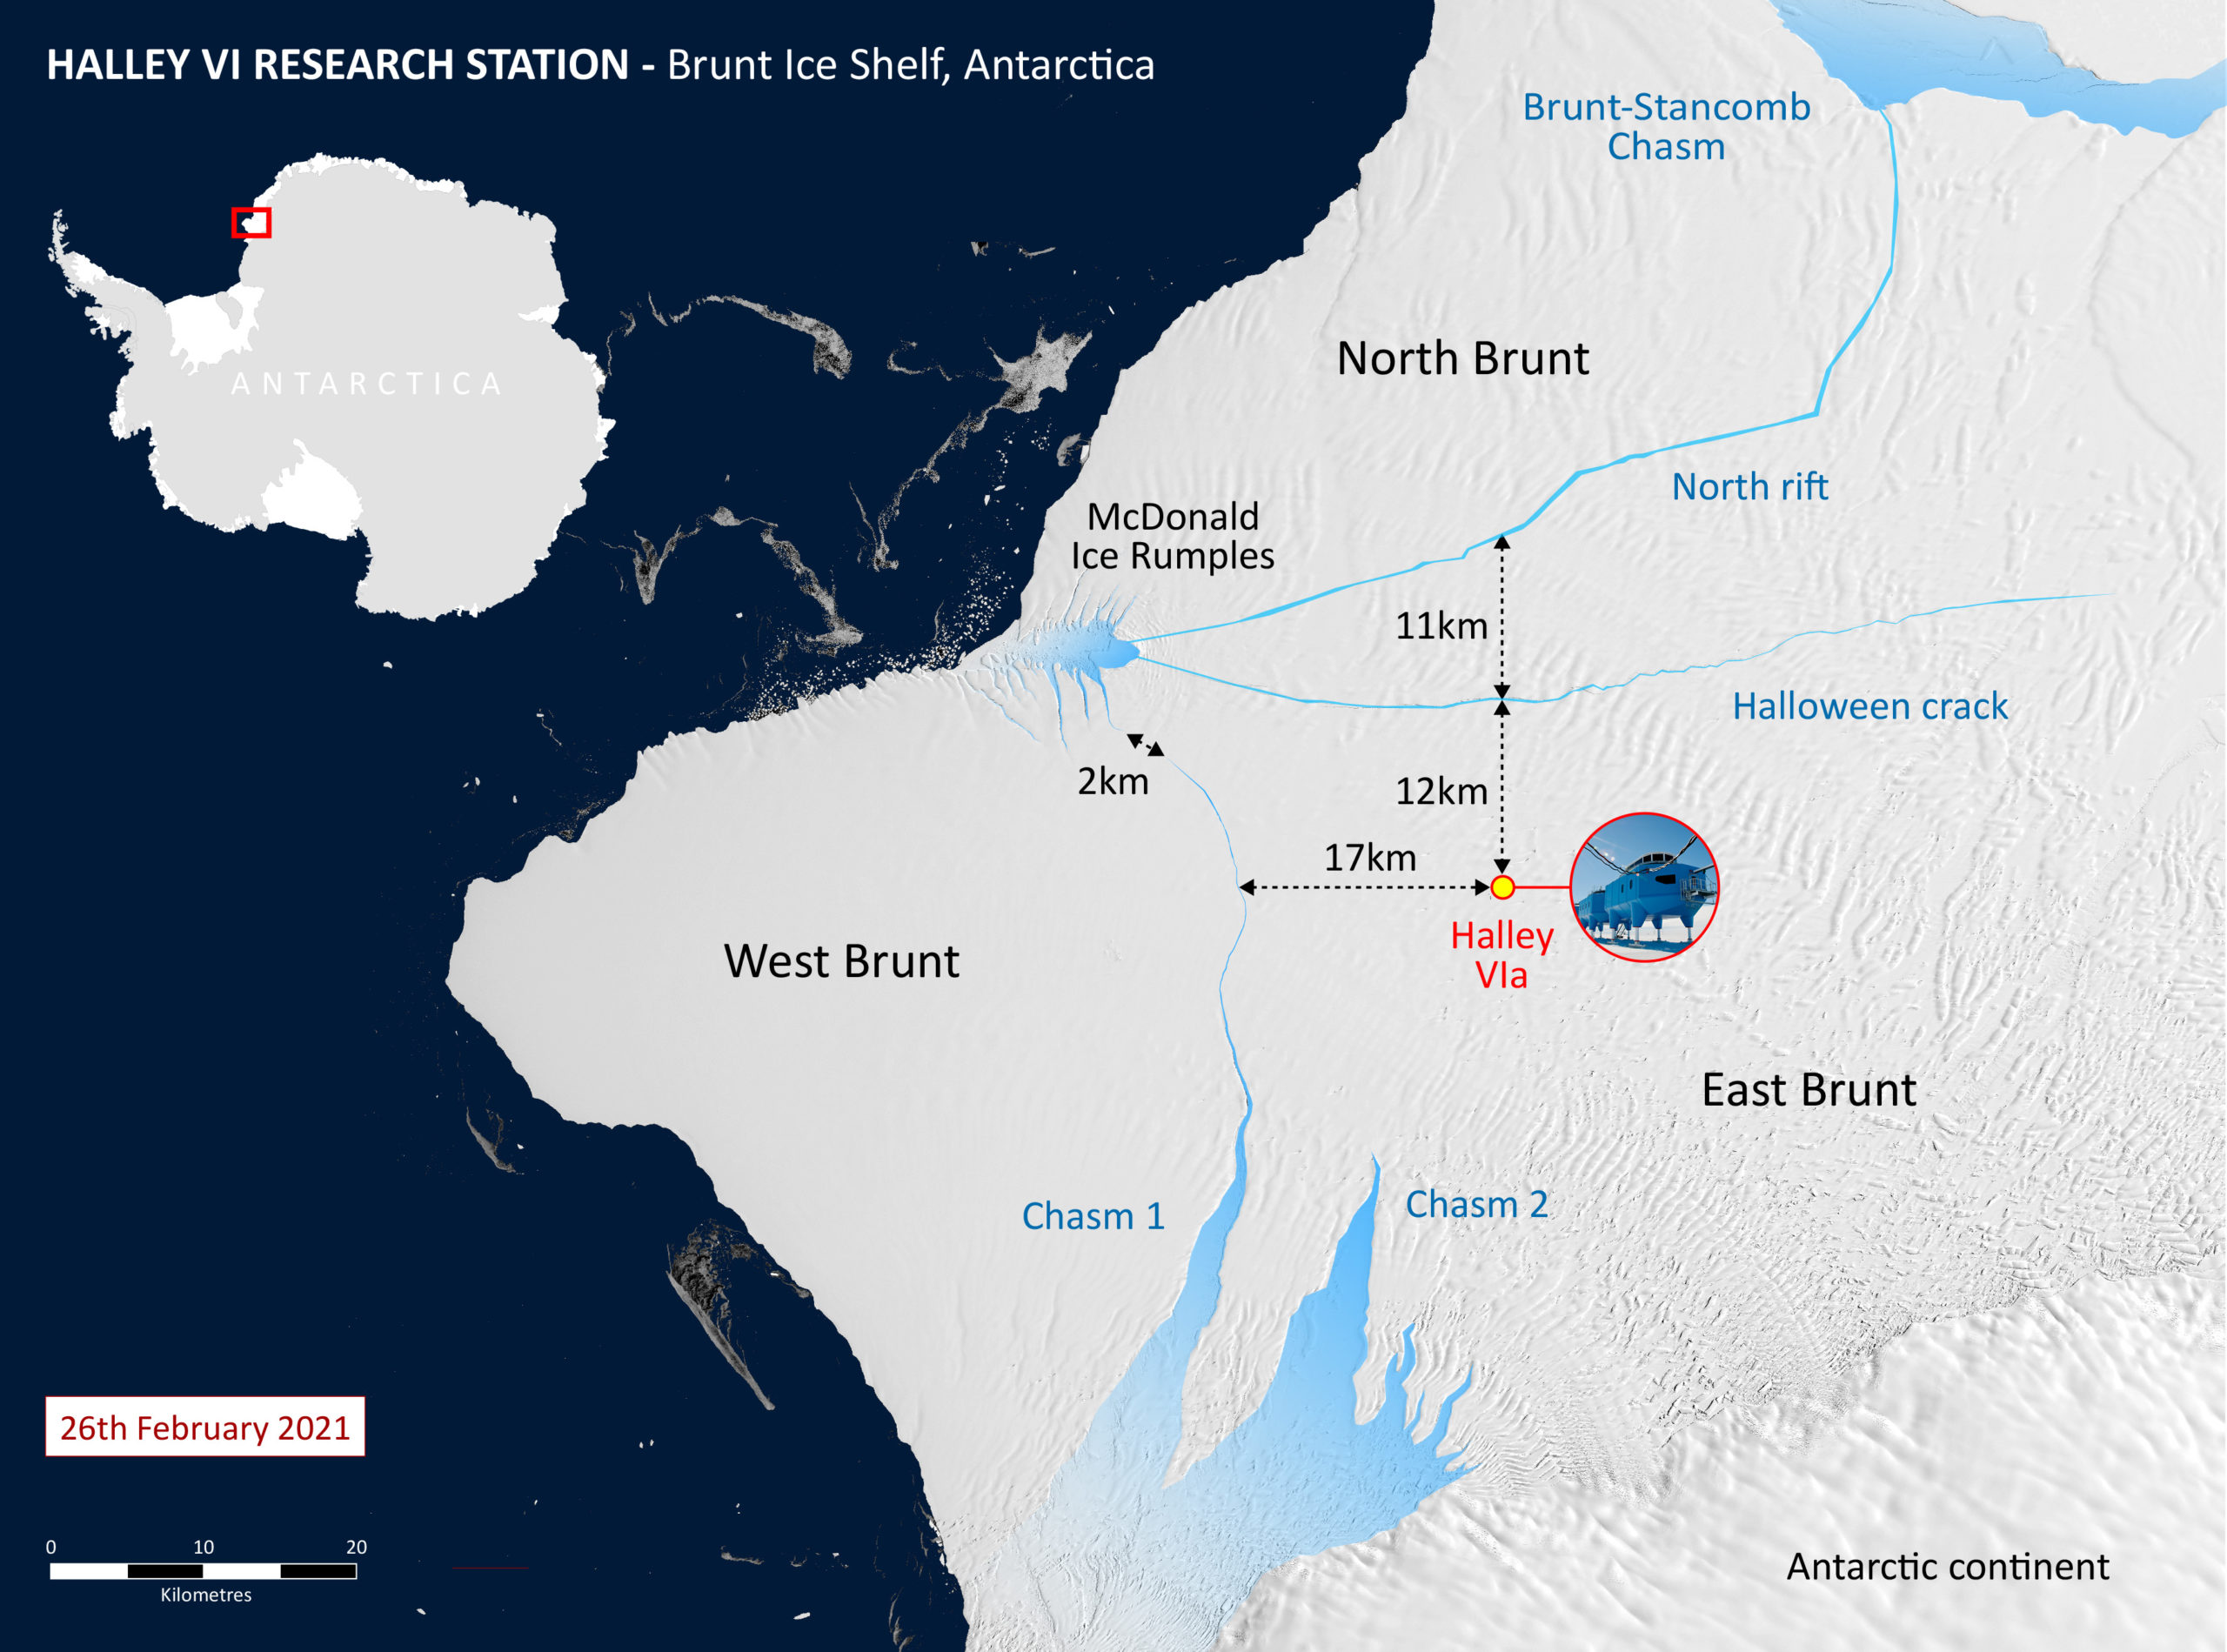
Map of Brunt ice shelf and Halley Research Station
The glaciological structure of this vast floating ice shelf is complex, and the impact of ‘calving’ events is unpredictable.
In 2016, BAS took the precaution of relocating Halley Research Station 32 km inland to avoid the paths of ‘Chasm 1’ and ‘Halloween Crack’.

Since 2017, staff have been deployed to the station only during the Antarctic summer, because during the dark winter months evacuation would be difficult.
‘Chasm 1’ and ‘Halloween Crack’ have not grown in the last 18 months.

Professor Dame Jane Francis, Director of British Antarctic Survey says:
“Our teams at BAS have been prepared for the calving of an iceberg from Brunt Ice Shelf for years.
We monitor the ice shelf daily using an automated network of high-precision GPS instruments that surround the station, these measure how the ice shelf is deforming and moving.
We also use satellite images from ESA, NASA and the German satellite TerraSAR-X.
All the data are sent back to Cambridge for analysis, so we know what’s happening even in the Antarctic winter, when there are no staff on the station, it’s pitch black, and the temperature falls below minus 50 degrees C (or -58F).

“Over coming weeks or months, the iceberg may move away; or it could run aground and remain close to Brunt Ice Shelf.
Halley Station is located inland of all the active chasms, on the part of the ice shelf that remains connected to the continent.
Our network of GPS instruments will give us early warning if the calving of this iceberg causes changes in the ice around our station.”

Simon Garrod, Director of Operations at British Antarctic Survey adds:
“This is a dynamic situation. Four years ago we moved Halley Research Station inland to ensure that it would not be carried away when an iceberg eventually formed. That was a wise decision.
Our job now is to keep a close eye on the situation and assess any potential impact of the present calving on the remaining ice shelf.
We continuously review our contingency plans to ensure the safety of our staff, protect our research station, and maintain the delivery of the science we undertake at Halley.”

More information


About Halley VI 

Halley VI Research Station is an internationally important platform for, atmospheric and space weather observation in a climate-sensitive zone.
In 2013, the station attained the World Meteorological Organization (WMO) Global Atmosphere Watch (GAW) Global station status, becoming the 29th in the world and 3rd in Antarctica.

Halley VI Research Station sits on Antarctica’s up to 150–m thick Brunt Ice Shelf.
This floating ice shelf flows at a rate of up to 2 km per year west towards the sea where, at irregular intervals, it calves off as icebergs.

Long-term monitoring of the natural changes that occur in the ice shelf has revealed changes, including growth of a recently-formed chasm, the North Rift.
Halley VI Research Station has been unoccupied during the last four winters because of the complex and unpredictable glaciological situation.

Change in the ice at Halley is a natural process and there is no connection to the calving events seen on Larsen C Ice Shelf, and no evidence that climate change has played a significant role.

During the 2016-17 Antarctic Summer season (Nov-March), in anticipation of calving, the eight station modules were uncoupled and transported by tractor to a safer location upstream of Chasm-1.

Over the summer 18/19, BAS installed an autonomous power generation and management system – Halley Automation project – which provides a suite of scientific instruments with power even when we have no staff at the station.
This system has proved effective in running through more than eight months of darkness, extreme cold, high winds and blowing snow and delivering important data back to UK.

There have been six Halley research stations on the Brunt Ice Shelf since 1956.

About Chasm 1


In 2012, satellite monitoring revealed the first signs of change in a chasm (Chasm 1) that had lain dormant for at least 35 years.  This change had implications for the operation of Halley VI Research Station.
In the 2015/16 field season, glaciologists used ice penetrating radar technologies to ‘ground truth’ satellite images and to calculate the most likely path and speed of Chasm 1.
Chasm 1 grew up until 2019 but has not moved for the past 18 months.
There is now 2 km of ice holding this iceberg in place.

About Halloween Crack

In October 2016, a new crack was detected some 17 km to the north of the research station across the route sometimes used to resupply Halley.  The ‘Halloween Crack’ continues to widen and a second large iceberg may calve to the north’.
The tip of Halloween Crack is also currently static.

About North Rift Crack


In November 2020, a new chasm, known as the North Rift opened and started extending towards Brunt-Stancomb Chasm.
The Brunt Ice Shelf is probably the most closely monitored ice shelf on Earth.
A network of 16 GPS instruments measure the deformation of the ice and report this back on a daily basis.
European Space Agency satellite imagery (Sentinel 2), TerraSAR-X, NASA Worldview satellite images, US Landsat 8 images, ground penetrating radar, and on-site drone footage have been critical in providing the basis for early warning of changes to the Brunt Ice Shelf.
These data have provided science teams with a number of ways to measure the width of Chasm 1 and changes to the Halloween Crack and North Rift crack, with very high precision.
In addition, scientists have used computer models and bathymetric maps to predict how close the ice shelf was to calving.

About Halley science 
 
Ozone measurements that have been made continuously at Halley since 1956 (which led to the discovery of the ozone hole in 1985, and since that time, its slow progress towards recovery)
Monitoring of space weather undertaken at Halley contributes to the Space Environment Impacts Expert Group that provides advice to UK Government on the impact of space weather on UK infrastructure and business.
 

Sunday, February 28, 2021

The Long Leg , Edward Hopper (1935)

Messing about on boats all summer is a holiday lived in the present; that’s the sense of this picture.
The boat remains still; it is the wind and water that move it along.
Hopper’s coolly beautiful painting of a sailboat off the New England shore perfectly expresses this curious fact about sailing.
And in conditions like these – a hot blue day, windless, the sun beating down on the blanched sand – the boat is lying almost motionless to one side, solitary as the characteristic Hopper lighthouse in the background.
Like the water itself, the painting is almost entirely composed in shades of blue.
 
Links :

Saturday, February 27, 2021

Underwater photographer of the year 2021

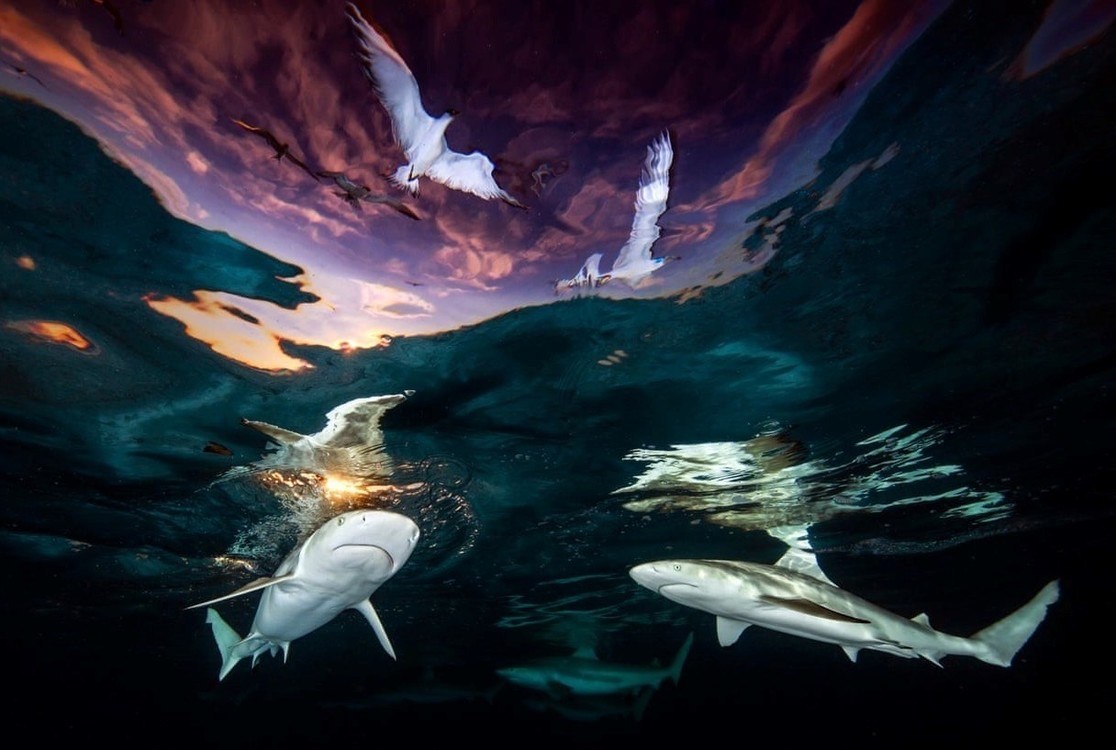
Renee Capolzzola (USA), for her graceful image: “Shark’s Skylight“.
 
The full set of UPY2021 results is now available to view in the Winners’ gallery, and the complete collection is available to download and keep in the free Yearbook.
The UPY team would like to thank all the talented photographers who supported this year’s competition with their pictures, especially in these challenging times.
We hope that this year’s stunning collection of winning images provides a welcome escape to everyone who enjoys them and a chance to reconnect with the underwater world.

Friday, February 26, 2021

The Titanic disaster and its aftermath

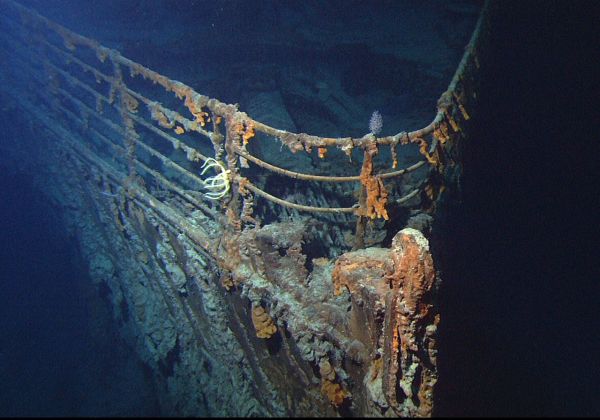
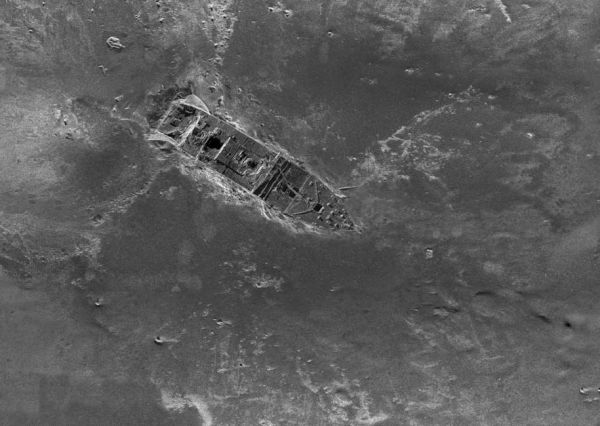
View of the bow of the RMS Titanic photographed in June 2004 by the ROV Hercules during an expedition returning to the shipwreck of the Titanic.
(Courtesy of NOAA/Institute for Exploration/University of Rhode Island)


From Hydro by Albert E. Theberge

Understanding the Unthinkable

In the night of 14 April 1912, the unthinkable happened.
The mightiest ship afloat, the brand new White Star Line ship Titanic, was on its maiden voyage from Southampton, England, to New York.
The ship was advertised as unsinkable.
And, if unsinkable, why should there be adequate lifeboats for all of the passengers and crew? The ship departed from Southampton on 10 April.
Less than five days later, it was at the bottom of the Atlantic Ocean.
More than 1,500 people perished within three hours of striking an iceberg, which ripped the bottom out of the ship.

How this happened is a story told many times.
Human hubris, unswerving trust in the infallibility of technology, and the commercial impetus of fast Atlantic passages all contributed to the loss of the ship and the accompanying loss of life.
Even as the ship was settling in the waters of an icy North Atlantic, some survivors reported that there was a belief among many passengers that the ship was the safer place to be; accordingly, not all the lifeboats were filled to capacity.

This accident shocked the international community.
The British and American governments investigated the accident – the British determined: “That the loss of said ship was due to collision with an iceberg, brought about by the excessive speed at which the ship was being navigated.” Certainly, that was the major factor.
However, like many accidents, there were a number of contributing causes.
These included: watertight bulkheads that were improperly designed; an insufficient number of lifeboats and life rafts; apparent lack of concern by the captain concerning reports of ice prior to collision with the iceberg; little training of crew in emergency procedures including lowering of lifeboats; no radio watches on nearby ships which could have assisted in lifesaving efforts; and, remarkably, not even binoculars for the ship’s lookouts.

Steamship Titanic showing length as compared with highest buildings.

Both the British and American governments arrived at similar conclusions and recommendations following the loss of the Titanic.
The chief recommendation was that all ships be equipped with sufficient lifeboats for passengers and crew, that all ocean-going ships maintain 24-hour radio-telegraph watches, and that bulkheads be designed such that flooding of any two adjacent compartments would not result in sinking of a vessel.
These recommendations and others were adopted by the first International Convention for the Safety of Life at Sea (SOLAS) at a conference held in London in 1914.

Development of Seafloor Mapping Technologies


Commercial concerns saw an opportunity in the Titanic disaster and began searching for a means to determine the presence of icebergs and other unseen or submerged obstructions forward of moving vessels.
European and North American inventors joined the race.
In 1912, Reginald Fessenden, a Canadian inventor and radio pioneer, joined Submarine Signal Company, a forerunner of today’s Raytheon, and began work on an electro-acoustic oscillator similar to a modern transducer.
This oscillator was originally designed for both ship-to-ship communication and to receive reflected sound from an underwater object.
In late April 1914, Fessenden tested this device off the Grand Banks on the US Revenue Cutter Miami and succeeded in reflecting sound off an iceberg at a range of approximately two miles and hearing the return echo.
A second echo was heard that was determined to be from the bottom.

Submarine warfare during World War I accelerated research into the field of acoustics.
By the end of the war, the use of acoustics for both detection of objects in the water and measuring depth had been proven.
In 1922, the USS Stewart, equipped with a Hayes Sonic Depth Finder that utilized a Fessenden oscillator, ran a line of soundings across the Atlantic Ocean taking over 900 individual soundings.
The profile obtained from these soundings was published in the first issue of the International Hydrographic Review.
Piano-wire sounding systems became obsolete overnight.
Although leadline sounding continued for a number of years in shallow water, acoustic sounding systems replaced the leadline for most purposes within two decades.

World War II further accelerated the development of directional sonar systems (called Asdic in England).
Although meant originally for detection of submarines, these systems ultimately developed into modern side-scan sonar systems.
Underwater photography equipment and magnetic anomaly detection (MAD) instruments were in their infancy during this period.
MAD systems were proved effective in detecting submarines.
An early use by hydrographers of the complementary use of sonar, underwater photography and MAD gear was in the charting of ships torpedoed off the United States East Coast.
This was done by Coast and Geodetic Survey (C&GS) officers working off the Coast Guard buoy tender Gentian in 1944.

Following the war, there were further advances, including the development of an early side-scan sonar system called Shadowgraph in 1954 by German scientist Julius Hagemann, who was working at the United States Navy Mine Defense Laboratory.
This system remained classified for many years, but civil use of side-scan began developing shortly after this advance.
In the commercial sector, Harold Edgerton of the Massachusetts Institute of Technology (MIT) and Martin Klein, also of MIT, were early pioneers.
Edgerton turned a bottom-penetration sonar on its side in 1963 and imaged a sunken lightship from a C&GS vessel.
Edgerton was a founder of EG&G and discovered the Civil War era USS Monitor off Cape Hatteras with an EG&G commercial side-scan system.
Martin Klein began his career with EG&G but left to found Klein Associates, a name synonymous with side-scan technology.

Advances in depth measurement technology paralleled the development of side-scan technology.
In April 1961, engineers at General Instruments Corporation developed a proposal for BOMAS, Bottom Mapping Sonar.
Quoting from the proposal: “BOMAS derives bottom profile information from the intersection of the ocean bottom with a vertical plane perpendicular to the heading of a ship.
The sonar data is processed automatically and in real time to provide a depth contour strip map….
A sonar intensity map can be provided simultaneously….” 
Multi-beam sounding with its attendant bottom reflectivity mapping capability was born.
Two years later, the first prototype multi-beam system was installed on the USS Compass Island and subsequent units installed on Navy survey ships.
In the meantime, the acronym had changed to SASS (Sonar Array Sounding System).
By the late 1970s, the technology had migrated to the civil community and has since displaced single beam sounding systems as the standard seafloor mapping tool.

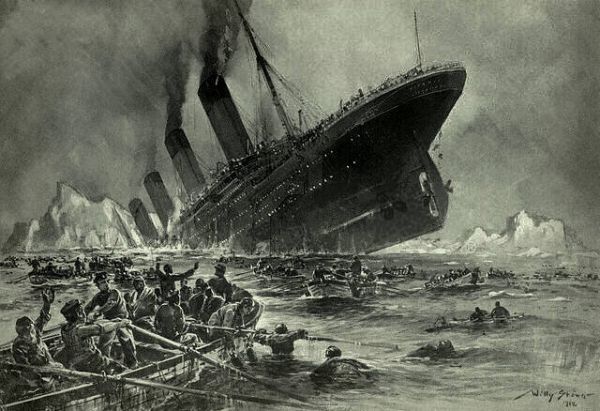
Painting of the Titanic sinking by the bow, with people rowing a lifeboat in the foreground and other people in the water.
Icebergs are visible in the background.
(Engraving by Willy Stöwer: Der Untergang der Titanic) 

Finding Titanic and the Aftermath of the Discovery


In the immediate aftermath of the sinking, proposals to locate the sunken Titanic were discussed and ultimately dismissed because the wreck lay well beyond the limits of technology at that time.
Through the decades, the development of subsea technology finally provided the means to locate the wreck and subsequently to not only investigate it using remote technology, but also to dive to the wreck and conduct a series of investigations that included surveys of the interior of the ship.

In July 1985, the final search began, with Ifremer deploying their newly developed side-scan sonar SAR vehicle on a mission led by Jean-Louis Michel on the research vessel Le Suroit.
That survey covered 70% of a 150 square nautical mile survey box without locating the Titanic.
Picking up the search in August, the WHOI team, led by Robert Ballard aboard the research vessel Knorr, utilized the towed vehicle Argo, with a 100kHz side-scan sonar, and three low-light black and white video cameras.
Ballard’s team relied on the optical system to locate the Titanic, and in the early morning hours of 1 September, the unmistakable form of a boiler made it clear that the search was over.
Titanic’s final resting place had been found.

Since the discovery in 1985, a series of expeditions have visited the Titanic with a variety of goals.
Ballard and Woods Hole returned to the wreck in July 1986 on the WHOI research vessel Atlantis II, with the submersible Alvin, and the ROV Jason Jr.
The 1986 expedition photographed and filmed the wreck, focusing on the largely intact bow section.
Working from the data collected from the 1985 Argo survey as well as 1986 data, WHOI’s William Lange and others assembled a preliminary site map of the Titanic wreck site that delineated the site from the bow to the stern section and plotted a wide range of features scattered on the seabed.
A private venture funded and led by RMS Titanic, Inc., the salvor-in-possession of the wreck (RMST), and technically supported by Ifremer, returned to the wreck in July 1987 and made 32 dives to recover some 1,800 artifacts from the seabed, the first of a series of recovery dives made by RMST until 2004, which ultimately salvaged nearly 5,000 artifacts.

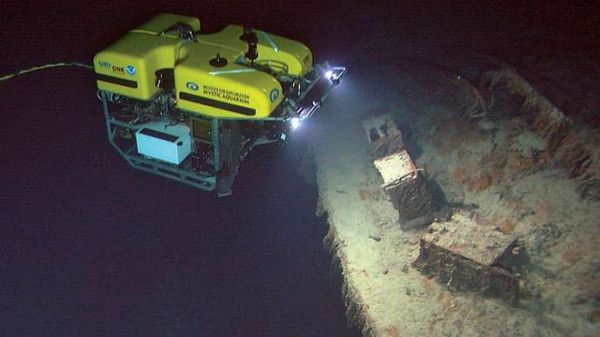
The remotely operated vehicle (ROV) Hercules exploring the bow of the Titanic, 2004.
(Courtesy: Institute for Exploration/University of Rhode Island/NOAA


Dives made by documentary film crews and James Cameron (whose first dives were in 1995) working with the P.P.
Shirsov Institute, captured dramatic images of the wreck as well as additional technical information and a more detailed view of aspects of the wreck site in the Mir submersibles.
In particular, Cameron’s extensive documentation and penetration of the interior of the bow with small ROVs known as ‘bots’ provided incredible insights into the ongoing processes of environmental change and preservation inside the ship, as well as evidence of what had occurred during the sinking of the Titanic.
Cameron’s work has arguably done more to share the Titanic as a wreck site with a greater audience than anyone else.

The scientific products of the various expeditions include a detailed analysis of the microbiological corrosion of the ship’s steel (led by Roy Cullimore), geological studies of the sediments and current studies (by the Shirsov Institute), a detailed sonar survey of the bow where the Titanic struck the iceberg, photo mosaics of the bow section, and forensic studies of the ship’s sinking sequence and break-up.
In addition, RMS Titanic, Inc. commissioned the creation of an ‘archaeological GIS’ map delineating where the 5,000 artifacts had been recovered from between 1987 and 2004.
That GIS, which is being completed by RMST under contract by the Center for Maritime & Underwater Resource Management of Michigan, a private non-profit, is reported to be nearly complete.

The National Oceanic & Atmospheric Administration’s Office of Ocean Exploration conducted two missions to the Titanic in 2003 and 2004.
As the nation’s ocean agency, NOAA has an interest in the scientific and cultural aspects of the Titanic.
NOAA’s focus is to build a baseline of scientific information from which we can measure the processes and deterioration of the Titanic, and apply that knowledge to many other deepwater shipwrecks and submerged cultural resources.
The 2003 mission, with the Shirsov Institute, had several key goals, the first being to catalogue any anthropogenic activities currently impacting the wreck site, or evidence of such activity since its discovery in 1985.
Digital imagery was obtained and a deck-view mosaic of the bow section was created.
Additionally, ongoing bacteriological analysis was conducted as well as basic oceanographic research.

The 2004 Mission, Conducted On Board the NOAA Research Vessel

Ronald H. Brown, working with Robert Ballard, then (and now) with the University of Rhode Island and the Institute of Archaeological Oceanography, utilized an ROV to continue the assessment of the wreck’s ongoing environmental changes and the bacteriological work of Roy Cullimore.
One other key achievement of the 2004 mission was the completion of a topographic map of Titanic Canyon and the surrounding area, including the wreck of the Titanic, with a Seabeam 2112 multi-beam sonar system.
The digital terrain model of this large area of seabed places the Titanic within a larger geological and geographical context.

NOAA also participated, as did Woods Hole, the National Park Service, the Institute of Nautical Archaeology, the Waitt Institute and contracted partners such as Phoenix International, Ltd., in RMS Titanic, Inc.’s last (to date) expedition to the wreck in August 2010.
This mission, with a non-recovery scientific focus, focused on William Lange’s and the WHOI Advanced Imaging and Visualization Laboratory’s work to create a detailed 2D and 3D visual mosaic of the site.
To do so, it made a detailed survey using the Waitt Institute’s REMUS 6000 autonomous underwater vehicles of an approximately ten square nautical mile survey zone around the wreck site, with a series of closer, higher resolution surveys of the area delineated in the 1986 WHOI map of the site and even closer surveys of key features and areas of the site.
That project was successful in generating the mapping data as well as comprehensive visual coverage of the wreck, including detailed photo mosaics of a number of features in the artifact scatter, which included sections of the ship’s hull, machinery and equipment and other artifacts.

This composite image, released by RMS Titanic Inc., and made from sonar and more than 100,000 photos taken in 2010 by unmanned, underwater robots, shows a small portion of a comprehensive map of the 3-by-5-mile debris field surrounding the bow of the Titanic on the bottom of the North Atlantic Ocean (Courtesy: AP Photo/RMS Titanic Inc.)

What is clear in this brief overview is that the last few decades have witnessed a revolutionary expansion of humanity’s capacity to not only locate deep-sea shipwrecks, but increasingly to capture imagery and data that essentially ‘virtually raises’ these wrecks for ongoing research as well as public education.
In many ways, the Titanic and the surrounding area are likely to be the best-studied section of the deep ocean floor.
That status has come because of the iconic nature of the wreck and the potential for profit from the opportunity to connect to this ship and its tragic loss either through a tour of the recovered artifacts or a virtual tour on film or in a photograph.
At the same time, measurable and important science has been conducted, and in that, a way forward for not only this site but others has been demonstrated, especially in the adaptation and adoption of technology to access and learn from sites once thought unreachable.

Links :