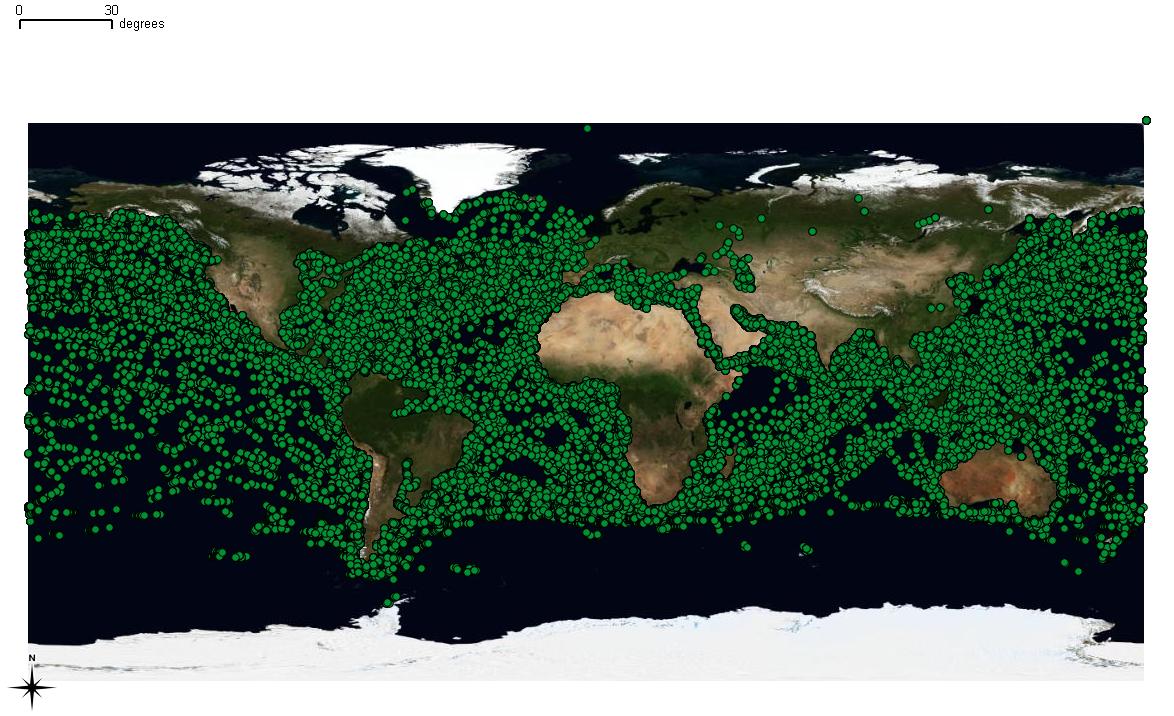
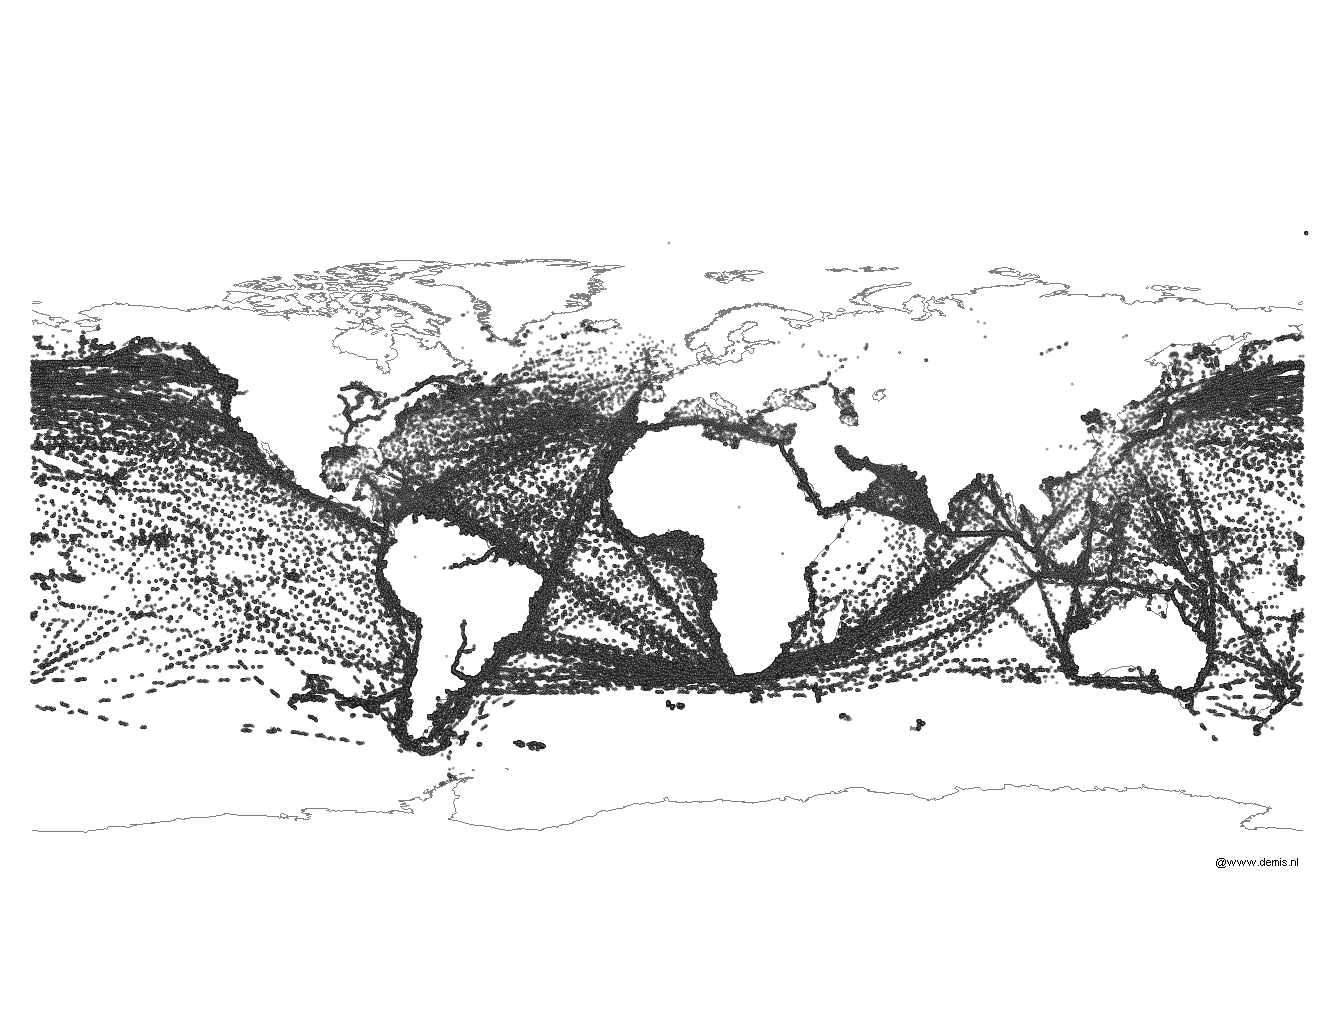
Ship position reports received with the NORAIS Receiver during 24 hours, 29th June 2010. (FFI)
From NASA
As the International Space Station circles Earth, it has been tracking individual ships crossing the seas beneath.
An investigation hosted by the European Space Agency (ESA) in its Columbus module has been testing the viability of monitoring global maritime traffic from the station's orbit hundreds of miles (kilometers) above since June 2010.
 The COLAIS experiment with NORAIS receiver was switched on on 1 June 2010. More than 90 000 Class A AIS messages were gathered by between 1900 GMT on 2 June and 0900 GMT on 3 June.
The ship-detection system being tested is based on the Automatic Identification System, or AIS, the marine equivalent of the air traffic control system.
All international vessels, cargo ships above certain weights and passenger carriers of all sizes must carry "Class A" AIS transponders, broadcasting continually updated data, such as identity, position, course, speed, ship particulars, cargo and voyage information to and from other vessels and shore.
AIS allows port authorities and coast guards to track seagoing traffic, but the system relies on VHF radio signals with a horizontal range of just 40 nautical miles (74 km).
This makes it useful within coastal zones and on a ship-to-ship basis, but not in the open ocean; ocean traffic was largely untracked.
However, AIS signals travel much further vertically, making the space station an ideal location for space-based AIS signal reception and, therefore, providing the capability of tracking global maritime traffic from space.
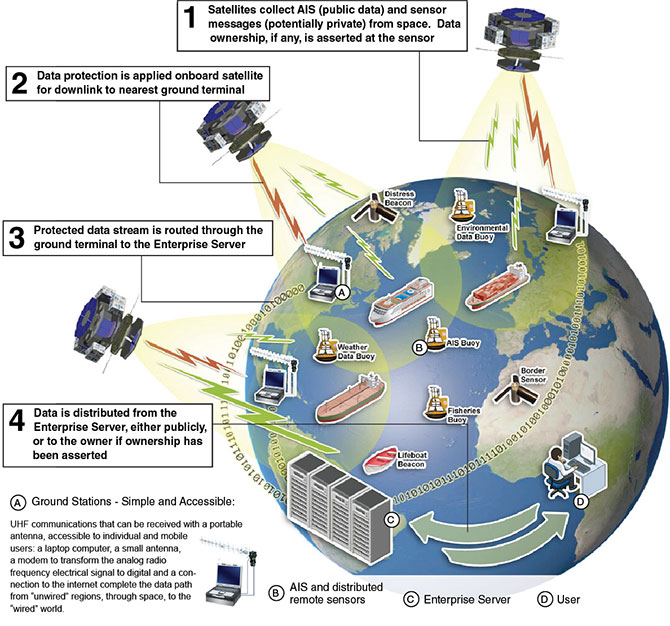
 The International Space Station makes 15 orbits around the Earth each day. The illustration of the COLAIS system in operation using the NORAIS receiver shows the station passing the Mediterranean. Its field of view is shown in red; detected vessels are shown as ship symbols, and terrestrial AIS base stations are shown as buildings. The data are for the first five hours of June 3, 2010. (FFI)
Astronauts were instrumental in enabling the COLAIS experiment, which is an in-orbit demonstration project of ESA's General Support Technology Program.
Columbus was not originally outfitted with VHF antennas to capture the AIS signals; they were installed on the outside of the module during a spacewalk in November 2009, with the remaining piece of hardware, the ERNO-Box control computer, installed inside Columbus along with the NORAIS receiver in May 2010.
 Astronaut Randolph Bresnik seen during Atlantis EVA-2 on November 21, 2009, with the unfurled AIS antenna, attached to Columbus for use in experimental tracking of VHF signals of ships at sea. (NASA)
The ERNO-Box is itself an orbital demonstration of a new class of space computer developed by Astrium Gmbh, Germany.
Astrium was responsible for overall system integration, and contributed the ERNO-Box and a grappling adaptor, or GATOR, used to attach the AIS antenna to Columbus.
Antennas were built by AMSAT.
Global Overview of Maritime Traffic
Video indicating the vastly improved coverage area obtained using satellite based AIS base stations.
The AIS ground coverage from the station is between approximately 68° north and 68° south.
The system consists of two antenna assemblies that were mounted on the outside of Columbus during a spacewalk in November 2009 as well as data relay hardware (the ERNO-Box) and a receiver mounted inside Columbus.
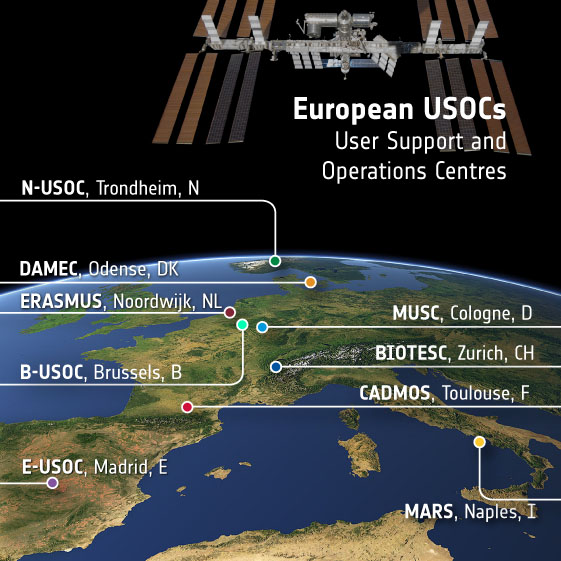
The two operational phases with the first receiver from Norway,or NORAIS, which is operated by FFI/Norway, have been extremely successful, with data telemetry received by the Norwegian User Support and Operation Center, or N-USOC, in Trondheim, Norway, via ESA's Columbus Control Center in Germany.
Data has been received by NORAIS in almost continuous operation, and all modes of operation have worked extremely well.
The NORAIS Receiver has a sample mode that can collect the raw signal, digitize it and send it to ground for analysis of signal quality, which is proving very helpful in making additional improvements/ refinements to the system in extremely crowded shipping areas where the possibility of lost signals or mixed signals can occur.
This is used both to investigate the signal environment and to evaluate the performance of new receiver technologies on the ground.
Several hundred data sets have been collected and processed with new candidate algorithms for next generation receivers.
 The results of the analyses have been very good.
On a good day, approximately 400,000 ship position reports are received from more than 22,000 different ship identification numbers (Maritime Mobile Service Identity, or MMSI).
In a summary made in Oct. 2011, the total number of position reports received exceeded 110 million messages from more than 82,000 different MMSI numbers.
As an addition to the original technical topics, operational experimentation has been included in the investigations.
Near-real-time data transfer is crucial to meet the requirement of SAT-AIS set by ESA in cooperation with operational users.
After an upgrade of the ground systems in the N-USOC, 10 days of near-real-time data show that 80 percent of the messages collected in the period could be delivered through the station's communications network with data latency significantly less than 1 hour.
The near-real-time data delivery has been part of routine operations since Nov. 2011.
 AISSat-1 first result july 12, 2010: AIS data from AISSat-1 (Orange/pink)
and AIS data from the coastal network (green)
At present, a new version of the decoder algorithm, developed by Kongsberg Seatex as part of the technology development contract with ESA, is being tested.
The development benefits from the investigations of the sampled data and ongoing work in other ESA projects.
The firmware was uploaded to the NORAIS Receiver through the station's communications network and verified and activated in Jan. 2011.
The preliminary results indicate that the performance in terms of decoded messages has increased by a factor of between 1.5 and 2.0 for the high traffic zones that ESA has specified should be monitored with high performance.
The work on better algorithms continues.
A second NORAIS Receiver upgrade is planned in May 2012.
The results of the development will support the design and development of a space-based AIS system in general as well as the performance of the AIS receiver on the station.
The video shows an in-context view of AIS data collected from the AprizeSat-3 microsatellite owned and operated by SpaceQuest, Ltd. The data was collected on 11 September 2010.
The video covers several segments in a 12-hour period between midnight and noon, GMT.
Playback is set at about 48 times faster than realtime. AIS packets received from ships are shown by red dots, which persist for 30 seconds realtime (~1.25 seconds sim time).
Therefore, ships that are transmitting AIS data frequently tend to persist in the view.
The Field of View (FOV) of the satellite is shown by a white circle - this effectively denotes the perceived satellites horizon.
The low Earth orbtiing satellite can only receive ships within the FOV.
Integrating AIS information with other satellite data, such as information from remote-sensing satellites, should significantly improve maritime surveillance and boost safety and security at sea.
The payload designed for the Norwegian AISSat-1 satellite, which launched into a near polar orbit in July 2010, provides similarly good data in the high north.
The NORAIS Receiver is software-defined radio design operating across the maritime band from 156 to 163 megahertz.
The tuning of the NORAIS receiver to frequencies under consideration for allocation to space-based AIS has been carried out, and NORAIS took part in international tests of these two proposed frequencies in October 2010 as arranged by U.S. Coast Guard.
The main reason for covering more than the two current frequencies in use for AIS is to have the possibility to demonstrate the operational use of new channels in the maritime band being allocated to space-based AIS.
Also, this configuration allows for characterization of the maritime VHF spectrum with respect to occupancy and interference.
The software implementation allows for optimization of the receiver settings in orbit and also allows for upload of new signal processing algorithms.
 CETMEF : AIS Traffic in the North-West of France (ENVISIA system)
The Vessel Identification System, or VIS, could potentially be beneficial to many European entities, particularly in assisting them in law enforcement, fishery control campaigns, maritime border control, maritime safety and security issues, including marine pollution surveys, search and rescue and anti-piracy.
Various service entities have already been asking to get access to the VIS data, which is continuously acquired on Columbus.
Links :
- BBC : Norway resorts to ship-watching from space
 Some of his exploits at massive Cloudbreak (Fiji) and the secret slab in West Oz, almost beggar belief.