Author: Anonymous Portuguese
Date: 1501-02 Country: Portugal Archive: Lost, possibly destroyed
Call number: BNF, CPL GE B-1120 (RES) [Copy by O. Progel] Dimensions: 1170 x 870 mm
Medea Database Entry | Entrada na Base de Dados Medea
Medea Database Entry | Entrada na Base de Dados Medea
- see large scale Wikimedia -
From Medea chart by Bruno Almeida
The Kunstmann III chart, now presumably lost, was an historically invaluable map that showed the result of early European exploration of the New World and of the African coast in the south Atlantic.
It is likely that its construction started before the Cantino planisphere (1502), making it the earliest known Portuguese representation of the southwestern coast of Africa.
The Kunstmann III is probably also the earliest known nautical chart showing the locations of places as determined by astronomical observations.
This puzzling chart owes its designation to being the third in an atlas of facsimiles published by Friedrich Kunstmann in 1859.
Unfortunately, as is sometimes the case in the history of cartography, this delightful chart has almost certainly been destroyed, having disappeared from the archives of the Bayerischen Armeebibliothek during World War II.
Luckily, present-day researchers and map enthusiasts have at their disposal a photograph of the original (published in four sheets, in 1903, by Edward L. Stevenson, originals also lost) and a magnificent coloured copy made by Otto Progel in 1836.
It has been argued that the Kunstmann III was made in several stages between 1501 and sometime after 1505.
It integrates long-held geographical knowledge with the data from expeditions occurring in the early 16th century.
The drawing of the Mediterranean and the coasts of Europe derive from earlier cartographical knowledge, also depicted in many portolan charts.
In contrast, recent studies show that the places on the west coast of Africa, in the northern hemisphere, were situated by means of astronomical readings of the latitude, a method not used in the construction of contemporary charts of the Mediterranean.
Notwithstanding, the examination of the southwestern African coast indicates that the representation was not based on astronomical readings of the latitude but made using dead reckoning information collected from Portuguese exploration occurring before 1501.
The chart shows the results of the ill-fated voyages of the Corte Real brothers, Gaspar and Miguel, to Greenland and Newfoundland.
The chart’s image of Greenland derives from Gaspar Corte Real’s first journey that took place in 1500.
Later, in October 1501, after his second expedition, Gaspar’s ship was lost in Newfoundland.
In the following year, Miguel set off to rescue his brother, but likewise became lost, never returning to Portugal.
In both cases, other ships participating in the expeditions returned home with new geographical information about the explored regions.
Another source for the geographical content of the Kunstmann III was the Coelho-Vespucci voyage of 1501–1502, during which the mariners explored South America, reaching what is now Rio de Janeiro on New Year’s Day of 1502.
This expedition was the source for the data of the Brazilian coastline presented in the chart.
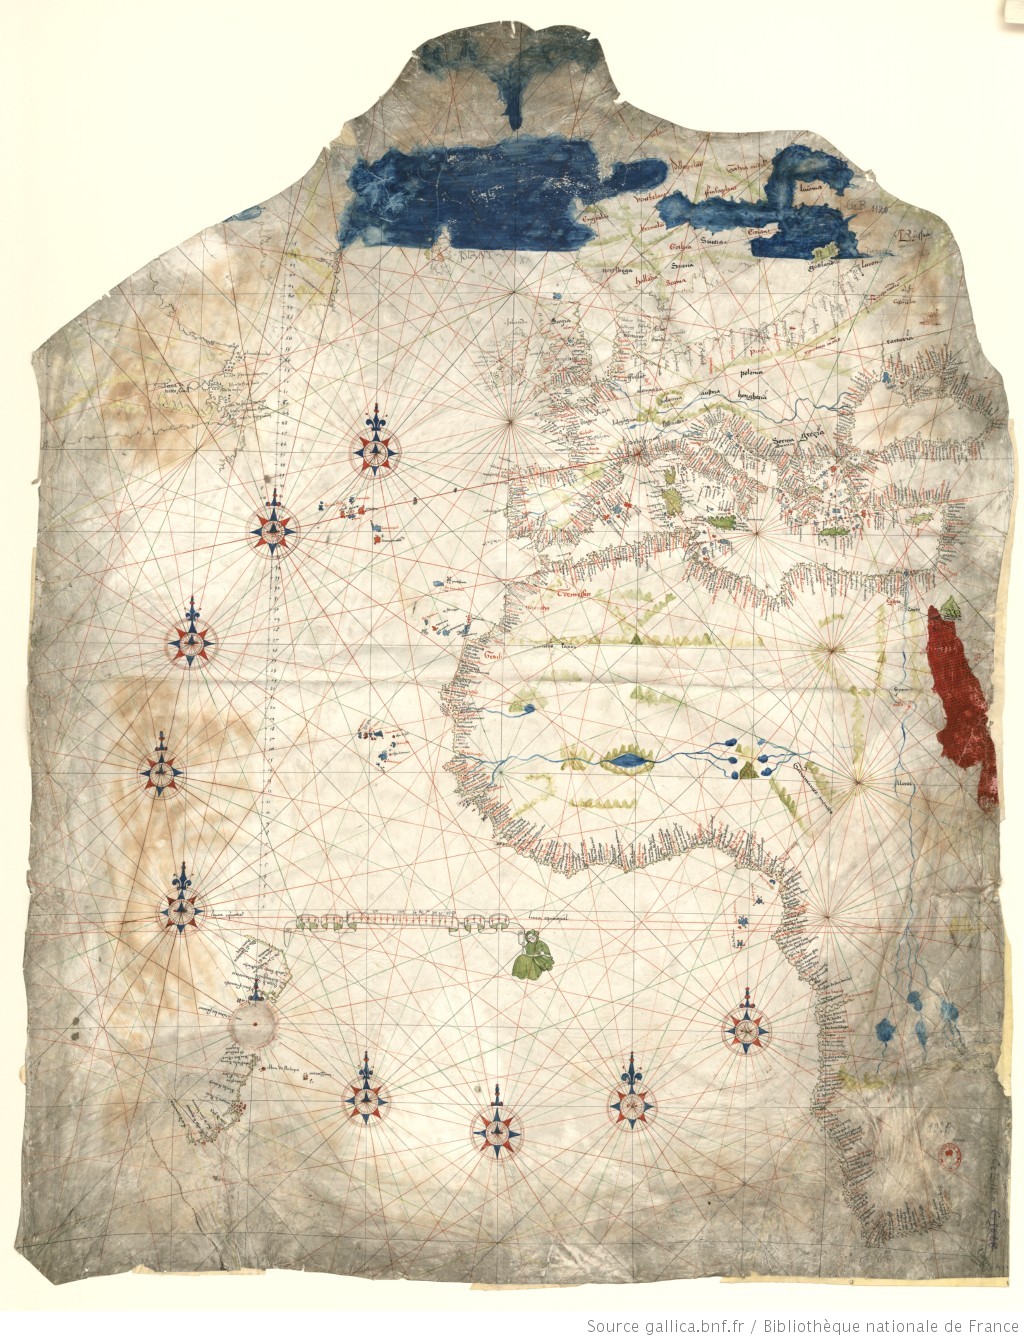
Using Stevenson’s photographic record and Progel’s copy, we may see that the Kunstmann III covered Europe, West Africa, the Mediterranean, the Black Sea and the Atlantic with Newfoundland, Greenland, and the Brazilian coast.
The chart has a latitude scale drawn in the western Atlantic Ocean in the Northern Hemisphere, starting at the Equinoctial, and going up to 68 degrees north in Greenland.
This seemed a sign that the incorporation of latitudes did not extend south of the Equinoctial, which has been confirmed by recent research.
The Kunstmann III shows no flags and depicts a few inland features, such as important rivers, mountain ranges, Bohemia, and Mount Sinai.
There are also representations of eastern European cities and of Cairo, albeit poorly rendered.
Progel’s coloured copy shows a dark blue Arctic Ocean and an unmistakable Red Sea.
The wind roses are drawn in a transitional style, with two different designs that are very similar to those found in other charts, such as the Dijon chart.
The placenames on the chart show at least four different handwriting styles.
Despite the previous studies of this beautiful chart, there are several mysteries remaining for future generations of researchers to unveil, such as the reason for the erased compass rose over the coastline of Brazil, and the identity of the enigmatic androgynous figure holding the scale of leagues over the Equinoctial.
Links :
- Kunstmann III: The Oldest Known Nautical Chart Incorporating Latitudes
- Gallica BNF : Planisphères et atlas du monde
No comments:
Post a Comment