
From SailDrone
Saildrone Forecast for iOS is one of only a few weather apps to leverage the power of Apple’s Metal framework to animate global and local weather on one beautiful and accurate map.
No matter where you live on the planet, knowing the weather is integral to your daily routine: In deciding what to wear to work, school, or play, if you need to carry an umbrella or can leave your jacket at home, if the garden will get enough water or if the frost will come early.
Weather impacts transportation, commerce, and public health and safety around the world.
Many of us check the weather several times per day—starting with an early morning notification delivered to the lock screen on our smartphone.
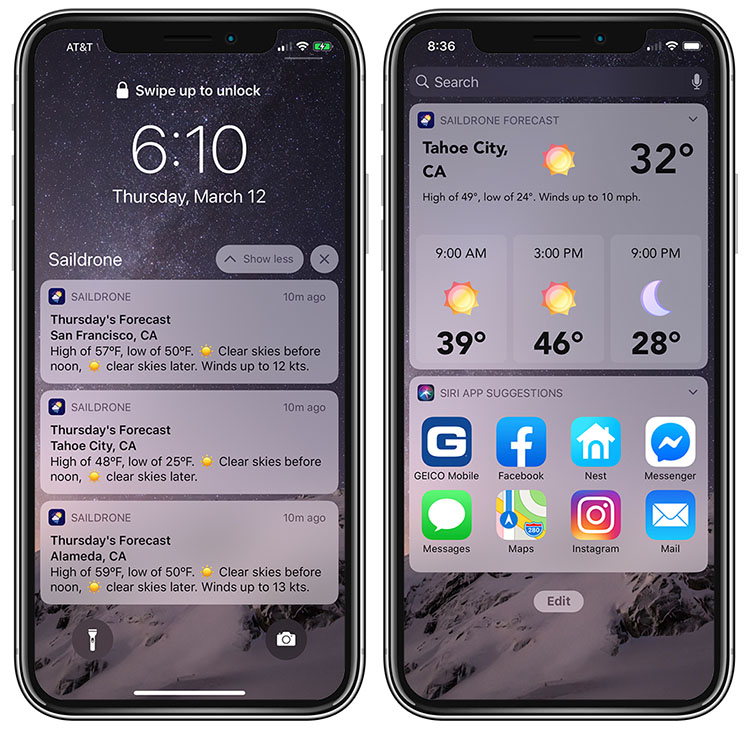
Customize your daily weather notifications inside Saildrone Forecast or swipe right to add the Saildrone Forecast widget to your home screen for quick access to the forecast for your last searched location.
Weather forecasting is a notoriously tricky business.
Forecasters get little credit when they get it right, and a whole lot of flak when they get it wrong. Historically, one of the limitations to weather forecasting has been a lack of data.
While this is still true, especially over the oceans, the other significant challenge is how forecasts are communicated to the end user—you.
Satellites, weather buoys, and airport weather stations have drastically increased the amount of data forecasters have to generate weather models, but data deserts—like the deep regions of our global oceans—still exist, which is why Saildrone is working to deploy regional fleets of autonomous ocean drones from pole to pole, including the Atlantic and Tropical Pacific, to augment existing data collection infrastructure with the goal of improving global weather and climate models.
Saildrone believes that better inputs make better outputs, but communicating those outputs requires better visualizations that can provide insights at the planetary level as well as at the local street level, wherever users might be located around the world.
This is what drove us to develop an animated globe, rather than the more traditional static map typical of local weather reports.
Achieving this feat boils down to a complex data compute task that needs to be efficiently managed right on the user’s device.
Saildrone Forecast is one of only a few weather apps to leverage the full power of Metal, a breakthrough graphics processing framework developed by Apple.
Metal is extremely popular in the game world because it provides real-time graphics; in the Saildrone Forecast iOS app, it makes visualizing data on the globe possible.
The globe in the Saildrone Forecast iOS app is developed on Apple’s Metal framework.
Spin the globe around and watch as it loads temperature data in and out (shown on iPad).
Most apps (and websites) present the weather as a static or animated series of pictures.
The National Weather Service’s Doppler Radar National Mosaic shows precipitation moving across the country by looping several flat images together.
Projecting a globe onto a flat surface creates inherent distortions to the distance, shape, and/or size of countries and regions, making it even more difficult to display accurate weather forecasts—the size and intensity of storms, contours of clouds and temperature gradients, and the movement of winds around the planet.
Not to mention ocean currents.
Saildrone Forecast sends highly optimized weather data directly to the device and uses the Metal framework to visualize it on a 3D globe.
The result is not only smoother, more accurate animations over a selected time range, but it also creates the ability to customize the visualization on the fly—activating Local Colors on the Temperature layer, for example—and combine data together.
Saildrone Forecast uses a combination of precipitation and temperature to visualize rain, snow, and mixed precipitation.
In the wind layer, you can switch between wind particles and wind barbs that show the speed and direction of the wind in any given location as you move around the globe because we’re sending wind speed and direction data to the app.

On the left, exploring the life of humpback whales in Google Earth; on the right, wind conditions on the US eastern seaboard.
Saildrone Forecast also provides information about wind gusts as well as average wind in the Weather Graph.
The experience of exploring the globe in the Saildrone Forecast iOS app is a little like spinning the globe in Google Earth, except that Google Earth is essentially a globe-shaped geo-spatial encyclopedia of the planet combining satellite imagery and Google’s vast repository of knowledge, while Saildrone Forecast takes a data-focused approach providing a revolutionary view of global andlocal weather, updated sub-hourly.
The engineering challenge of rendering Earth as a 3D globe was accomplished a while ago; the next challenge is adding a large amount of dynamic data to a 3D globe with a lightning-fast user experience.
We wanted to create something new and magical, where the data feels continuous as you spin the globe around and zoom in and out.
Loading the data for the layer you’re exploring has been a significant engineering challenge, but we are proud of the result and hope you will enjoy the experience.
Watch as moisture that has evaporated from the Pacific Ocean falls as rain and snow over land.
Zoom all the way out, and you can watch clouds formed by evaporation in the Pacific Ocean make landfall over North America.
Zoom in, and you can see if those clouds will release rain or snow in your neighborhood messing up your morning commute.
When you zoom out, you’re looking at standard definition global weather—it’s a satellite’s-eye view of planetary weather.
As you zoom in, the definition increases, revealing finer gradients in wind, temperature, and precipitation.
In some regions, like around San Francisco, Saildrone Forecast uses a hyper-local Weather Research and Forecasting (WRF) model to display ultra-high-definition weather data that takes into account local topography to visualize how the wind funnels under the Golden Gate Bridge and wraps north around Angel Island (wind is forecasted at an industry-standard level of 10 meters [33 feet] above the surface).
Saildrone is committed not only to providing the data needed to further advance long and short-term weather forecasting—we’re also committed to putting the power of the weather forecast in your hands.
And, as Metal and the hardware that powers it continues to improve, so will Saildrone Forecast.
Download Saildrone Forecast for free from the App Store for iPhone and iPad.
An Android app is also in the works!
As always, we welcome your feedback as we continue to re-invent the weather forecast experience.
Resources:
European Centre for Medium-Range Weather Forecasts, "Experts review ocean surface observations for NWP," January 29, 2018
Links :
- Saildrones Complete First Unmanned Passage of Strait of Gibraltar / Saildrone & NASA: Increasing the Value of Remote Sensing Data / Surveying Commercially Important Fish Stocks in the North Sea
- Geogarage blog : The new ocean explorers / Saildrone launched with seafloor mapping ... /
Ocean internet : sailing the wired seas / CSIRO to launch 'sailing drones' to monitor ... / No sailors needed: robot sailboats scour the ... / The drone that will sail itself around the world / Saildrone : a wind-propelled autonomous ...
No comments:
Post a Comment