Global ocean levels have risen about 6 cm (2.3 in) over the past two decades, matching models consistent with human-induced climate change.
NASA monitors sea heights and other parameters with the Jason satellite series.
Jet Propulsion Laboratory oceanographer Josh Willis explains the data.
From Time by Tanya Basu
Sea levels are 3 inches higher than they were in 1992.
"It's very likely to get worse in the future."
A panel of NASA scientists said Wednesday that new data shows sea levels are, on average, three inches higher than they were in 1992 due to melting ice from both mountain glaciers and the polar ice caps, as well as warmer oceans.
Greenland Ice Mass Loss: Jan. 2004 - June 2014
GRACE consists of twin co-orbiting satellites that fly in a near polar orbit separated by a distance of 220 km. GRACE precisely measures the distance between the two spacecraft in order to make detailed measurements of the Earth's gravitational field.
Since its launch in 2002, GRACE has provided a continuous record of changes in the mass of the Earth's ice sheets.
This animation shows the change in the Greenland Ice Sheet between January 2004 and June 2014.
This animation shows the change in the Greenland Ice Sheet between January 2004 and June 2014.
The 1-arc-deg NASA GSFC mascon solution data was resampled to a 998 x 1800 data array using Kriging interpolation.
A color scale was applied in the range of +250 to -250 centimeters of equivalent water height, where blue values indicate an increase in the ice sheet mass while red shades indicate a decrease.
In addition, the running sum total of the accumulated mass change over the Greenland Ice Sheet is shown on a graph overlay in gigatons.
The data was collected from NASA satellites.
NASA also released a video that shows a visualization of rising sea levels.
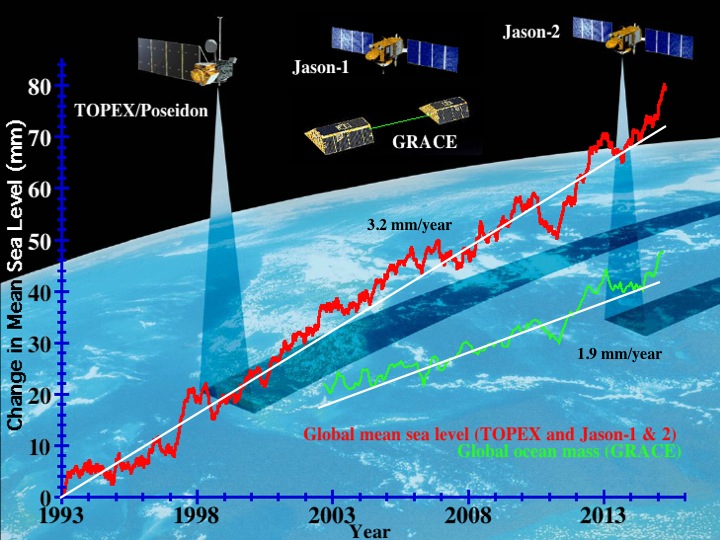
Global sea level has been measured accurately and continuously by satellites since 1993.
Credit: Steve Nerem, University of Colorado
Credit: Steve Nerem, University of Colorado
The changes are concerning and “it’s very likely to get worse in the future,” Steve Nerem, a University of Colorado geophysicist and a member of the panel, said in a conference call, Reuters reported.
In 2013, a United Nations panel reported sea levels were projected to rise between 1 and 3 feet by 2100; the NASA panel said data indicates the level rise would be on the higher end of that projection.
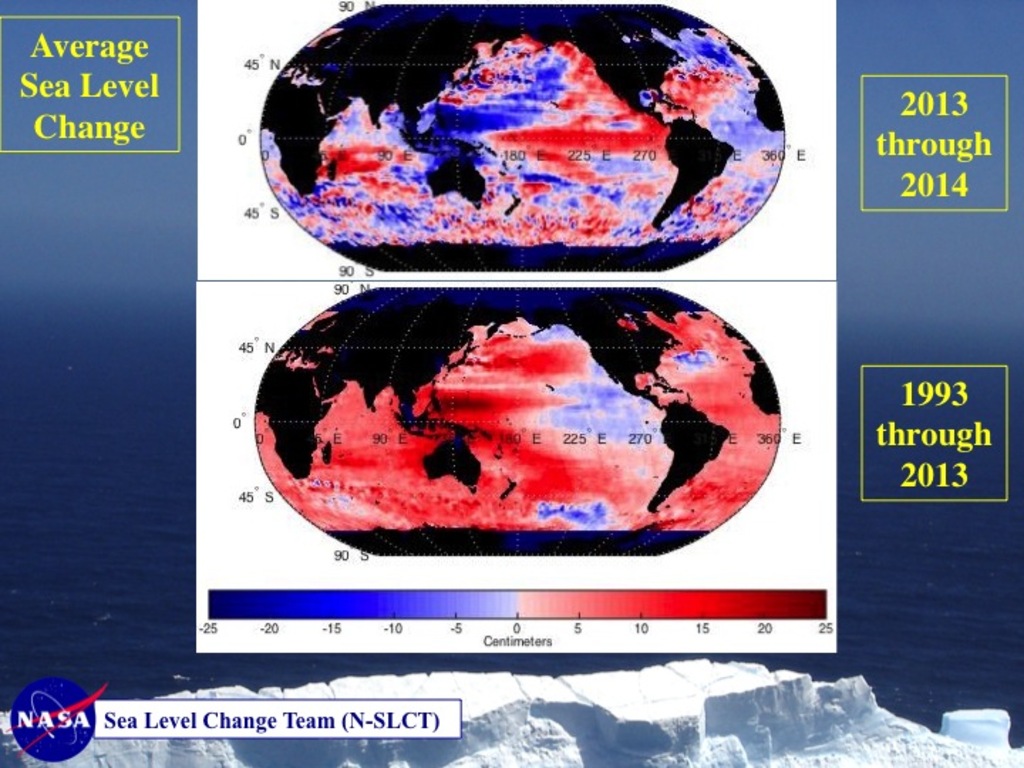
As measured by the TOPEX/Jason satellites, sea level change in the short-term (top) and longer-term (bottom) can be very different.
Credit: Nerem
Credit: Nerem
The sea level change is an average; in some areas, sea levels rose more than 9 inches, and in others—such as along the West Coast, sea levels are falling.
For over 20 years NASA has been tracking the global surface topography of the ocean in order to understand the important role it plays in our daily lives.
Climate change is causing our Ocean to warm and glaciers to melt, resulting in sea level rise.
Since 1880, the global sea level has risen 8 inches; by 2100, it is projected to rise another 1 to 4 feet.
Scientists warn that we haven’t seen the worst of it yet; ocean currents and weather cycles have actually offset some sea level changes in the Pacific, which means the West Coast could see a huge jump in sea levels in the next 20 years.
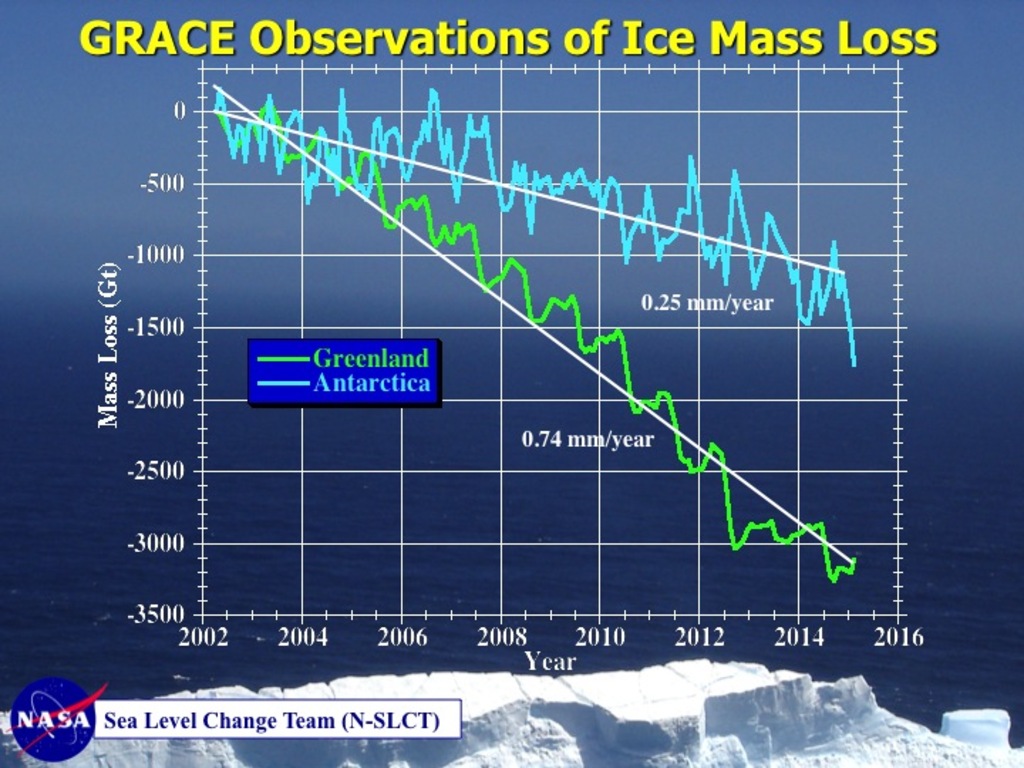
NASA’s Gravity Recovery and Climate Experiment (GRACE) twin satellites have measured the loss of ice mass from Earth’s polar ice sheets since 2002.
Credit: Nerem/CU-Boulder
Credit: Nerem/CU-Boulder
The panel warned that forecasting the melting rate of the polar ice caps is nearly impossible.
And even if the pattern were to stall and reverse, it would take centuries to return to original pre-climate change levels.
Links :
No comments:
Post a Comment