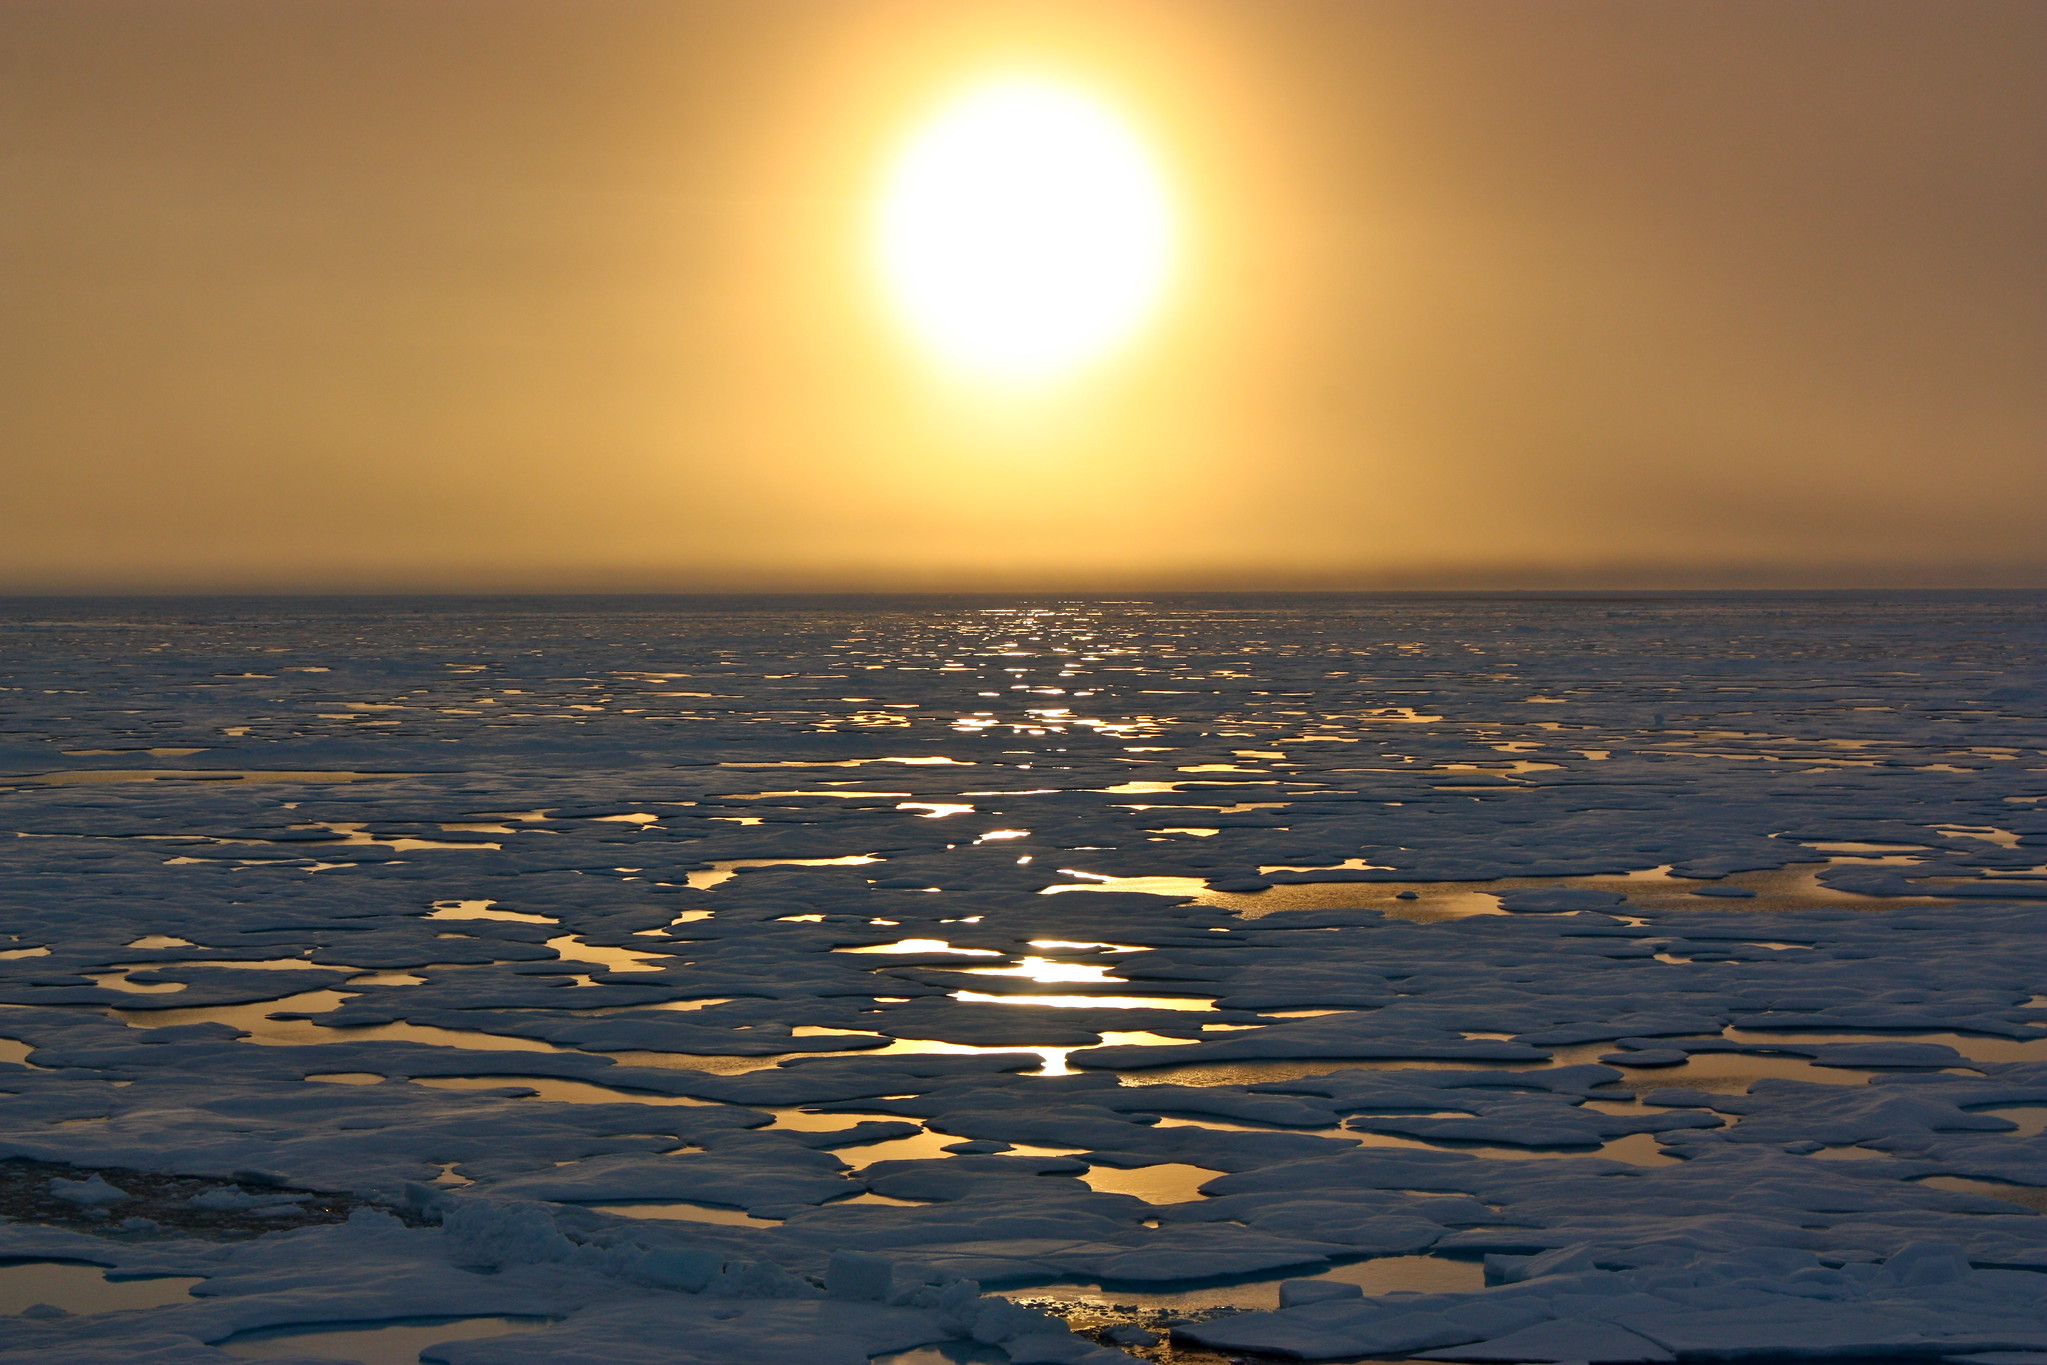
An example of collaborations between historians and climate scientists. image : Flickr / NASA Goddard Flight Center
From Motherboard Vice by Maddie Stone
Using records from early 20th century ships, researchers are peering into the Arctic’s past to understand the present.
Arctic sea ice is in a death spiral thanks to climate change.
A team of researchers is now adding some historical context this alarming trend by drawing on an untapped source of intel: U.S. military vessel logs from the early 20th century.
When scientists report trends in Arctic sea ice, they tend to focus on the satellite era, or 1979 onwards.
Research published last month in the Journal of Climate is helping extend those records back to the early 20th century.
While it’s not the first attempt to do so, the study makes use of a novel dataset of ships’ logs that volunteers are digitizing from records held in the National Archives as part of the Old Weather project.
Results from the newly created 110-year record of Arctic sea ice volume show an unexplained slight decline (black line) in the early 20th century.
The current drop (red line), caused by warming temperatures due to climate change, is more than six times as steep.
Axel Schweiger/University of Washington
"These are unique historic observations that can help us to understand the rapid changes that are taking place in the Arctic today," said study co-author Kevin Wood, a research scientist at the University of Washington’s Joint Institute for the Study of the Atmosphere and Ocean, in a statement.
The modern trend of Arctic sea ice loss is one of the clearest signals of human-caused climate change.
Sea ice is dwindling at a rate of about 13 percent per decade, with the twelve lowest annual lows on record all occurring this century.
Last month, the Arctic lost 40,800 square miles of ice per day, placing 2019 on track to rival or eclipse the record minimum set in 2012 according to the National Snow and Ice Data Center (NSDIC).
But while the current trend is stark, it’s important to put it in context.
“One of the frustrations many of us have is we know things from ‘79 onwards,” Kent Moore, a sea ice researcher at the University of Toronto, told Motherboard.
“But when you go back further it becomes a lot murkier.”
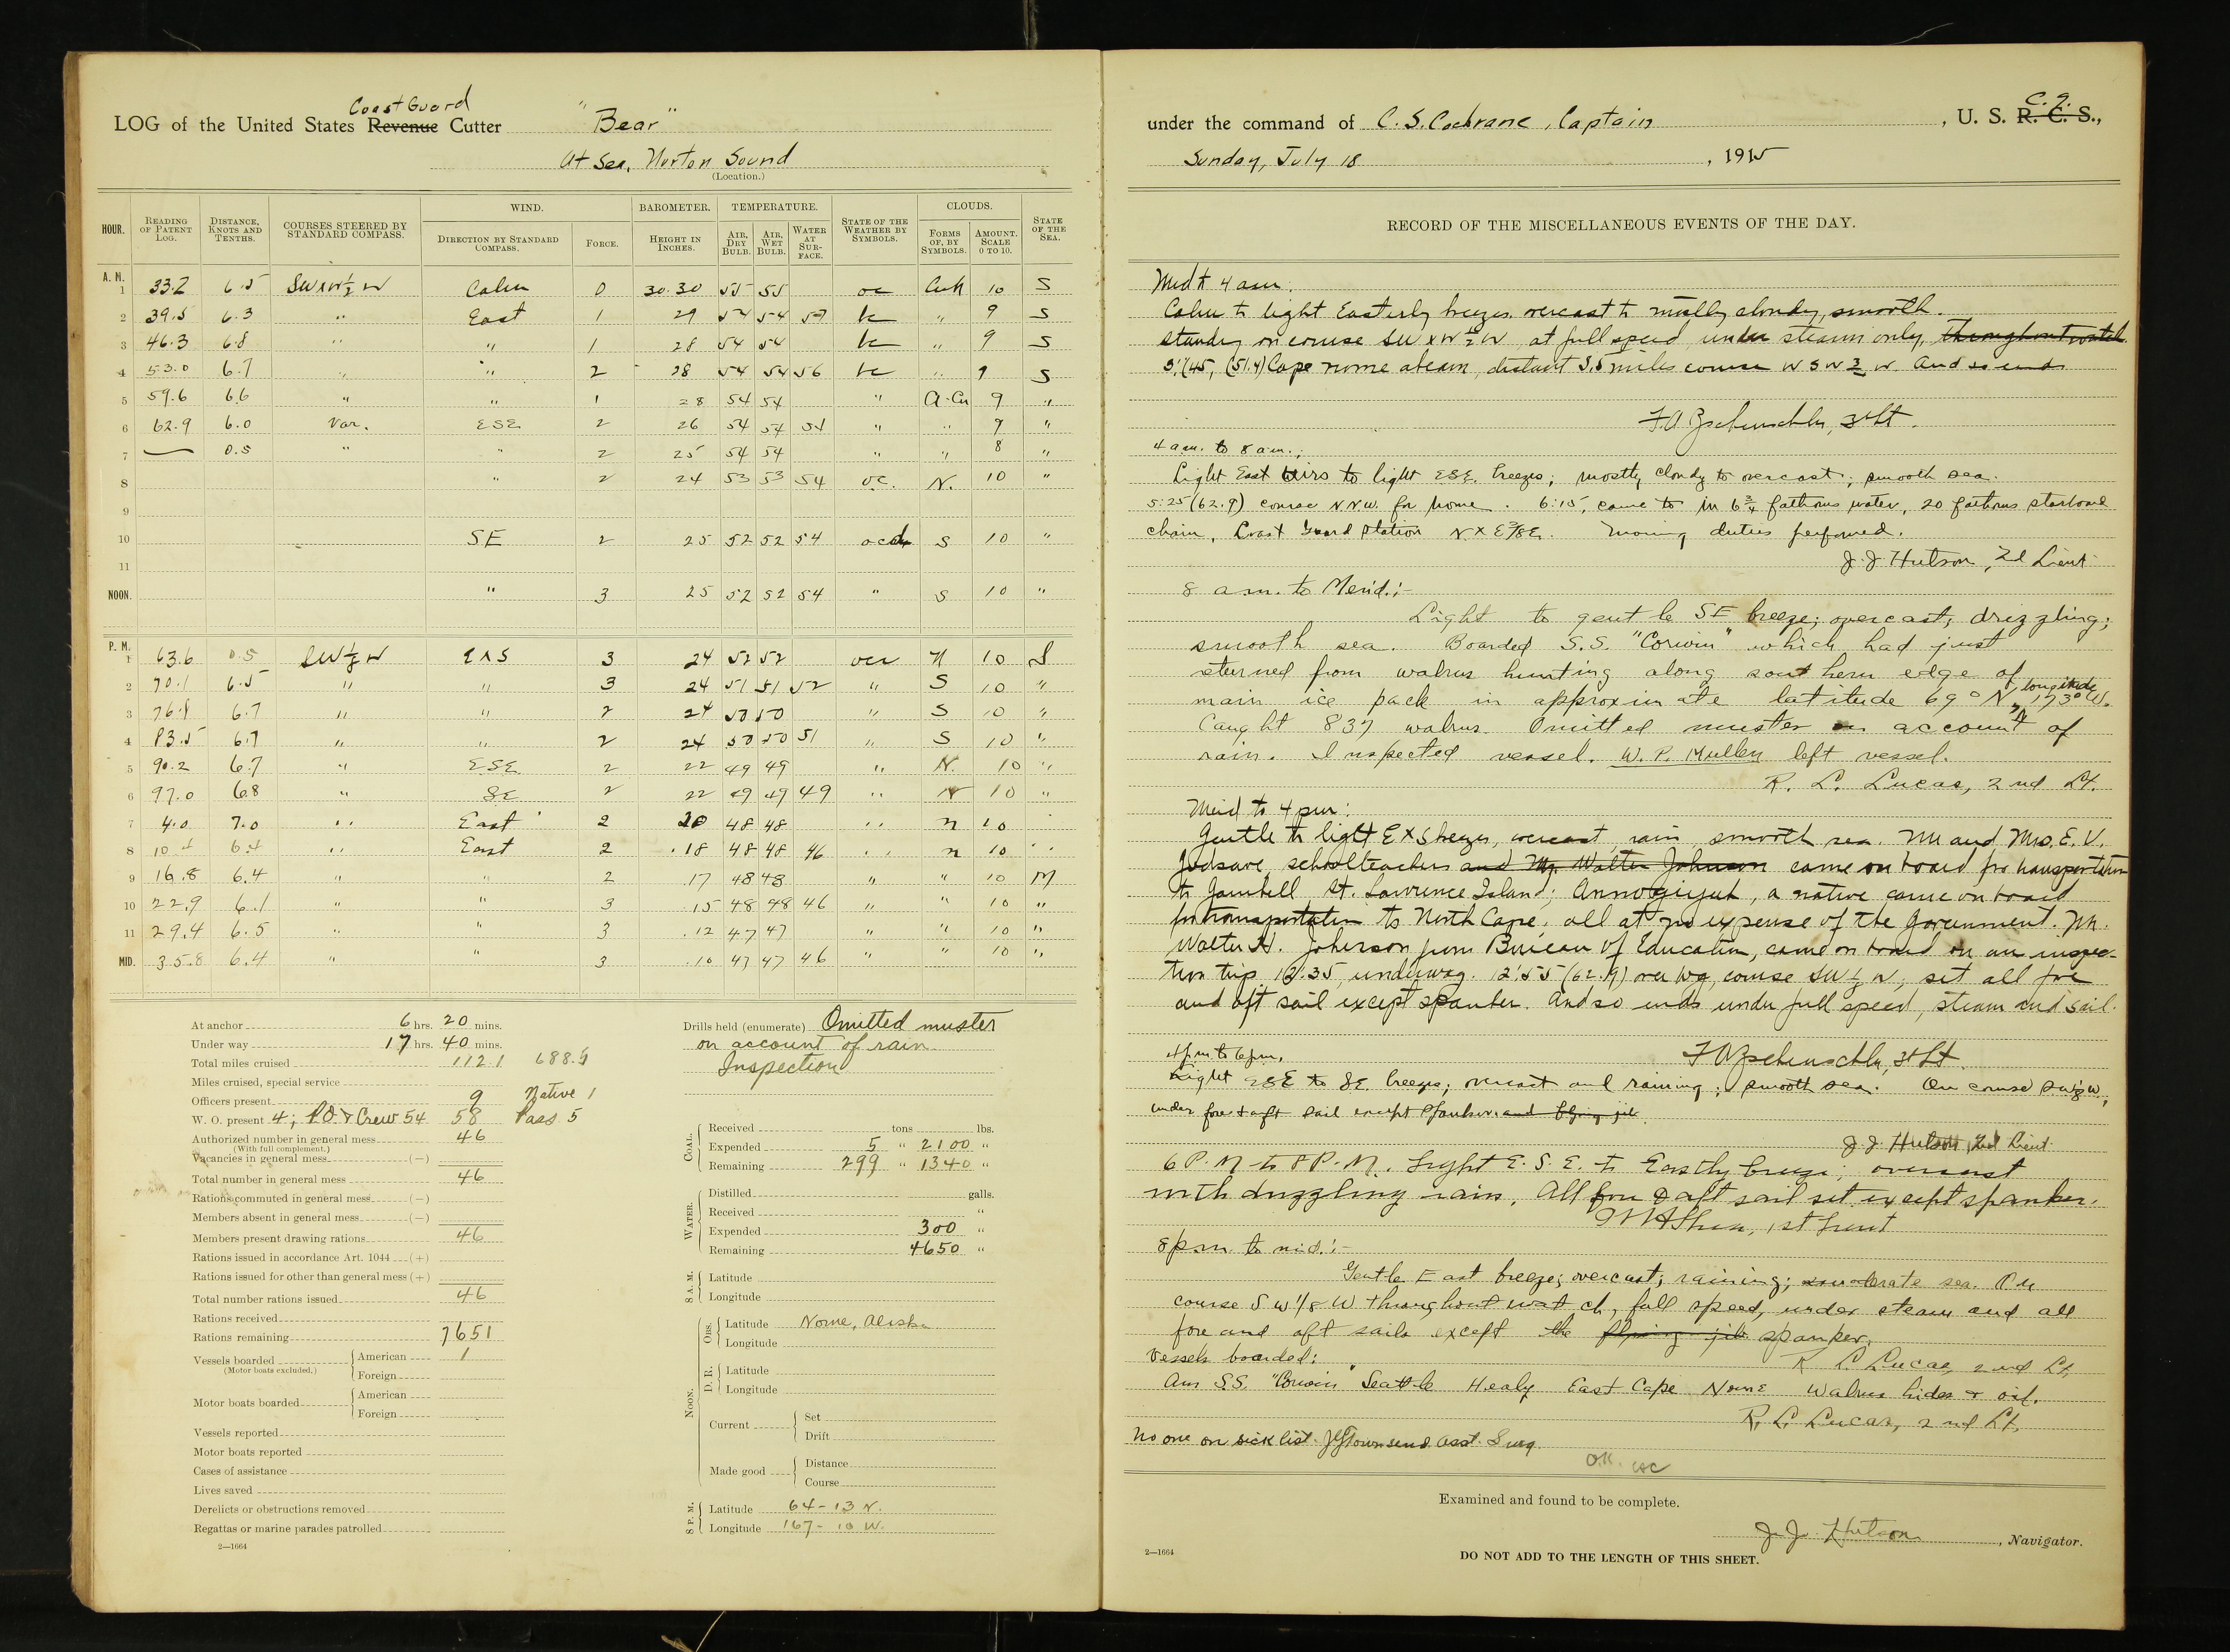
A digitized version of a 1915 ship log from the US Coast Guard ship bear.
credit: US National Archives
credit: US National Archives
To shed some light into the pre-satellite darkness, the new study uses a model that incorporates the behavior of the ice and ocean, coupled with a “hindcast” of atmospheric temperatures.
In particular, the study focuses on ice thickness during the so-called Early 20th Century Warming (ETCW) event between 1900 and the 1940s.
“That was a period where global temperatures increased, and so there was a question what happened with sea ice at that time,” lead study author Axel Schweiger, a sea ice researcher at the University of Washington, told Motherboard.
“There’s no comparison to the more recent period that was more strongly affected by global warming.”
Models fed with pre-satellite observations of sea ice concentrations provided one layer of data.
To spot-check the model results during that early part of the record, the researchers drew on more than 8,000 Old Weather observations indicating the presence or absence of sea ice.
That data comes from U.S. Navy and Fisheries Service ships as well as the Revenue Cutter Service, the precursor to the Coast Guard.
The ship logs and the models were largely in agreement that the ETCW’s impacts were confined to ice on the Atlantic side of the Arctic.
Models also showed that the rate of sea ice volume loss in the early 20th century was about a sixth what it’s been since 1979, reinforcing that today’s pan-Arctic ice declines are historically unprecedented.
The U.S. Revenue Cutter Thetis moored to sea ice near King Island, Alaska, in 1903
Courtesy of Coast Guard Museum Northwest
Julienne Stroeve, a sea ice researcher at the NSDIC, highlighted other attempts to reconstruct historical sea ice trends such as the Walsh dataset which draws on old sea ice charts and whaling ship logs.
But she said the new study’s model was “really the best means to try to reconstruct sea ice thickness at this point.”
What’s more, the ability of old ship logs to verify that reconstruction indicates they’re a valuable new pipeline of climate data.
Schweiger said there’s plenty more information that can be extracted from the logs, including sailors’ colorful descriptions of ice which scientists are trying to figure out how to quantify.
There’s also plenty more digitization work left to be done.
“There are warehouses full of ship logs we haven’t looked at yet,” Moore said.
“It’s a wonderful use of citizen science, and I think another way we can multiply our efforts to engage people who have a concern about the climate.”
Links :


No comments:
Post a Comment