Wednesday, March 7, 2012

Restored map reveals early Arabian trade links with China

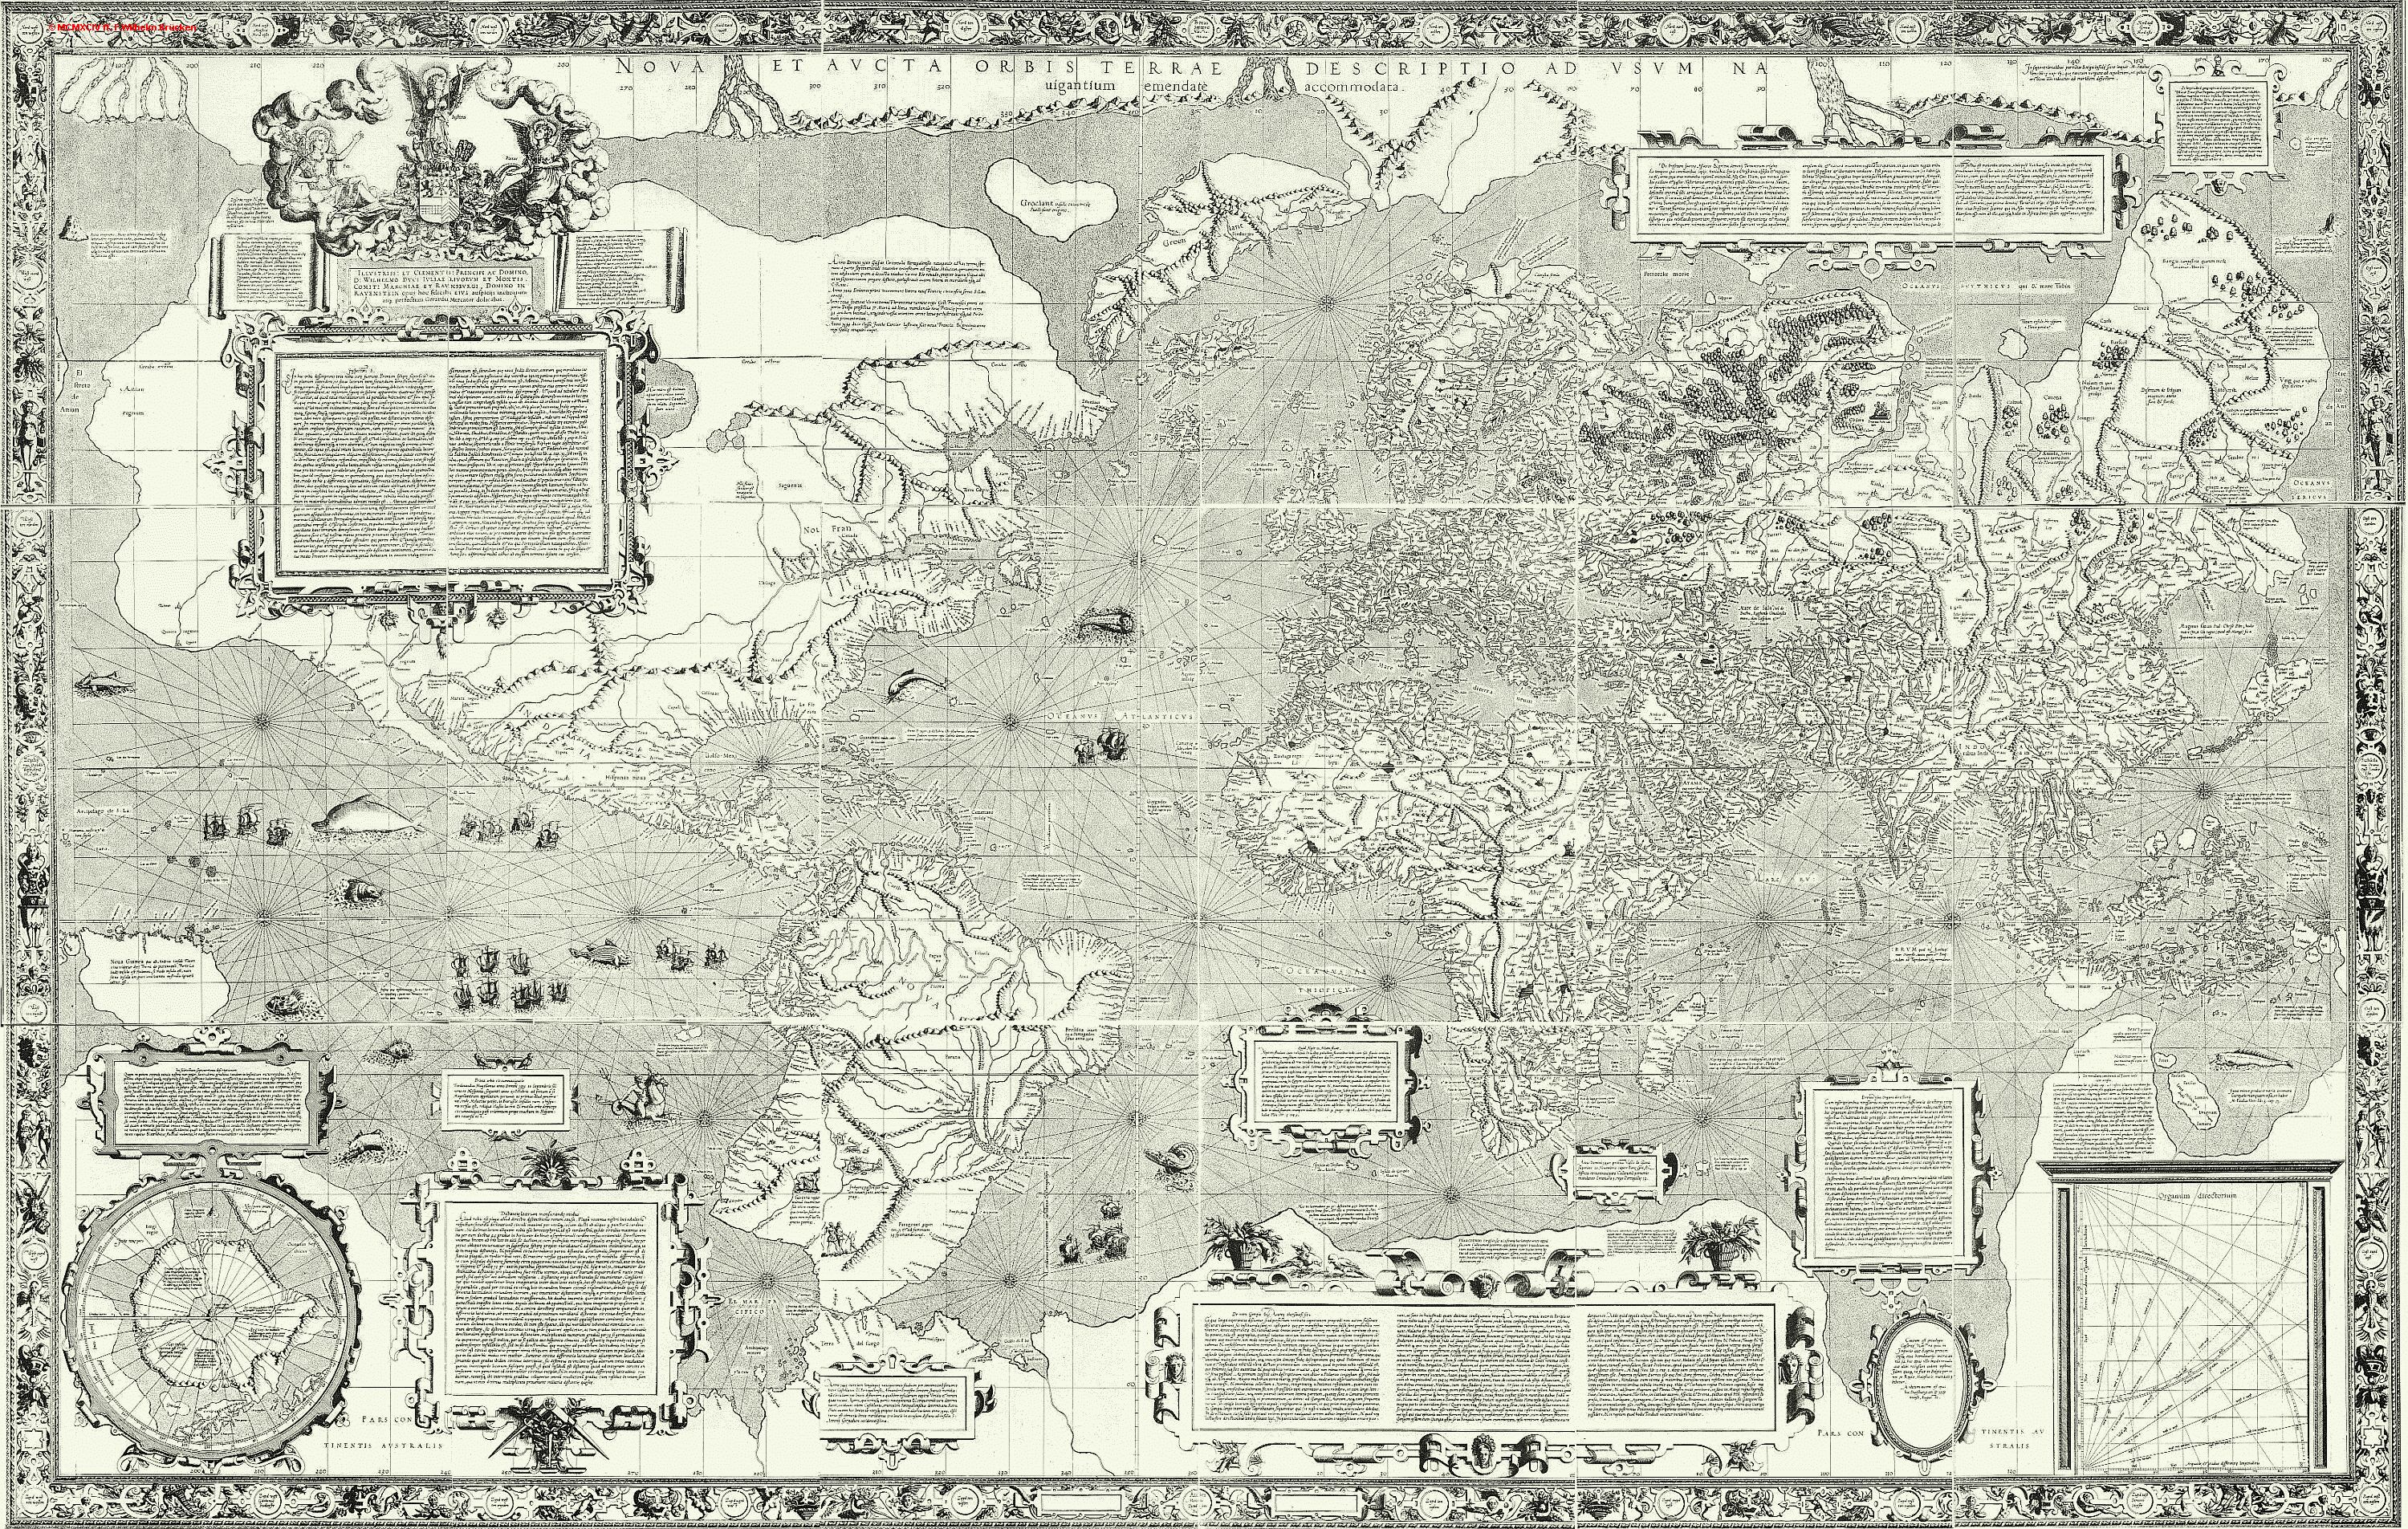
What is the Selden Map? A late Ming water color map of East Asia, including China, Korea, Japan, the Philippines, Indonesia, Southeast Asia and part of India, probably executed in the 1620s.
The map has no title, and is very large, approximately 1×1.5m.
The text is in Chinese, but there are some Latin annotations by a later hand.
The map shows shipping routes and compass bearings from the port of Quanzhou across the entire region.
A panel of text on the left of the map near Calicut, its western extremity, gives directions of the routes to Aden, Oman, and the Strait of Hormuz.
The map has always been known as an interesting curiosity from the time it arrived in the ‘Bodleian’ Library, but its importance was first recognized by the visiting American scholar Robert Bachelor in January 2008.
He was the first to notice the shipping routes, which make the map unique among both Chinese and indeed European maps of the period, and has described it as “an object of globally recognizable significance.”


From TheNational

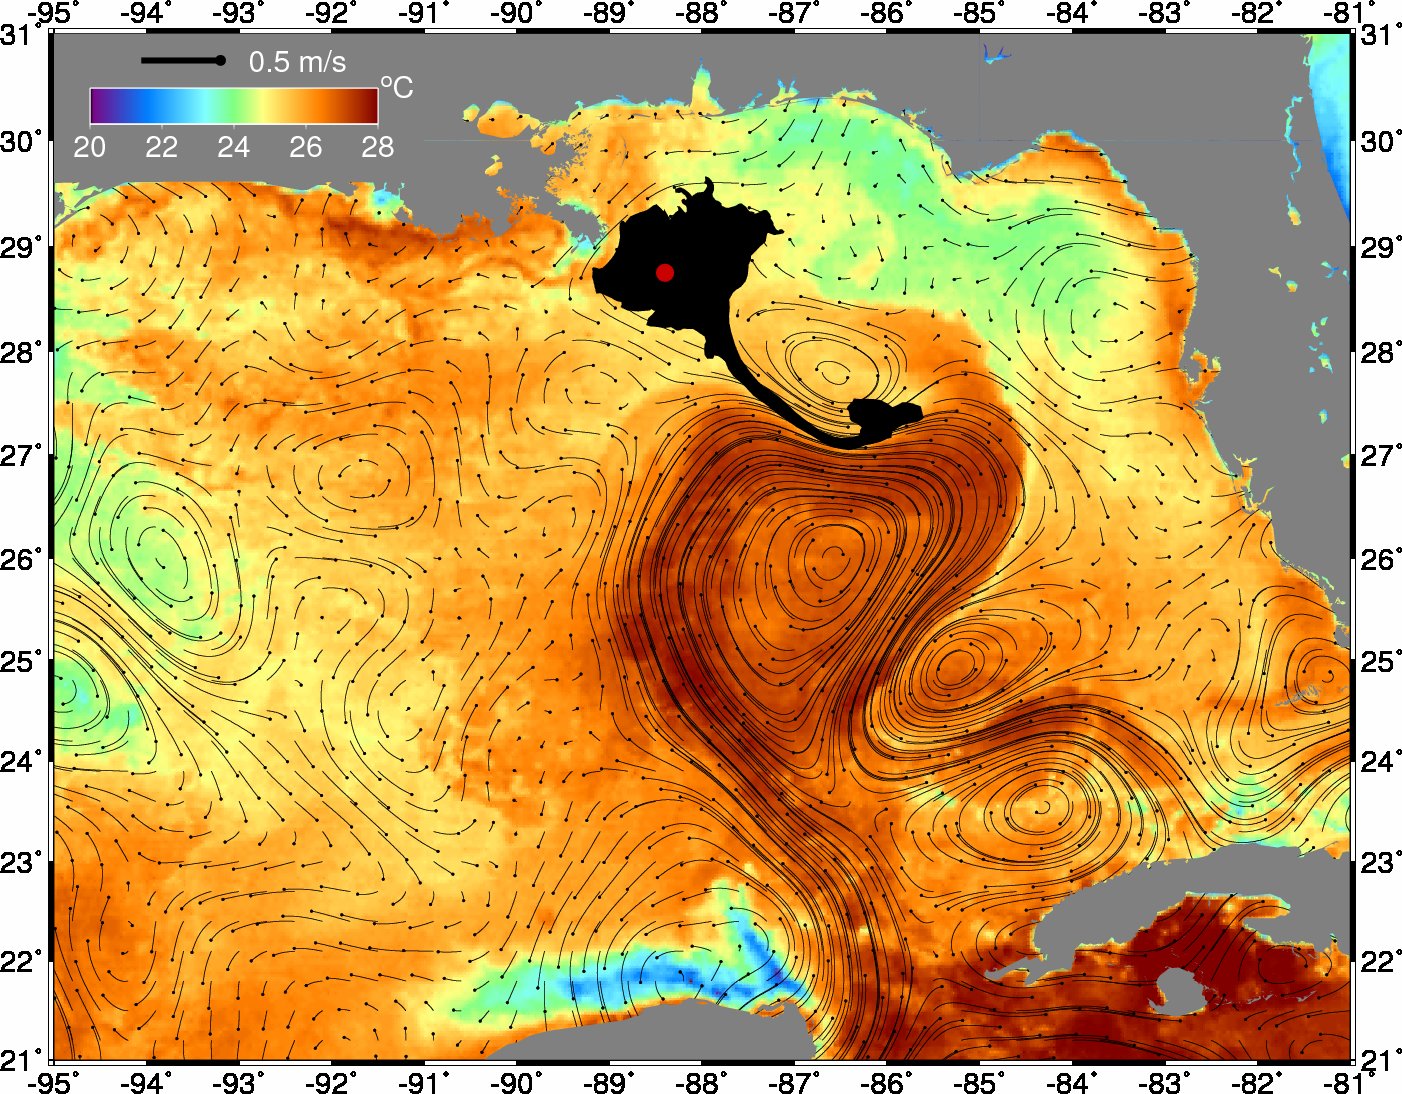
With Beijing's claims to the South China Sea never far from the headlines thanks to the assertiveness of modern China, a recently restored map offers some welcome historical perspective on the oceans in East and South East Asia.

Unearthed nearly four years ago in a fragile and discoloured state, the Selden Map of China was bequeathed to England's University of Oxford in 1659 after the death of John Selden, a London lawyer and linguist.

It shows sea routes fanning out from Quanzhou in Fujian province in south-east China, a city that attracted a mention in Marco Polo's account of his travels, and which still contains reminders of its Muslim-influenced past.
Indeed, while it remains unclear exactly who produced the map, one possibility is that a member of Quanzhou's sinicised community of Islamic merchants was responsible.
Such is the interest in the map's origins now, that Timothy Brook, a professor at the University of British Columbia and author of several books about Chinese history, is currently writing a volume titled Who Drew the Selden Map?.

"Rather than showing China from within, it sees China from without. In particular, it sees it from the water, which is not the perspective that Chinese themselves have taken when looking at their country," says Brook.

China is depicted in terms of its relationship with its neighbours, and the map even stretches to include parts of India.

"What this map shows is an interest in the fact that Chinese (and especially Fujianese) people lived in most of the major ports in South East Asia by the early 17th century, from those of Siam, the Malay Peninsula and western Java to Manila and Nagasaki," says Robert Batchelor, an associate professor of history at Georgia Southern University.

The document also indicates an interest in the Arabian Peninsula among the Fujianese merchants.
One corner has written directions for travelling from Calicut in India to Aden in Yemen, Salalah in Oman and the former kingdom of Ormuz in the Arabian Gulf.
This ties in with the possibility that the map may have been produced by a group of Quanzhou-based Islamic merchants.
"It also suggests that the ties between Arabia and South China were [neither] superficial, [nor did they] disappear with the arrival of Europeans in the 16th century," according to Batchelor. "That is why this is a map that should be of interest in particular in Iran, the UAE, Oman and Yemen. It speaks of a continuity of global history."

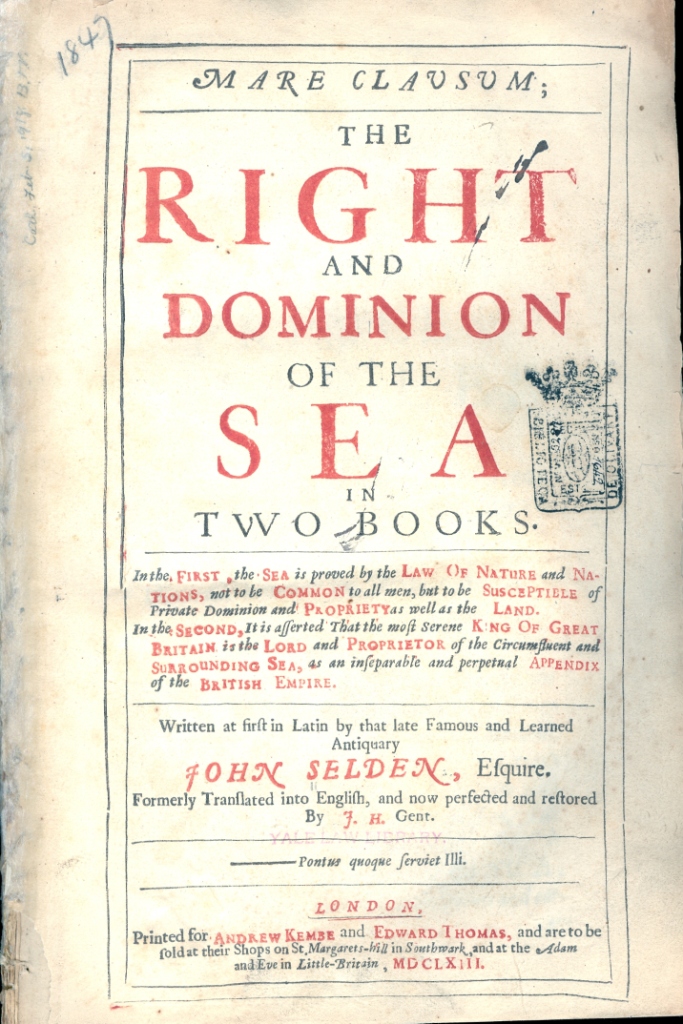
Selden himself wrote a book titled Mare Clausum (Closed Seas) that argued against the Dutch view at the time that favoured freedom of the seas and, says Batchelor, the lawyer read the map as indicating a kind of dominion over the areas where trade was taking place.

However, the merchants of the early 17th century are unlikely to have seen it as a way of staking claims to, for example, mineral or fishing rights.
Instead, Batchelor takes the view it shows their interest in and involvement in the seas depicted.
"Rather than a closed China or a globally overpowering China, the Selden Map gives us a window onto the complex and dynamic set of relations that defined East Asian trade in the 17th century," he says.

Brook says there is nothing to show Ming China tried to claim territory beyond its borders.
The map is one of trade, not empire: "Anyone who tries to use this map to enlarge Chinese claims for a greater empire is engaging in political mischief," he says.

Yet, while the map may not have great political significance, even in historical terms, it is of interest to academics, not least because it offers information available from relatively few other sources.
Batchelor contrasts this situation with that of the English East India Company and its Dutch equivalent.
Their links to their respective governments meant the activities of these organisations were well documented and the evidence preserved for later generations.

"By comparison, we know very little about 17th-century Chinese merchants because they were not sponsored by the state. Their private archives and libraries have largely been destroyed over the centuries," he says.

It is perhaps especially important that sources such as the Selden Map are understood, given that analysis of certain documents has often resulted in outlandish claims about Chinese explorers.
In particular, the author Gavin Menzies suggested in his book 1421: The Year China Discovered the World that the 15th-century Chinese admiral Zheng He discovered the Americas before Christopher Columbus.
The claim is based upon an 18th-century map said to be a copy of one from the 15th century.
Menzies' views are generally dismissed by academics and Batchelor describes such "dubious" maps as "efforts from later centuries to make up for the lack of a Selden Map".

Clumsy preservation efforts meant that, until recently, the map was in a poor state of repair.
It was discoloured, the paint on it was cracking and a linen backing from a century ago had turned stiff, cracked, and been patched up.
Restoration took about a year, says Robert Minte, a conservator at Oxford's Bodleian Library, who carried out much of the work.
Experts at the British Library and the British Museum also took part.

"It was in an extremely fragile condition," says Minte.
"It had been [lined] with very heavy cotton and rolled up very tightly, so every time the map was unrolled there were fragments coming off. It was very difficult to handle."

The task was to remove the heavy cotton lining and the various patches while trying not to damage the "extremely thin" Chinese paper on which the map was painted.
This work, much of it done with the map face down on a Perspex table, was complicated by the fact that many of the patches were stuck on with a strong glue and the paper to which they were attached was fragile.
A bamboo spatula was used to tease away the patches.
New pieces of Chinese paper were added to fill in gaps in the original map, and three linings of Japanese paper were attached to strengthen the map, although Minte describes it as "still quite vulnerable".
"It can [however] survive far more safely and be displayed much more safely," he says.

The painstaking restoration achieved more than helping to preserve the map.
It also uncovered many features that would otherwise have been hidden.
"Because we spent so many weeks and months looking at the map, we could describe areas of detail through the work we were doing. Some of the most interesting were the details on the back underneath the cotton lining," Minte says.

For example, some trading routes are mapped out on the back of the map, in particular the main trade route from Japan to Vietnam, suggesting that whoever produced the map started on one side and then may have decided, for whatever reason, to turn the paper over and have another go.
"We're not quite sure whether that's a preliminary drawing or something they started, then made a mistake and changed something," Minte says.

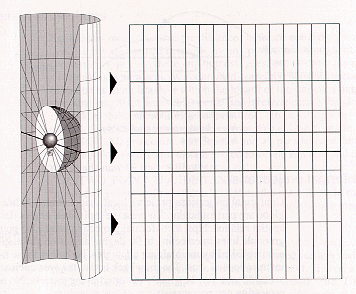
Batchelor thinks the drafts also indicate a fundamental difference in the technique of mapmaking, with the routes drawn first, in contrast to western maps based on a grid system.
"This suggests different approaches to mapping, navigation and mathematics, which have interesting similarities to our current notions of 'networks'," he says.
"Indeed, the map itself shows a system rather than just routes, and this is very early for anyone to be thinking about trade systematically."

Tuesday, March 6, 2012

America’s maritime power


Bordered by ten nations and including some of the world's most important shipping lanes and fisheries, the South China Sea is a vital region.
Critically important mineral resources, including oil, are thought to be there in large quantities as well.
The Chinese have long laid claim to nearly the entire South China Sea.

From LeMondeDiplomatique

US returns in strength to the Pacific Now that the US is substantially reducing its military spending and withdrawing from present wars, its future intentions, and those places it will seek to control, are becoming clear.
The most important will be the Pacific and the South China Sea.

“Our nation is at a moment of transition,” said President Barack Obama on 5 January when he unveiled a new national defence strategy.
This means the size of the US military will be reduced and some combat missions curtailed, notably mechanised ground combat in Europe and counterinsurgency in Southwest Asia.
The aim is to focus more on other parts of the world, especially Southeast Asia and the Pacific, and on other objectives: cyber warfare, special operations and sea control.
“The US joint force will be smaller, and it will be leaner,” said defence secretary Leon E Panetta. “But…it will be more agile, more flexible, ready to deploy quickly, innovative, and technologically advanced”.

According to Obama and Panetta, the strategy reflects altered circumstances at home and abroad.
The US, weakened by the economic crisis, has a ballooning national debt.
The department of defence must make spending cuts of $487bn over the next 10 years to comply with the 2011 Budget Control Act; and more cuts are possible if Congress fails to reach agreement on additional budget-saving measures in the months ahead.
Abroad, military pressures are not decreasing despite the withdrawal from Iraq, and eventual escape from Afghanistan: the US faces new threats of potential conflict, for instance with Iran (see Iranian options) and North Korea, plus the growing spectre of a rising China.

At first glance the new defence policy can be seen as a pragmatic response to altered fiscal and geopolitical conditions, aimed at providing a smaller force with greater capacity to confront future dangers.
On closer inspection, one can discern a larger strategic intent. Faced with the inevitable erosion of its status as sole superpower and the rise of ambitious rivals in Asia, the US seeks to perpetuate its global primacy by maintaining superiority in key areas of the world and critical forms of combat.
In particular, it will aim to dominate the maritime edge of Asia, in an arc from the Persian Gulf and Indian Ocean to the South China Sea and northwest Pacific.
This will require the preservation of US superiority in air and naval warfare, and continued dominance in cyber-warfare, space technology and other specialised fields.
Counter-terrorism will remain an important Pentagon function, but will be largely delegated to highly trained Special Forces equipped with killer drones and other high-tech paraphernalia.

Managing the contraction of overseas interests and commitments — or, as some would have it, managing the decline of empire — is never easy.
Other great powers that have had to undertake such endeavours — Britain and France after the second world war, Russia after the collapse of the Soviet Union — have found it exceedingly difficult.
Often they have embarked on ill-advised military adventures, such as the 1956 Anglo-French invasion of Egypt (Suez) and the 1979 Soviet invasion of Afghanistan — actions that hastened the collapse of empire, rather than delaying it.
When the US invaded Iraq in 2003, it was at the peak of its power; but the ensuing insurgency lasted so long and cost so much — an estimated $3 trillion — that the US has lost the will (and much of its capacity) to fight any new protracted ground wars in Asia.
From here on, it is highly unlikely that Obama or any other American president, Democrat or Republican, would authorise a major operation akin to the interventions in Iraq and Afghanistan.

Obama and his top advisers, cognisant of this history, are determined to avoid the strategic mistakes of earlier leaders.
But if they recognise the folly of attempting to cling to all overseas commitments, knowing it would bankrupt the nation, they have no intention of presiding over a rapid contraction of foreign interests, seeing this as recipe for greater chaos and decline.
Instead, they are seeking a middle way, choosing to reduce US commitments in some areas — Europe, in particular — while bolstering the nation’s capacity to prevail in areas deemed most important for America’s continued global supremacy.

Containing China

This means dominating the western Pacific and containing Chinese power.
“In many respects, the broader Pacific will be the most dynamic and significant part of the world for American interests for many decades to come,” said Deputy Secretary of State William J Burns last November.
“It already includes more than half of the world’s population, many of its most important economies, key allies, and emerging powers.”
For America to remain strong and prosperous, Burns indicated, it must concentrate its energies in this area and ensure that China does not gain power and influence to America’s disadvantage. “As Asia undergoes profound changes, we need to develop the diplomatic, economic, and security architecture that can keep pace”.

This new “architecture” has many dimensions, military and not.
On the diplomatic front, Washington has bolstered its ties with Indonesia, the Philippines and Vietnam, and reinstated formal relations with Burma.
The White House is also seeking to invigorate US trade with Asia, and pushing for the establishment of a regional trade pact, the Trans-Pacific Partnership (TPP).
This is implicitly aimed at countering the rise of China and its influence in Southeast Asia.
By reinstating ties with Burma, for example, the US gains a voice in a country where China, until recently, had few competitors; the proposed TPP would exclude China on technical grounds.

Alongside these economic and diplomatic moves are significant military initiatives.
For Asian states to grow and prosper, American strategists believe, they must enjoy unhindered access to the Pacific and Indian Oceans (along with connecting waterways such as the Straits of Malacca and the South China Sea) in order to import essential raw materials (especially oil) and export manufactured goods.
As Burns explained in November, “Asia’s rise has been so dramatic that it is not just remaking Asia’s cities and economies — it is redrawing the geostrategic map. To give one example, half the world’s merchant tonnage now passes through the South China Sea.”

By establishing naval dominance in the South China Sea and adjacent waterways, the US could exercise a form of latent coercive power over China and the other states in the region, much as the British navy once did.
American naval strategists have long been arguing for such a stance, claiming that America’s singular advantage lies in its ability to control the world’s major sea-lanes — an advantage enjoyed by no other power.
It now appears as if the Obama administration has embraced this outlook.
This was clearly implied in the moves Obama announced during his visit to the region in November.
In spite of budget cuts, he said in Canberra: “We will allocate the resources necessary to maintain our strong military presence in this region” and will be “enhancing our presence in Southeast Asia.”
This will involve more frequent deployments by US warships and military exercises in the region.
In addition, Obama announced the establishment of a new US military base at Darwin, on Australia’s north coast, and increased military aid to Indonesia.

Presence and deterrence

Implementation of this grand geopolitical vision has obvious implications for the development of military policy, and this is clearly reflected in the strategic policy unveiled by Obama and Panetta in January.
“As I made clear in Australia,” Obama said, “we will be strengthening our presence in the Asia-Pacific [region], and budget restrictions will not come at the expense of that critical region.” Panetta added: “The US military will increase its institutional weight and focus on enhanced presence, power projection, and deterrence in the Asia-Pacific”.

Although the policy document itself does not identify which specific military components will be favoured, it is clear that emphasis will be placed on naval forces — especially aircraft carrier battle groups — as well as advanced aircraft and missiles.
Thus, while the US army will see a reduction in its total strength from approximately 570,000 troops today to 490,000 in 10 years’ time, Obama has vetoed plans for any reduction in the navy’s carrier fleet.
Also, the US will invest substantially in weapons aimed at defeating potential adversaries’ “anti-access/area denial” (known as A2/AD) capabilities — the planes, missiles, and ships designed to overpower US attack forces (especially aircraft carriers) in contested areas.
Because China is expected to enhance its capacity to strike American naval forces operating in the South China Sea and other areas on its periphery, US forces will be equipped with greater defences against these so-called A2/AD capabilities.

As the new Pentagon blueprint puts it: “In order to credibly deter potential adversaries and to prevent them from achieving their objectives, the United States must maintain its ability to project power in areas in which our access and freedom to operate are challenged” — a clear reference to the East and South China Seas, as well as waters off Iran and North Korea. In these areas, it is claimed, potential adversaries “such as China” will use “asymmetric means” — submarines, anti-ship missiles, cyber warfare — to defeat or immobilise US forces.
Accordingly, “the US military will invest as required to ensure its ability to operate in anti-access and area denial (A2/AD) environments”.
This means that the US will place top priority on dominating the maritime periphery of Asia, even in the face of opposition from China and other rising powers.

Links :

Monday, March 5, 2012

Gerardus Mercator : father of modern mapmaking


Today March 5, 2012 marks the fitfth centenary of the birth of Gerardus Mercator who developed the famous map projection able to represent lines of constant course as straight segments, thus preserving the angles, which proved useful in navigation.

The 'Mercator projection' that bears his name was first used by him in 1569 for a wall map of the world on 18 separate sheets entitled:
"New and more complete representation of the terrestrial globe properly adapted for its use in navigation."
The 'Mercator projection' had the property that lines of longitude, latitude and rhumb lines all appeared as straight lines on the map.
He had, he wrote on the map:
"... spread on a plane the surface of a sphere in such a way that the positions of all places shall correspond on all sides with each other both in so far as true direction and distance are concerned and as concerns true longitudes and latitudes."


With his world map published in 1569, the title of the original map telling us as much (Nova et aucta orbis terrae description ad usum navigantium emendate et accomodata translated as “new and improved description of the world amended and intended for the use of navigators”), the Flemish cartographer presented a new method to portray the globe on a two-dimensional, angle-preserving map.
This means that angles between the different directions on the map correspond to the directions on the earth’s surface.


On this Mercator projection, Greenland and South America appear similar in size.
The inset map shows that South America is actually about 15 times larger than Greenland.

(see "political controversy")

As it is impossible to project the spherical surface of the earth on a flat surface without distortion, Mercator’s cylindrical map projection uses these distortions to render them user-friendly for nautical purposes.

Marine GeoGarage for nautical charts ideally based on the Google Maps web viewer

Although the Mercator projection significantly distorts scale and area (particularly near the poles), it has two important properties that outweigh the scale distortion:
  • it’s a conformal projection, which means that it preserves the shape of relatively small objects. This is especially important when showing aerial imagery, because we want to avoid distorting the shape of buildings (square buildings should appear square, not rectangular).
  • it’s a cylindrical projection, which means that north and south are always straight up and down, and west and east are always straight left and right.
 
Graphic scale from a Mercator projection world map, showing the change with latitude - 
A good illustration of how distorted the Mercator projection really is
(upload.wikimedia.org)
 Google Maps is based on a close variant of the Mercator projection : to simplify the calculations, Google Maps uses the spherical form of this projection also called WGS84 web Mercator (or pseudo-Mercator), not the ellipsoidal form.
Since the projection is mainly used for map display, and not for displaying numeric coordinates (the Latitude/Longitude geographic coordinates of features on Google Maps are the GPS coordinates based on the WGS 84 datum), we don’t need the extra precision of an ellipsoidal projection.

The difference between a sphere and the WGS 84 ellipsoid causes the resultant projection not to be precisely conformal.
However, the discrepancy is meaningless at the global scale but causes maps of local areas to deviate slightly from true ellipsoidal Mercator maps at the same scale.
However, the spherical projection causes approximately 0.33% scale distortion in the Y direction, which is not visually noticeable.


Since the Mercator projection goes to infinity at the poles, it doesn’t actually show the entire world : so Google Maps cannot show the poles.
Using a square aspect ratio for the map, the maximum latitude shown is approximately 85.05 degrees north and south.
Although cutting off coverage, this is not considered a limitation, given the purpose of the service for aid to navigation.
Not a lot of boats sail at those latitudes...

The great circle route from Seattle to London is a straight line on the gnomonic map projection.
Circular “compass roses” at points where the route crosses major meridians are projected as ellipses, showing the distortion of directions that makes it possible to measure true azimuths only roughly along the route.

(courtesy of ESRI)

Portion of a world map made with the Mercator projection showing the rhumb line and great circle route from Seattle to London.
The great circle route, obtained from a gnomonic projection, has been divided into 500 nautical mile legs.
Since the Mercator projection is conformal, each simplified compass rose is correctly projected as a circle.

(courtesy of ESRI)

Originally designed for use in nautical navigation, Mercator's projection is a map of the Earth's surface on which straight lines, called rhumb lines (or loxodromes), represent a course of constant compass heading.
On the surface of a sphere, however, such rhumb lines are not the shortest distance between two points. Rather, the shortest distance between two points is a great circle (or orthodromes), whose shape is displayed for the routes on the Marine GeoGarage charts (great circle distance calculations)

Links :

Sunday, March 4, 2012

VOR at reaching

Bringing the colour: Cammas stand out as French crew led on way to Auckland

Credit: Yann Riou/Groupama Sailing Team/Volvo Ocean Race


Live at the extreme in the Volvo Ocean Race
(other video)

Saturday, March 3, 2012

The last reef 3D : cities beneath the sea


The production team used underwater 3D technology to film the vibrant life that is part of the ecosystems of the world’s coral reefs, from giant clams, brilliant anemones, and darting jellyfish, to dolphins and sharks.

From the Academy-Award nominated creators of the Broadway show STOMP and the award-winning film Wild Ocean, The Last Reef is an uplifting, inspirational large-format and 3D cinema experience capturing one of nature's more vibrant and diverse wonderlands.


Filmed off the Wild Coast of South Africa, WILD OCEAN is a timely documentary that celebrates the animals that now depend on us to survive and the efforts by local people to protect this invaluable ecological resource

Exotic coral reefs, vibrant sea walls in the sub-arctic pulsating with anemones and crustaceans: these biodiversity hot spots are as vital to our lives as the rainforests.

Shot on location in Palau, Vancouver Island, French Polynesia, Mexico, and The Bahamas using groundbreaking 3D cinematography, The Last Reef takes us on a global journey to explore the connection of our cities on land with the ocean's complex, parallel world of the coral reefs beneath the sea.

Friday, March 2, 2012

Humour : under the sea with the startup ecosystem

From Memeburn

Ever wondered how the startup world really works?
Are you dying to know who the key players are in this mystical world?
Do you lie awake at night cursing the sky hoping your anguish will penetrate the darkness and send you some answers?
Well, it’s your lucky day.

The idea of a startup ecosystem is actually quite simple.
There are 13 key players.
Yep, it only takes 13 people to make a startup work.
These fearless men and women venture out into dangerous seas braving the predators while eyeing out their prey.

The team at udemy, a company whose aim is “to disrupt and democratize the world of education by enabling anyone to teach and learn online”, has put together an infographic that better explains the roles of the 13 people it takes to make the startup machine run.
I particularly like that they are all depicted as some sea creature with either razor-sharp teeth or lots of tentacles.
I find the scientific names for each member of the ecosystem rather accurate.
I particularly like, “Tech Blogger”, scientific name: “Technologicalium Knowitallicus”.
“The startup waters are murky and full of hidden dangers. Below the surface, the ecosystem rests in a delicate balance between predators and prey,” says Udemy.


So to help you navigate the stormy seas, take a gander at the infographic below.


Prosecutors target cruise ship captain, Costa executives


From Reuters

The captain of the Costa Concordia, the liner which capsized off the coast of Italy last month killing at least 25 people, made a series of errors that were compounded by failures onshore by the ship's operators, according to prosecution documents.


The shipping journal Lloyd's List Intelligence put out a statement that said the route Schettino steered, which ship owner Costa says was a deviation, kept the ship 500 meters from shore, while "the previously approved route took the vessel far closer to shore than the 500 meters claimed by Costa."

Prosecutors accuse captain Francesco Schettino of causing the accident by bringing the giant vessel too close to shore where it struck a rock that tore a large gash in the hull, causing water to flood into the engine rooms.
He is under formal investigation in the case, accused of multiple manslaughter and abandoning ship before the evacuation of more than 4,200 passengers and crew was complete.
On Thursday, prosecutors added two new counts to the charge sheet, accusing Schettino of abandoning incapacitated passengers and failing to inform maritime authorities.
Officials confirmed that tests showed he was not on drugs at the time of the accident.

First officer Ciro Ambrosio and seven other ship's officers and executives of the operator Costa Cruises are also under investigation.
They include the vice president of Costa Cruises, Manfred Ursprunger and Roberto Ferrarini, head of the company's crisis unit, with whom Schettino was in contact during the evacuation.
Pretrial hearings, including an investigation of the ship's "black box" recorders, are due to open on March 3.

The Costa Concordia foundered and capsized meters from the shore off the Tuscan island of Giglio on Jan. 13. At least 25 people died in the accident and a further seven are unaccounted for.
Eight bodies, including that of a five year-old girl, were found by divers on Wednesday on the submerged deck of the liner, which lies on its side in some 20 meters of water.


Underwater video from Guardia Costiera taken on January 17, 2012 at the "Le Scole" rock showing twisted wreckage on the sea floor, left by the cruise liner Costa Concordia after it ran aground in front of the Isola del Giglio harbor

Schettino is blamed for bringing the ship near to the rocky shore in order to perform a display maneuver known as a "salute," but prosecutors have also pointed to wider failures in the management of the accident.
In documents filed on Wednesday notifying Schettino of the impending investigation, prosecutors say Schettino slowed the ship down while he was having dinner on the night of the accident, then sped up to 16 knots to make up time, despite being in shallow water.


They also say his nautical charts were not appropriate and not detailed enough to reveal obstacles including the rock on which the fatal impact occurred.

The report also points to the large number of people in the bridge area at the time of the accident, including Domnica Cermotan, a friend of Schettino's.
They say this "generated confusion and distraction for the captain."

It says he failed to perform appropriate maneuvers to avoid the collision, did not activate procedures to seal the ship, and did not take charge of the crew during the operation.
He also took too much time to sound the general alarm and order the evacuation of the ship.
The prosecutors also blame Costa's crisis unit of being "culpably unaware of the real situation on board the ship" and of falling to properly verify the information provided to it by Schettino.

The unit limited itself to "bureaucratic aspects...and to the future prospects of repairing the ship," the report said.
As well as the official investigation, Costa and its parent company Carnival Corp, the world's largest cruise operator, face a wave of civil suits from the victims' families and from passengers and crewmembers aboard the ship.

Links :

Thursday, March 1, 2012

CryoSat breaks the ice with ocean currents


Animation of the intensity of ocean surface currents as predicted by MyOcean’s global ocean model (1/12°) after assimilation of altimetry data.
In addition to major currents such as the Gulf Stream, the turbulence driving the ocean circulation is visible.
The blue-to-white colour scale represents surface currents in metres per second.
Credits: MyOcean/Mercator-Ocean

From ESA

Ocean measurements from ESA’s CryoSat mission are being exploited by the French space agency CNES to provide global ocean observation products in near-real time.
Understanding sea-surface currents is important for marine industries and protecting ocean environments.

As it orbits from pole to pole, CryoSat’s main objective is to measure the thickness of polar sea ice and monitor changes in the ice sheets that blanket Greenland and Antarctica.
But the satellite also features an innovative radar altimeter that not only detects tiny variations in the height of the ice, but can also measure sea level and the height of the waves.
Starting today , CryoSat ocean measurements are being processed by CNES and distributed to the oceanography community.
These products will be assimilated using models from the MyOcean project in near-real time to enhance sea surface products and to improve the quality of the model forecasts.

“This achievement is the result of the long-standing collaboration and partnership between ESA and CNES,” says Tommaso Parrinello, CryoSat Mission Manager.
“Through a fusion of processors derived from operational altimeters and experimental software developed specifically for CryoSat’s innovative instrument, CNES experts will be able to transform raw ocean data flows from CryoSat into a quasi-operational end-user ocean product of high quality.
Ocean topography is an important key environmental parameter to understand how ocean circulation responds to climate change.”


Radioactive pollution
With MyOcean’s 3D model forecasts, it is possible to predict the trajectory of particles (red dots) initially positioned near the Fukushima power plant (green square).
Understanding how the radioactive pollution is driven by local ocean turbulence and the Kuroshio Current (background image) is important for identifying critical areas for the fishery industry.
Credits: MyOcean/Mercator-Ocean

Coastal models and applications will also benefit from the additional coverage provided by CryoSat.
Users can obtain these products through the AVISO website or MyOcean data portal.
Within the Global Monitoring for Environment and Security (GMES) programme, the MyOcean project is responsible for the development of marine monitoring services.
During major crises such as the Deepwater Horizon and Fukushima disasters, MyOcean models exploited remote sensing data – in particular, altimetry data – to help monitor these crises.
Altimetry data is of highest importance to predict the evolution of local marine currents in near-real time.


Oil spill movement prediction
Like sea-surface temperature features in the Gulf of Mexico (background image), the Deepwater Horizon oil spill, here detected by SAR sensors from the Radarsat-2 satellite (black stain), is pumped away by the Loop Current observed with altimetry (black arrows).
With more altimetry data, ocean models can provide a better prediction of such local events.
Credits: Univ. Colorado/CNES/AVISO/GOES SST/Radarsat-2

A wide range of operational marine applications and services with social and economic benefits needs sea-surface currents: oil spill or marine debris tracking and prediction, fishery and offshore industry support, including cost and risk reduction, optimised ship routing, iceberg detection and alert for worldwide ship racing.

Sea-surface topography Altimeter data from ESA’s Envisat and CryoSat-2 were merged with CNES/NASA/NOAA/Eumetsat satellites Jason-2 and Jason-1 to produce this map of sea-surface topography on 1 January 2012.
Credits: CNES/AVISO

Since the launch of the first European Remote Sensing satellite in 1991, radar altimetry has been used to observe ocean surface topography and geostrophic currents continuously.
It has become an invaluable asset for the accurate forecast modelling of ocean currents.