Five years of global sea-surface salinity from space
Variations in 10-day mean sea-surface salinity derived from SMOS data
over a five-year period on a grid resolution of 0.5 x 0.5°.
Nicolas Reul (Ifremer)
From RT
A group of international researchers is developing "pioneering techniques" to monitor the acidity of oceans from space, using satellites that can orbit the Earth up to 700 km above us in hard-to-reach areas, like the Arctic, much faster than before.
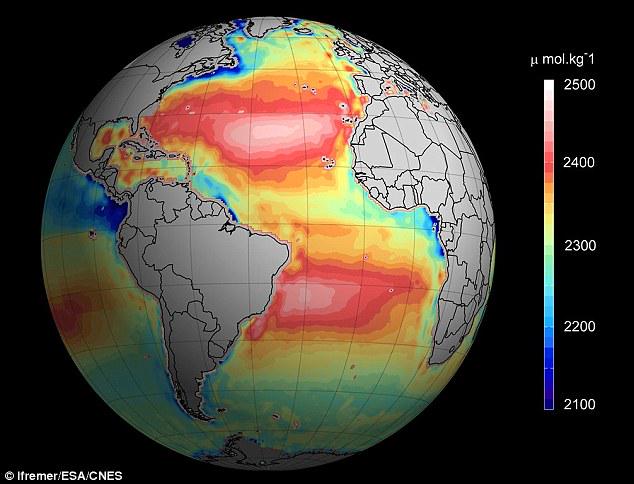
Scientists have used satellite data to map the alkalinity of the world's oceans for the first time.
The image above shows the average level of alkalinity over the past five years with blue marking water that is more acidic.
By using satellite data, scientists can obtain live information as the ocean changes
According to the scientists, a number of existing satellites can be used for the task, including the European Space Agency's Soil Moisture and Ocean Salinity (SMOS) sensor that was launched in 2009 and NASA's Aquarius satellite launched in 2011.
"Satellites are likely to become increasingly important for the monitoring of ocean acidification, especially in remote and often dangerous waters like the Arctic.
It can be both difficult and expensive to take year-round direct measurements in such inaccessible locations," said lead researcher Dr Jamie Shutler, of the University of Exeter.
"We are pioneering these techniques so that we can monitor large areas of the Earth's oceans allowing us to quickly and easily identify those areas most at risk from the increasing acidification," he said.
Sea-surface salinity and ocean circulation
Average sea-surface salinity values.
Areas of red indicate regions of high salinity, and areas of green indicate regions of low salinity.
The map is overlaid with the simplified global circulation pattern called the ‘thermohaline circulation’.
The blue arrows indicate cool deeper currents and the red indicate warmer surface currents.
Temperature (thermal) and salinity (haline) variations are key variables affecting ocean circulation.
Each year, over a quarter of global CO2 (carbon dioxide) emissions from burning fossil fuels and cement production are absorbed by the planet's oceans.
This process makes the seawater become more acidic and as a result more difficult for some marine life to exist.
Growing CO2 emissions, along with the rising acidity of seawater, could devastate some marine ecosystems over the next century, ecologists warn, and that's why endless monitoring of changes in ocean acidity is vital.
A report issued before a United Nations climate summit in New York put 2014 world carbon emissions 65 percent above levels in 1990, despite repeated promises of curbs and a shift to renewable energies.
It said world emissions could reach 43.2 billion tons in 2019, with 12.7 billion from China alone, as the number one carbon emitter.
Global salinity maps from SMOS (ESA/IFREMER)
Current methods of measuring temperature and salinity to determine acidity are restricted to in situ tools and measurements from research vessels.
Since such vessels are expensive to run and operate, the approach limits the sampling only to small areas of the ocean, however.
The groundbreaking techniques use satellite mounted thermal cameras to take ocean temperatures, while microwave sensors check salinity.
These measurements can be used to assess ocean acidification more quickly and over much larger areas than has been possible before, researchers say.
"In recent years, great advances have been made in the global provision of satellite and in situ data.
It is now time to evaluate how to make the most of these new data sources to help us monitor ocean acidification, and to establish where satellite data can make the best contribution," said Dr Peter Land from Plymouth Marine Laboratory, the lead author of the paper, set to be published on Tuesday in the journal Environmental Science and Technology.
Scientists from the University of Exeter, Plymouth Marine Laboratory, Institut français de recherche pour l'exploitation de la mer (Ifremer) and the European Space Agency took part in the research.
Links :
- GeoGarage blog : Aquarius to Illuminate links between salt, climate / Satellite produces map of global salinity / ‘The other CO2 problem’: How acidic oceans will cost our economy billions / Acidifying ocean threatens California coast / An acid test for policy / Study: our oceans are so acidic they're dissolving snails / Google Earth tour of a more acidic world / Acid test / Ocean acidification : the other CO2 issue / Oceans failing the acid test, U.N. says

No comments:
Post a Comment