
Depth measurements available at the time of flights MS804, MH370 and AF447 crashes
From EOS by
An assessment of ocean depth knowledge underneath commercial airline routes shows just how much of the seafloor remains "terra incognita."
It has been 3 years since Malaysia Airlines flight MH370 disappeared, and no trace of it on the seafloor has yet been found. MH370 is believed to have deviated from its intended flight path.
Yet even the typical routes taken by overseas flights are often over unknown seafloor.
In fact, of the total over-ocean distance covered by all unique overseas flight routes, 60% is above unmapped areas.
The quality of mapping that does exist varies widely, and the lack of data and variance in quality hinder searches for missing aircraft, hazard assessments, and the pursuit of baseline scientific knowledge.
A modest effort could fix this lack of data.
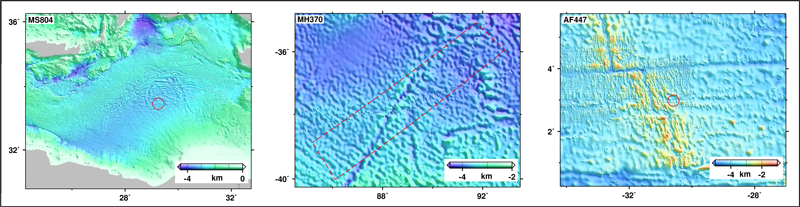
Shaded relief images of 800*600km regions in search areas of MS804, MH370 and AF447.
Uneven Coverage
Only a small percentage of Earth’s seafloor has been mapped [Copley, 2014; U.S. National Ocean Service, 2014].
For example, Smith and Marks [2014] reported that only 5% of the southeast Indian Ocean seafloor was covered by echo soundings on 8 March 2014 when Malaysia Airlines flight MH370 went missing.
Since their publication, the MH370 search area was moved to an area where data coverage was only 1% at the time the aircraft was lost.
In January 2017, the search was suspended after 120,000 square kilometers had been mapped in efforts to find the aircraft.
This is roughly 1/3 of the area shown in Figure 1 and 0.0336% of the area of Earth’s ocean floor.
Bathymetry of Mediterranean sea (GEBCO)
Comparing these three search regions at the same scale shows that ocean mapping varies enormously from region to region (Figure 2).
The AF447 search region also illustrates the strong bias toward mapping of mid-ocean ridges at the expense of other areas [Smith, 1998].
Following the Airplanes
To illustrate the extent of ocean mapping under aviation routes, we compiled a list of these routes using data from the Open Flights project on GitHub.
These data list the originating and terminating airports of regularly scheduled commercial flights and whether or not the service is nonstop.
The actual path taken by any particular flight is determined as air traffic controllers direct each flight to a sequence of waypoints and may change as weather and traffic loads change.
We did not have this level of detail, so we approximated flight routes as great circles connecting the originating and terminating airports.
Since the Open Flights data do not indicate the locations of intermediate stops, we analyzed only nonstop routes.
Some pairs of airports (e.g., New York’s Kennedy and London’s Heathrow) are served by many airlines flying many flights in each direction, but our analysis used each unique pair of airports only once, regardless of the frequency of flights between its airports.
We generated a great circle route connecting each airport pair, sampled that route every 1 kilometer of distance along its path, and then classified each sample point as being over mapped ocean, over unmapped ocean, or not over ocean.
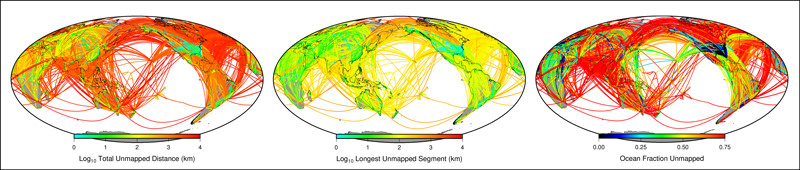
left: total distance over unmapped ocean,
middle: longest segment of any route over unmapped ocean,
right: relative fraction of each route that over unmapped ocean
middle: longest segment of any route over unmapped ocean,
right: relative fraction of each route that over unmapped ocean
We found that the total distance along any individual route includes as many as 9201 kilometers flown over unmapped ocean (Figure 3, left).
Half of all over-ocean routes fly more than 200 kilometers over unmapped ocean, and 10% of the over-ocean routes fly more than 2000 kilometers over unmapped ocean.
The longest contiguous unmapped ocean segment along any one route (Figure 3, middle) is 2293 kilometers, traveled when flying between New York’s John F. Kennedy and Beijing’s Chongqing airports, and more than 20% of routes have a longest unmapped segment exceeding 200 kilometers. On most routes, more than half of the over-ocean portion is over unmapped ocean (Figure 3, right).
We found a total of 19,024 unique nonstop routes.
Of these, 11,665 fly at least 1 kilometer over ocean, and 10,686 fly at least 1 kilometer over unmapped ocean. The total route distance is slightly more than 33.4 million kilometers, 33% of which is over ocean, with 60% of the total over-ocean distance being over unmapped ocean.
These numbers do not indicate the probability that an aircraft or a passenger is over unmapped ocean because our analysis is unable to account for the number of aircraft and passengers flying each route over a given period of time.
Our Criteria
An analysis like our airline route survey has to define how many depth readings it takes to list an area as mapped.
Depth measurements that can be readily obtained and used without specialized access, licensing, or payment, which we call “available” data, are quite variable in their sampling density and in the age, technology, and accuracy of the sounding and navigation systems used.
All these variations are irregularly distributed over the globe [Smith, 1993; Wessel and Chandler, 2011].
We divided the global seafloor area into equal-area square tiles 1 nautical mile on a side and considered any tile mapped if it contained one or more available echo soundings.
For context, modern hull-mounted multibeam echo sounders (MBES) map a swath of the ocean along the ship’s path, but the vast majority of available data (95% of coverage by area) are point values—one depth measurement at one place, typically an analog measurement made by a wireline or a single-wide-beam acoustic sounder [Smith, 1993].
Our method produces a generous overestimate, with some tiles having only one sounding.
Also, the majority of available data are poorly navigated and error prone [Smith, 1993; Wessel and Chandler, 2011].
Even by this generous definition, however, only 8% of the global ocean is mapped [Wessel and Chandler, 2011, Figure 8].
In the 92% of ocean area where depth has not been measured, satellite altimetry interpolates the gaps between available soundings [Smith and Sandwell, 1997; Becker et al., 2009; Weatherall et al., 2015]. This approximation strongly underestimates seafloor topography and roughness [Becker and Sandwell, 2008], with a variety of consequences that affect sciences, from earthquake and tsunami hazard assessment [Mofjeld et al., 2004] to ocean circulation [Gille et al., 2004] and mixing [Kunze and Llewellyn Smith, 2004] and climate forecasts [Jayne et al., 2004].

BA4000 : the UKHO World map in the GeoGarage nautical charts platform
Addressing the Data Shortage
All of Earth’s ocean floors deeper than 500 meters could be mapped at a total cost of $2–3 billion.
All of Earth’s ocean floors deeper than 500 meters (i.e., exclusive of territorial waters and continental shelves) could be mapped by GPS-navigated MBES for 200 ship-years of effort (e.g., 40 ships working for 5 years), at a total cost of US$2–3 billion [Carron et al., 2001].
According to the NASA scientists we consulted, this is less than the cost of NASA’s next mission to Europa.
We hope that our survey of the state of ocean mapping from the perspective of over-ocean flight routes makes the relevance of ocean mapping and the current lack of mapping information clear to the public.
Links :
- GeoGarage blog : From flight 370 hunt, new insight into Indian Ocean's ... / EgyptAir Flight MS804 crashed in deep seas near underwater mountains / Mapping the deep ocean: Geoscience Australia and the ... / MH370: Bathymetric survey / MH370 spur to 'better ocean mapping' / Australia's MH370 search technology questioned / Why is it so hard to find flight 447's black boxes? / BEA yet to confirm possible refinement of AF447 search / Ocean floor to be mapped by 2030 ? / It's time to geek out over a new global bathymetric data set / The floor of the ocean comes into better focus
YouTube : Fugro search for the MH370
ReplyDelete