Credit: Gard Club
From Safety4Sea by Kunal Pathak, Team Leader, Claims, Arendal; Siddharth Mahajan, Loss
Prevention Manager Asia, Singapore; Helge A. Nordahl, Vice President,
Analytics, Oslo; Are Solum, Team Leader, Claims, Arendal, of Gard
P&I Club explore the subject of container losses, in relation to
insurance claims.
In a comprehensive new study, we delve into the impact of weather on container stack collapses.
Our findings show the impact of progressively increasing wave height, the quantified risk of high waves, and variance in weather exposure among different operators.
Hopefully, the study sets the stage for a deeper dialogue within the industry about mitigating the impact of adverse weather on container safety.
As the world economy develops, the volume of containerized trade increases steadily.
Last year, the global container shipping fleet grew by almost four per cent according to UNCTAD, and in Gard’s P&I portfolio, the segment has increased by as much as 16 per cent over the past five years.
It currently makes up 18 per cent of our insured vessels.
With more container shipping comes also a higher risk of casualties.
Certain incidents, such as stack collapses or containers lost at sea, are monitored closely as they tend to be relatively more severe.
Container losses also have the IMO’s attention, and they are working on making reporting of lost containers mandatory.
Meanwhile, insurers and other key stakeholders are involved in detailed work such as the Top Tier project to investigate the causes of stack collapse and seek solutions.
Data analytics
To contribute to the industry understanding and to help prevent losses, we have studied all cases of stack collapse where Gard was involved as a P&I insurer.
These cases occurred between 2016-2021 and we have looked at the weather data to make sure we understand the factors contributing to these incidents.
More specifically, we have combined Gard claims data with geographical and meteorological data from Windward which includes estimated wave height and wind strength on an hourly basis.
When it comes to waves, several measures are common.
For this study, we have used the maximum wave height.
Our claims data includes a wide selection of cases, both when it comes to severity, vessel size, and geographical location.
For each claim we have collected meteorological data for the incident date as well as the six days leading up to the day of the incident.
This allows us to analyse how the weather progressively worsened over a period of time.
Impact of vessel’s size
Weather needs to be seen in context with ship’s design and size, of course, although we do see that container stack collapses happen across different size segments.
This just underscores the fact that there are usually several causative factors involved in these incidents, as highlighted in our article Why do containership stacks collapse and who is liable?
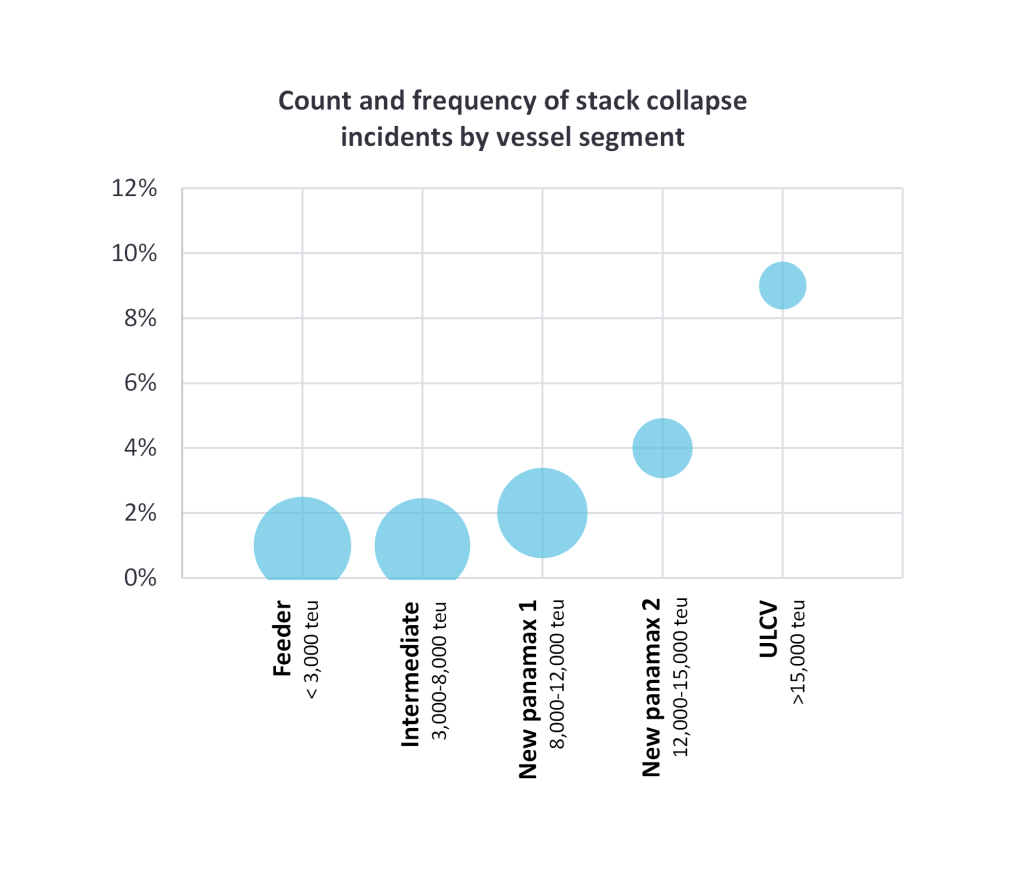
Analysing incident numbers relative to number of vessels in our portfolio provides valuable insights on claims frequency across different size segments, which can range from feeders (less than 3,000 teu) to ultra-large container vessels (ULCVs) exceeding 15,000 teu where the stack heights can exceed 10 high on deck.
Despite a higher number of incidents on smaller vessels, there is a clear correlation between incident frequency (or likelihood) and vessel size, as depicted in the graph below.
The 6-year average claims frequency for stack collapses on feeder vessels is 1%, whereas for ULCVs, it rises to 9%.
Impact of progressively increasing wave height
When looking at a 7-day period before the incident, we noticed that on Day 1, vessels are on average experiencing wave heights of 2.5m, which corresponds to wind force 5 on the Beaufort scale.
The weather then progressively worsens, and this increase in wave height is more pronounced from Day 6 onwards.
The average wave height peaks on Day 7 at 6.5m which corresponds to gale force winds.
The duration for which the vessels were exposed to sea conditions with wave heights of 4m and above (corresponding to near gale force winds or stronger) was 72 hours.
We underline that these are average wave heights of all vessels that had a stack collapse incident.
If we look at each vessel separately, many of them were exposed to these conditions for a much longer duration of time.
During the 7-day period we examined (which is also shown in the graph below), the “incident zone” for majority of the incidents was a 24-hour window on the last day.
It was therefore evident that the vessels experienced average wave heights which progressively increased by two and a half times during the 7-day period.
Interestingly, the incidents did not always happen when the wave height was the highest, but after the weather had started to subside.
This might be partly due to the fact that the time of reporting the incident to Gard may not always coincide with the time of the incident itself.
Average maximum wave heights during the 7 days leading up to the incident
Credit: Gard Club
Higher waves – higher risks
To further study the exposure to high waves, we looked at vessels that are exposed to a wave height of 7m (corresponding to Bf 8 gale force winds) or above.
An observation of interest was that while vessels involved in incidents spent only 5% of their time in wave heights exceeding 7 meters during the incident year, half of all incidents occurred during such conditions.
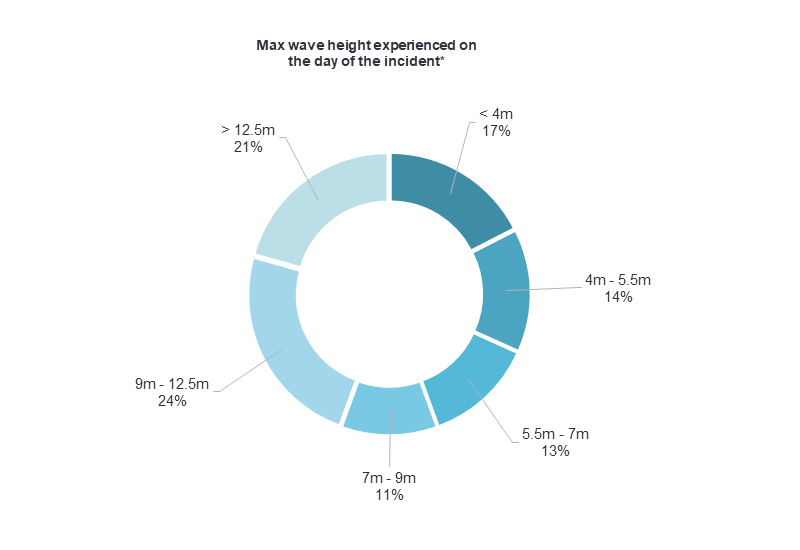
Analysing the maximum wave heights experienced by vessels on the day of the incident, as shown in the graph below, reveals a similar pattern.
Essentially, despite spending 95% of their time in calmer waters, the relatively small percentage spent in adverse conditions significantly amplifies the risk of incidents, potentially up to 20 times higher, as indicated by our study.
Another finding we had was that among the vessels that had a stack collapse incident, the share of vessels exposed to such high waves increased by almost 12 times from day 1 to day 7.
This suggests that these vessels may not have been able to avoid such heavy weather in spite of the advanced weather routeing tools available.
*This chart shows the maximum wave height experienced by the vessels on the day of the incident, whereas the previous graph showed the average of the maximum wave heights to which the vessels were exposed over a 7-day span.
Examining the global container fleet, roughly 3.4 per cent are exposed to such weather at any given time.
Interestingly, among various size segments, the new Panamax 1 segment (8,000 – 12,000 teu) appears to have a higher exposure to wave heights of 7 meters and above compared to any other size category.
This trend is also evident for wave heights around 4 meters.
Differing risk profiles
The variation in exposure to adverse weather is not only limited to different size segments in our container fleet.
From our study for the period 2016-2022 for the global container fleet, we also see that some container operators or owners are more exposed to the risk of adverse weather than others.
In essence, this discrepancy likely stems from differences in operators’ risk tolerance and the internally defined weather thresholds for the vessels.
However, the consequences of decisions made in the chartering or the operator’s desk are quite evident in the safety of the vessel and the cargo.
Reflections
Exposure to progressively worsening weather poses a clear risk, and our studies highlight two crucial aspects in this regard.
The first involves the duration of exposure, while the second concerns weather thresholds, such as maximum wave height for a vessel, influenced by factors like stability, stack height, and physical condition of the securing equipment.
Based on our study findings there are key questions to be considered by the various stakeholders working in the liner industry.
Conflicting priorities on weather thresholds
Does the understanding of the weather limiting factors, such as maximum wind and wave height for a voyage, vary among different stakeholders, and if so, why?
Conflicting priorities may arise between a commercial operator and a vessel’s master regarding voyage routing.
While a master might prefer a slightly longer route with less exposure to adverse weather, a commercial operator might prioritize time and fuel savings, potentially pushing the limits.
Additionally, we’ve noted that routeing advice to a vessel could vary based on whether their principal is a charterer or owner.
Another variable to consider when determining weather thresholds is the vessel’s stability, which may be different from the loading computer calculations, given the misdeclaration of weights and/or a mismatch in stowage location.
Suitable tools for complex rolling phenomena
Do seafarers have access to suitable digital / automated tools for evaluating the risk of intricate phenomena like resonant, synchronous, and parametric rolling?
The term “adverse weather” is subjective to seafarers.
Often, advice on mitigating the risk is either oversimplified (by recommending avoidance of adverse weather altogether) or overly complicated (by suggesting calculations for resonant, synchronous, and parametric roll risks based largely on estimates).
While assessing the influence of weather on a vessel’s motions may seem straightforward in theory, it is much more challenging for seafarers in practice, due to numerous unknowns and estimations.
Slackening of lashings in heavy weather
Whether there is indeed a progressive deterioration of the lashing efficacy that leads to failure beyond a certain time period?
The constant motion of a vessel in heavy seas can exert loads on container stacks, leading to the potential loosening of lashings.
The loosening process can start early in heavy weather conditions, especially if the ship is navigating through rough seas for an extended period.
In theory, routine lashing checks may seem as an appropriate preventive measure, but in practice, this could pose safety concerns, as the crew would then be exposed to adverse weather during lashing checks.
This risk would be even greater onboard larger vessels where there are a lot more lashings to be checked.
Tighter weather routeing for vessels with deteriorated securing equipment
Should weather routeing considerations be tightened for vessels with deteriorated container sockets and lashing eyes?
Experience shows that condition of lashing and securing equipment degrades over time due to usage and inadequate maintenance.
It is no surprise that stack collapse incident investigations often emphasize poorly maintained lashing and securing equipment as contributing factors.
In fact, corroded sockets and lashing eyes rank among the top 3 findings in Gard’s condition survey data for container ships.
Despite these issues, containers continue to be loaded in affected slots, and repairs are postponed until drydock for commercial reasons.
Our recommendation is of course that affected slots be taken out of service until repairs are carried out, but from a pure routeing perspective, weather thresholds might need to be adjusted for such vessels.
We understand that a few liner operators already have such procedures in place on this for both owned and chartered in tonnage.
Impact of weather on cargo securing inside a container
To what extent can the securing of cargoes inside containers endure movement caused by adverse weather?
Prolonged exposure of the vessel to rough weather could lead to deterioration of cargo securing within the container, potentially leading to cargo breaking loose and shifting within the container.
This, in turn, adds additional forces on the container stack.
The ship’s crew lacks visibility and control over this aspect.
The solution involves engaging in dialogue with and educating shippers, along with implementing improved Know Your Customer (KYC) procedures.
Broadening KPIs for weather routeing
Should safe weather routeing and the avoidance of adverse weather be included as components of internal key performance indicators (KPIs)?
Modern digital tools make it much easier to assess a vessel’s or fleet’s exposure to weather over a specific timeframe.
This assessment not only helps a company determine if its vessels encountered weather conditions exceeding internally defined thresholds but also facilitates benchmarking against other vessels of similar size and on similar routes, whether under the same management/ownership or different.
Given that most liner operators already have dedicated teams focusing on vessel routing for efficiency and scheduling purposes, expanding their focus to include the aforementioned aspects could enhance safety.
Links :
- Maritime Executive : Industry Launching Study into Containers Lost Overboard
- GeoGarage blog : Shipping containers overboard / Ship loses more than 500 containers in heavy seas / The secret life of a container lost at sea


No comments:
Post a Comment