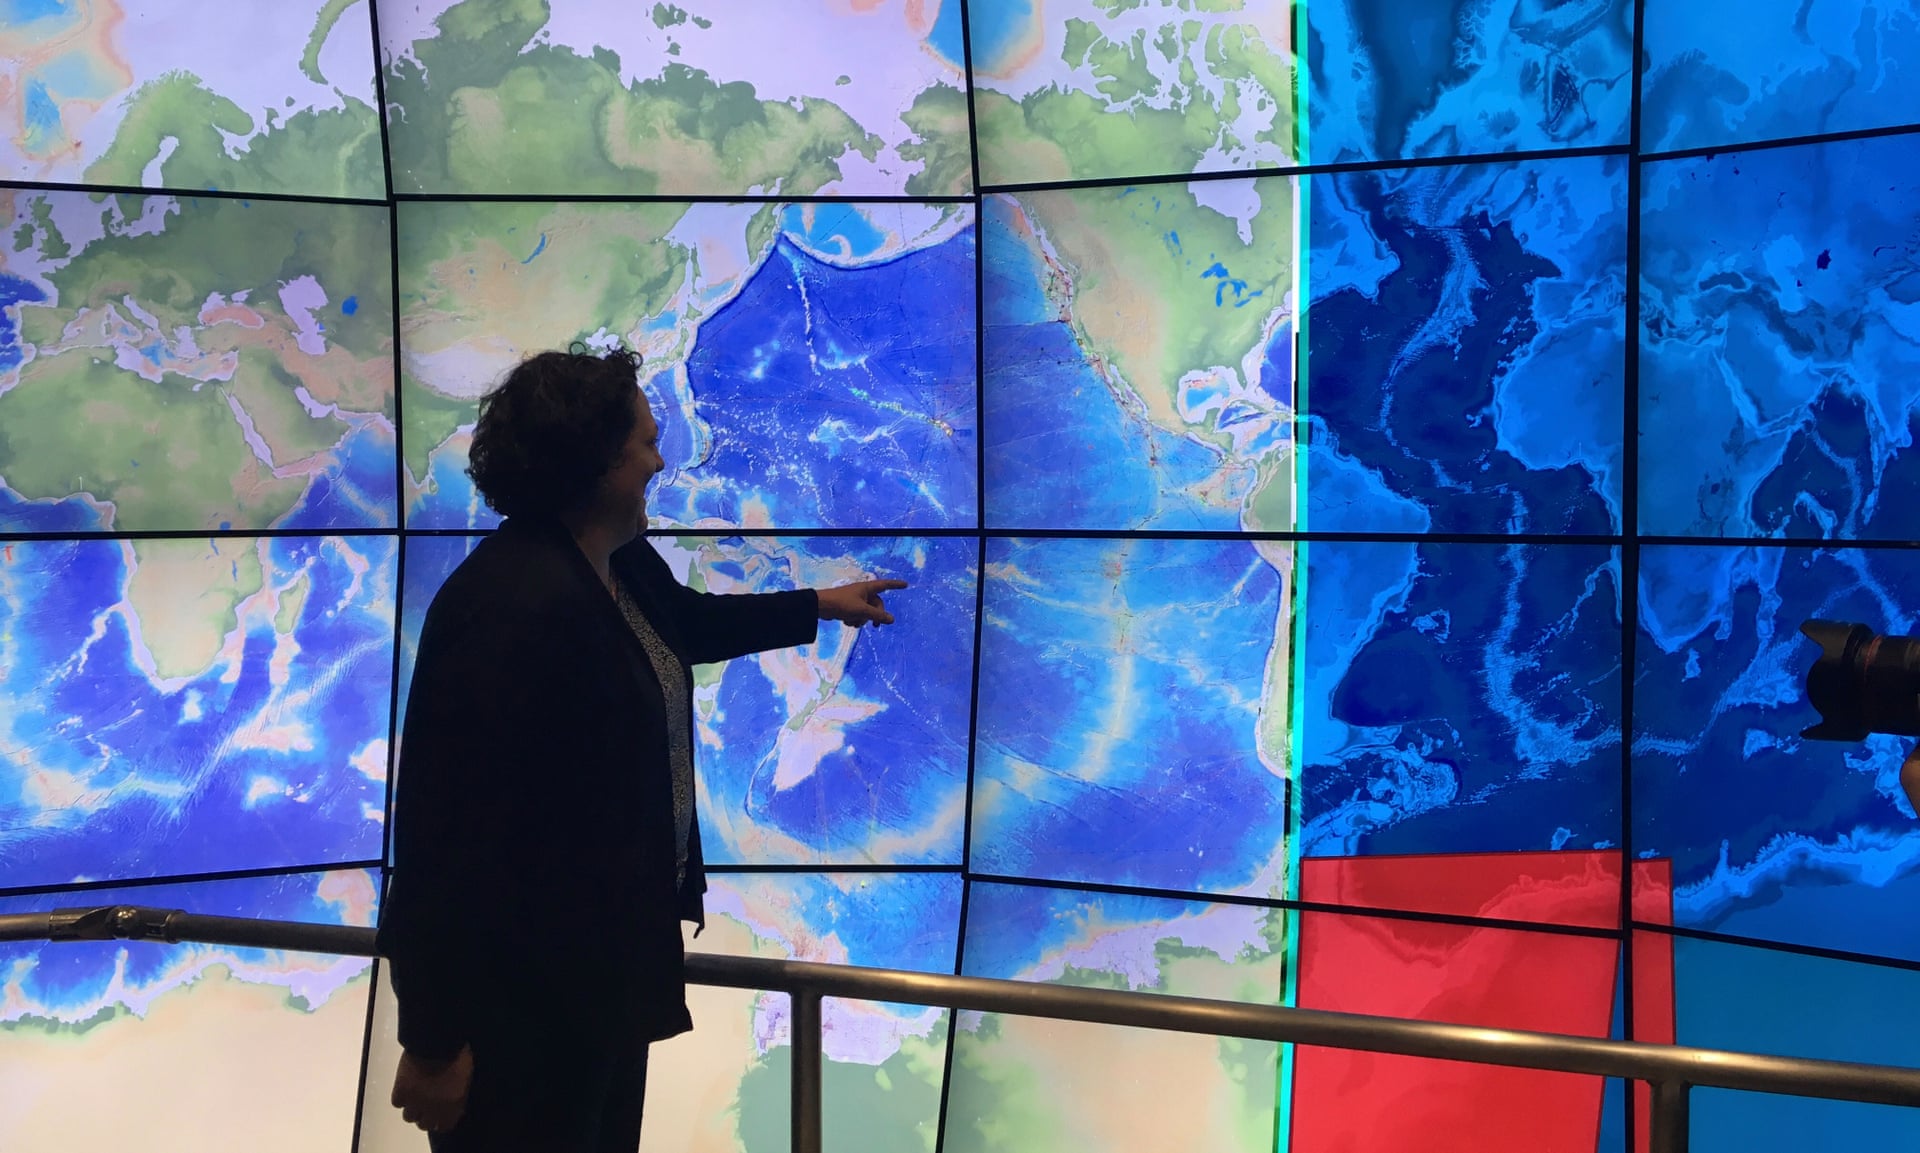
Vicki Ferrini at the Lamont-Doherty Earth Observatory, where she works as a geoinformatics researcher.
Photograph: Vicki Ferrini
Photograph: Vicki Ferrini
From The Guardian by Laura Trethewey
An ambitious project to chart the seabed by 2030 could help countries prepare for tsunamis, protect marine habitats and monitor deep-sea mining.
But the challenge is unprecedented
On a wall facing Vicki Ferrini’s desk hangs a giant map of the Atlantic and Indian Oceans.
At 6ft by 8ft, it’s the largest size available on the printer at the Lamont-Doherty Earth Observatory, where she works as a geoinformatics researcher.
“I of course want it even bigger,” she says.
The map is busier than a usual world map.
Rather than showing featureless, flat blue ocean, here the seafloor bursts with detail: mountains, canyons, channels and plains that resemble the texture of land.
Ferrini encourages her staff to print pictures of the seafloor features they’re researching and tack them to the map.
One example off the coast of Argentina shows ripples in the seafloor reaching a hundred metres high.
The map has a distinctly Sherlock Holmes-about-to-break-a-big-case look to it.
“I’m trying to see the scale of the ocean,” she explains.
“The big picture – but also the fine details.”
Mapping requires an ability to see the forest as well as the trees – or in this case, the coral as well as the sea.
It’s a particular challenge when it comes to the ocean, the vast majority of which is not just unmapped, but unknown.
Ferrini’s map is humanity’s best effort to date: a crucial document in what has become a race to map the entire seafloor by the end of the decade.
The race officially kicked off in 2017 at the United Nations Ocean Conference in New York City.
When it began, around 6% of the ocean was mapped in accurate detail.
On 21 June, the global initiative – known formally as the Nippon Foundation-Gebco Seabed 2030 Project – released its latest edition: it has now mapped one-fifth of the seafloor.
The stakes are high.
A series of reports have warned of the ocean’s impending collapse.
The First World Ocean Assessment, published by the UN Environment Programme in 2015, revealed that the ocean’s very ability to function was in jeopardy.
The following year, an OECD report estimated that the ocean economy employed 31 million people full-time and generated $1.5 trillion each year.
Maps – or the lack thereof – play a role in nearly every critical ocean issue, from sea level rise to ocean acidification to biodiversity.
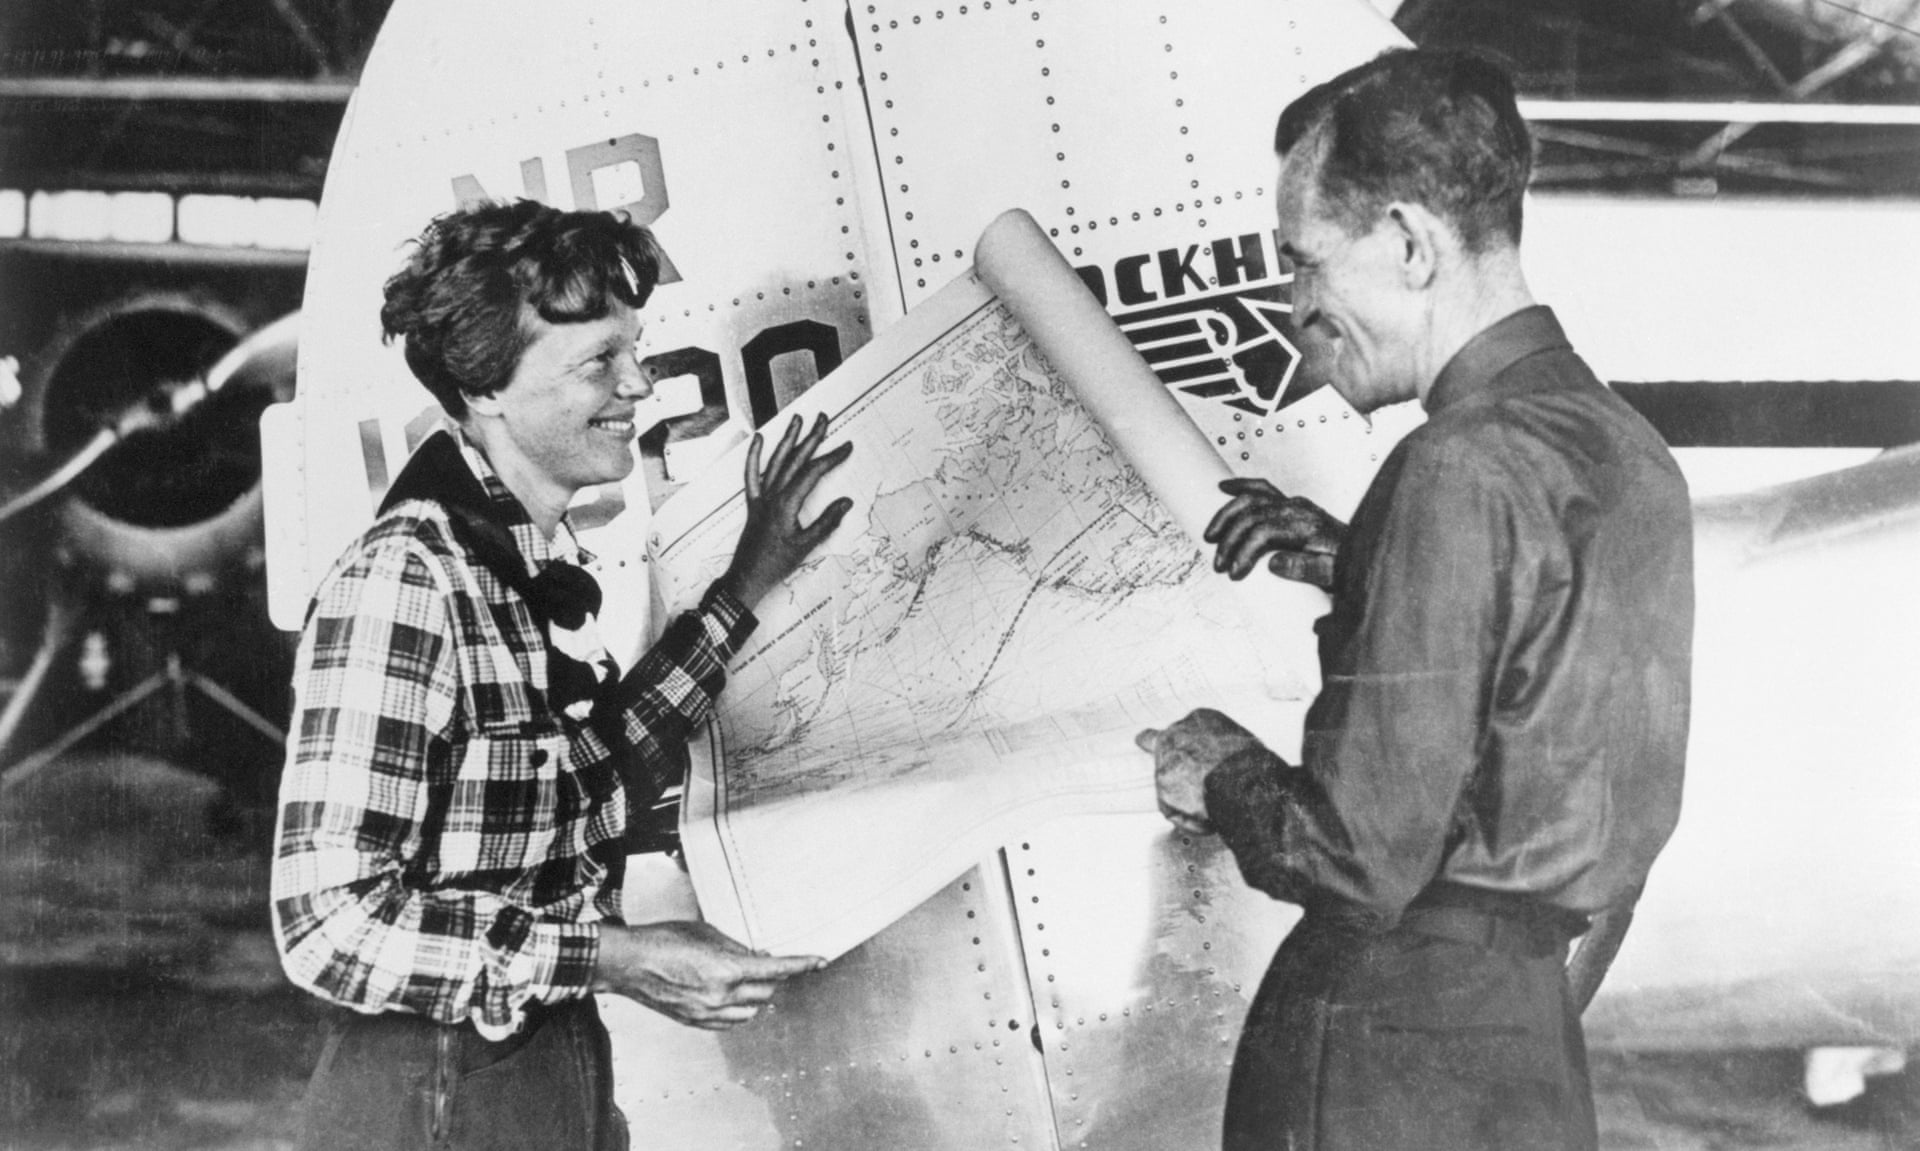
The pilot Amelia Earhart and her navigator, Fred Noonan, with a map of the Pacific that shows the route of their last flight in 1937.
The quest to find her plane has led to attempts to map the seabed.
Photograph: Bettmann/Bettmann Archive
The quest to find her plane has led to attempts to map the seabed.
Photograph: Bettmann/Bettmann Archive
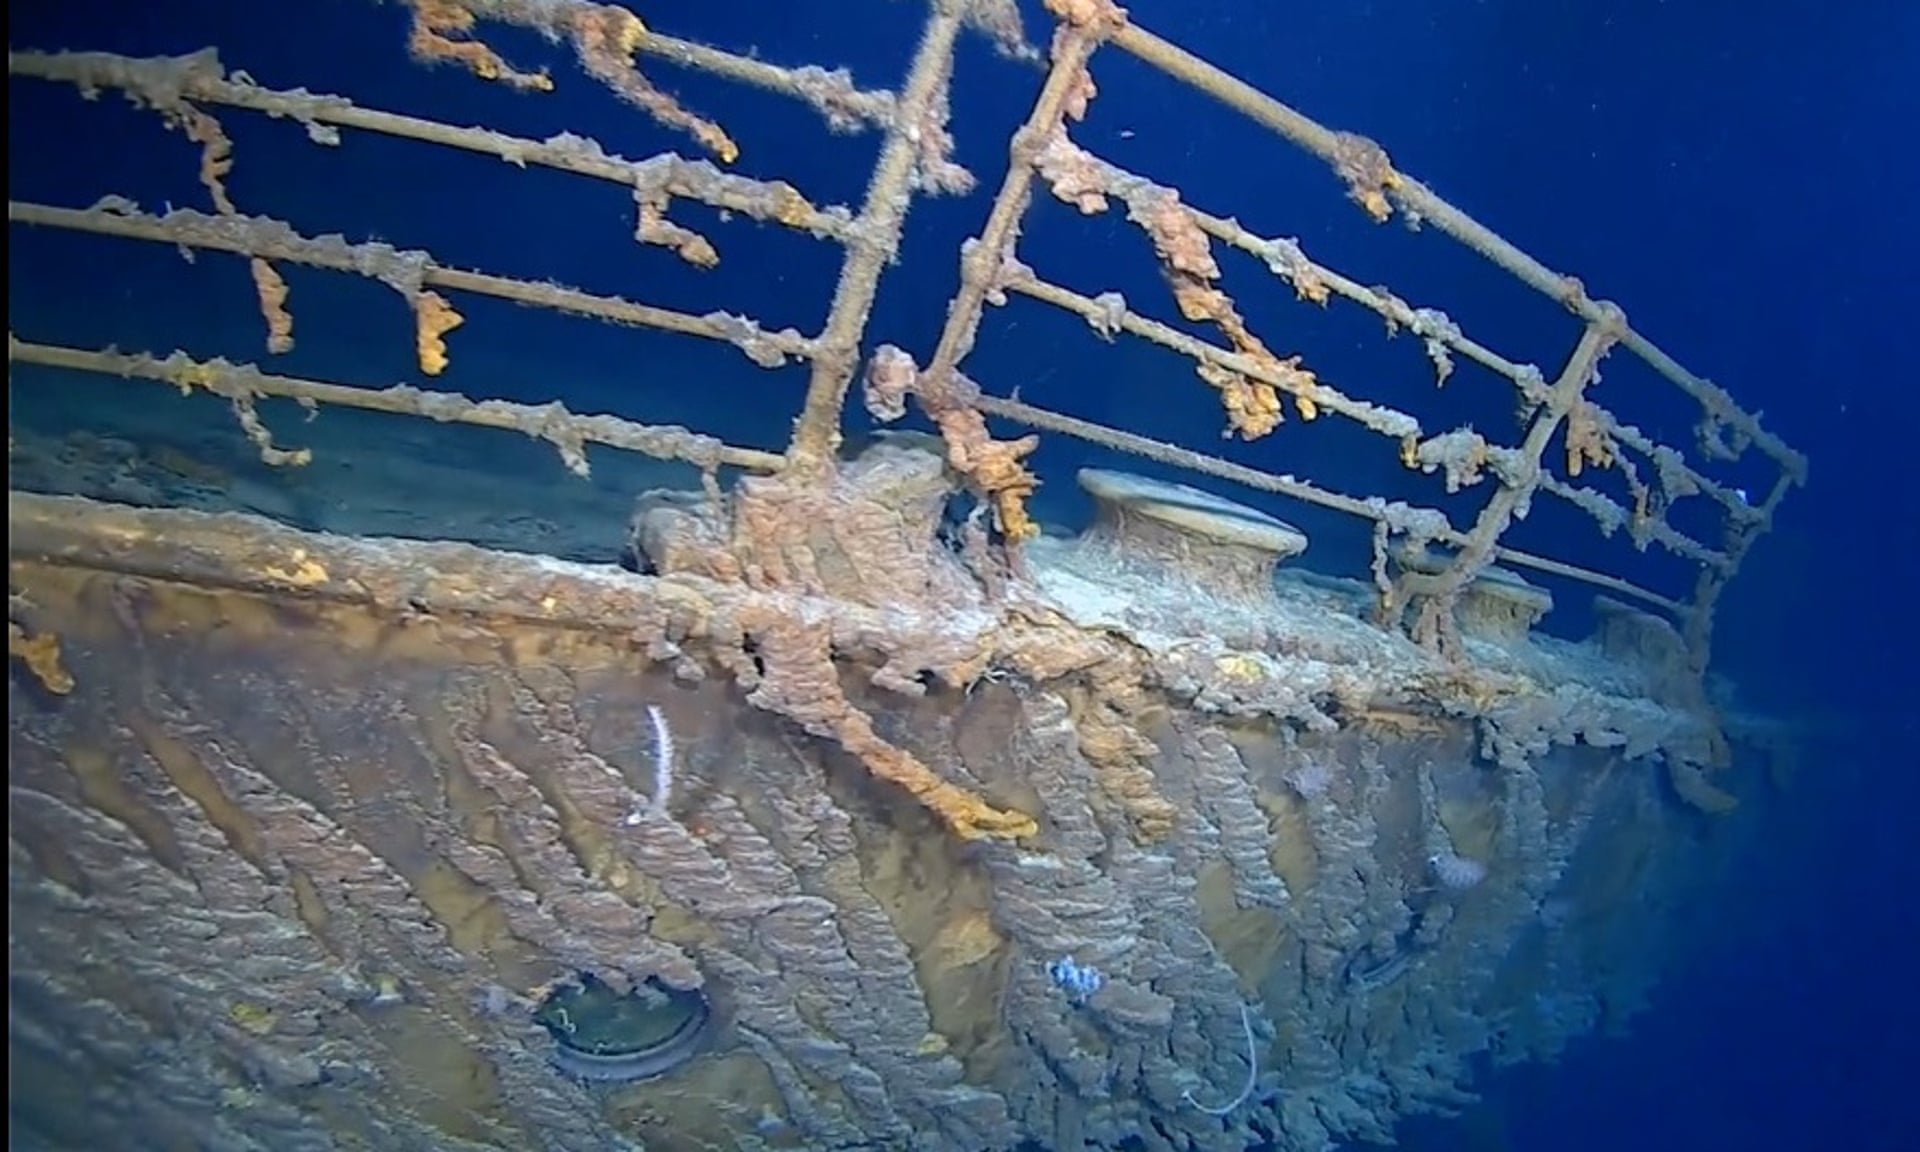
During the 20th century there were brief bursts of enthusiasm for mapping the sea, including the search for Amelia Earhart’s lost plane, a Lockheed Electra, and the hunt for the wreck of the Titanic.
In 2014, the disappearance of Malaysia Airlines MH370 seemed to baffle us: how was it possible that with all our modern technology, something as huge as an entire plane could simply disappear?
It’s often said that humanity knows more about the surface of the moon than we do the seafloor.
It seems astounding that faraway planets can be more accessible than our own.
But we tend to skip over why it is so difficult to map the seafloor: there is a massive obstacle in the way called the ocean.
Light travels far and fast in space, but the laser altimeters that we use to chart celestial bodies are ineffective in water – the lasers are simply absorbed.
Sound, on the other hand, travels more efficiently underwater than it does in air.
The gold standard for seafloor mapping today is a multi-beam echosounder, which can be attached directly on to the hull of a ship.
The device sends down a fan of sound waves, which computers decipher into a three-dimensional portrait of the seafloor’s shape and composition.
Additional techniques also collect water temperature and salinity along the way.
It is slow work.
Ferrini recently sent another version of the map, this one blacking out all the uncharted ocean today.
The coastlines were lit up with data.
So, too, were well-traversed shipping lanes.
The rest sat in darkness, except for a few pinpricks of light.
New images of the side of the RMS Titanic in her resting place at the bottom of the North Atlantic Ocean, taken during a survey of the wreckage from a manned submersible on an expedition in August 2019.
Photograph: Atlantic Productions
Photograph: Atlantic Productions
Few countries need accurate maps of the seabed more than Japan, an island nation whose future is uniquely intertwined with the ocean’s, and it is the Nippon Foundation , a Japanese non-profit organisation run on the gambling proceeds of motorboat racing, that is backing Seabed 2030 with $2m every year.
In the past, the foundation has addressed thorny global challenges such as eliminating leprosy or fighting food insecurity, and a complete seafloor map fits within its mandate, as well as Japan’s wider national interests.
Seabed 2030 would improve Japan’s fisheries management and its tsunami and typhoon preparation, as well as clarify territorial claims in the South China Sea.
But the mapping is a truly global collaboration, public and free to use, divided among four regional centres.
The Alfred Wegener Institute in Germany took the Southern Ocean; Stockholm University and the University of New Hampshire cover the North Pacific and Arctic; New Zealand’s National Institute of Water and Atmospheric Research are responsible for the South and West Pacific Ocean.
That leaves the largest swath, the entire Atlantic and Indian Oceans, to the Lamont-Doherty Earth Observatory at Columbia University – Ferrini’s team.
The finished map itself is created by a fifth centre, based in the UK: the British Oceanographic Data Centre in Southampton.
It collects the analysed data from the four centres and compiles it in the General Bathymetric Chart of the Oceans (Gebco).
The data is in the public domain, free to use, adapt and commercially exploit.
“Pretty much anybody doing some kind of [ocean] research should probably be using or has used the Gebco data,” says Rochelle Wigley, the project’s director at the University of New Hampshire.
“A lot of fibre optic cable companies have used it, people interested in tsunamis and storm surge, people looking to characterise habitat or modelling ocean currents.”
It is making remarkable new discoveries all the time.
Off Florida, a reef of mid-ocean corals turned up; in the Gulf of Mexico, a shipwreck.
A forthcoming study on ice sheets will use Gebco to unpack how the ocean influences melting and raises sea levels.
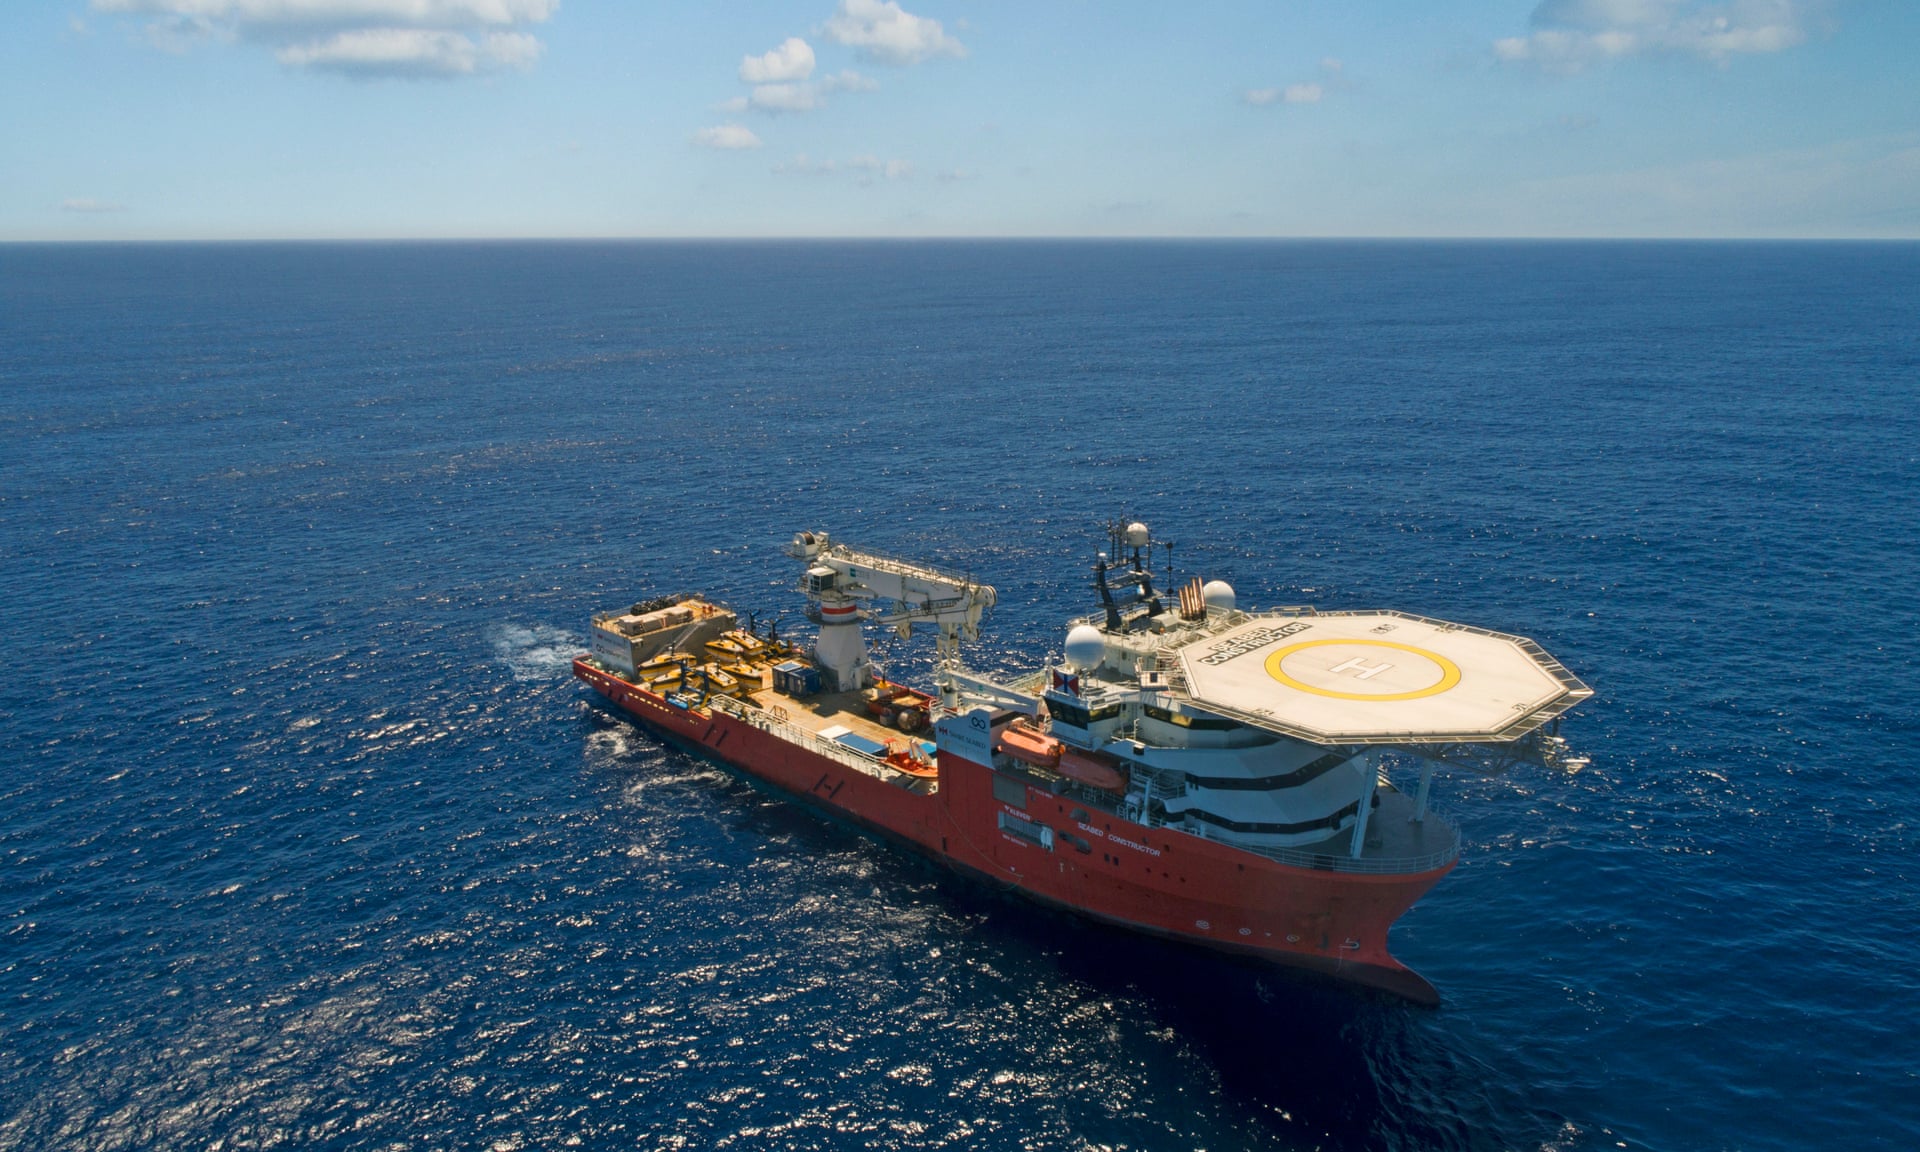
The ‘Seabed Constructor’ in the southern Indian Ocean off the coast of South Africa, on 4 January 2018.
The ship and its unmanned submarines has been scouring the ocean floor for wreckage from flight MH370.
Photograph: Ocean Infinity Handout/EPA
The ship and its unmanned submarines has been scouring the ocean floor for wreckage from flight MH370.
Photograph: Ocean Infinity Handout/EPA
Deep-sea mining – a controversial plan to excavate huge areas of underwater resources, in what would be the largest mining operation the Earth has ever seen – requires maps, too.
The UN’s International Seabed Authority (ISA) has given permission to several state-owned and private companies to prospect in the deep sea; permission to start mining could come as soon as this year.
In many cases, however, the deep-sea miners are way ahead of the Gebco mappers.
Luc Cuyvers, lead author of the IUCN’s 2018 report on seabed mining, says mining companies are looking for specific things – hard evidence of minerals, either visual or actual samples.
“From an industry perspective, they need more advanced data” than Gebco, he says.
“And [they] have, in many instances, already collected it.”
Where Gebco could be used in deep-sea mining, however, would be to help the ISA to better regulate the industry, he says – something of a double-edged sword, depending on your point of view.
Another potential controversy is whether mapping introduces more noise to an already noisy ocean.
Air guns, naval sonar and shipping traffic are increasingly edging out marine mammals that rely on sound to hunt, navigate and communicate.
New research from graduate student Hilary Kates Varghese at the University of New Hampshire revealed that the multi-beam echosounders used by Seabed 2030 did not disrupt the feeding behaviour of Cuvier’s beaked whale, one of the more sonically sensitive marine mammals.
However, research biologist Annamaria DeAngelis at the National Oceanic and Atmospheric Administration pointed out that because Seabed 2030 is mapping the entire ocean, “more studies will be needed to expand our knowledge of how their particular echosounders will affect marine mammals in a variety of habitats.”
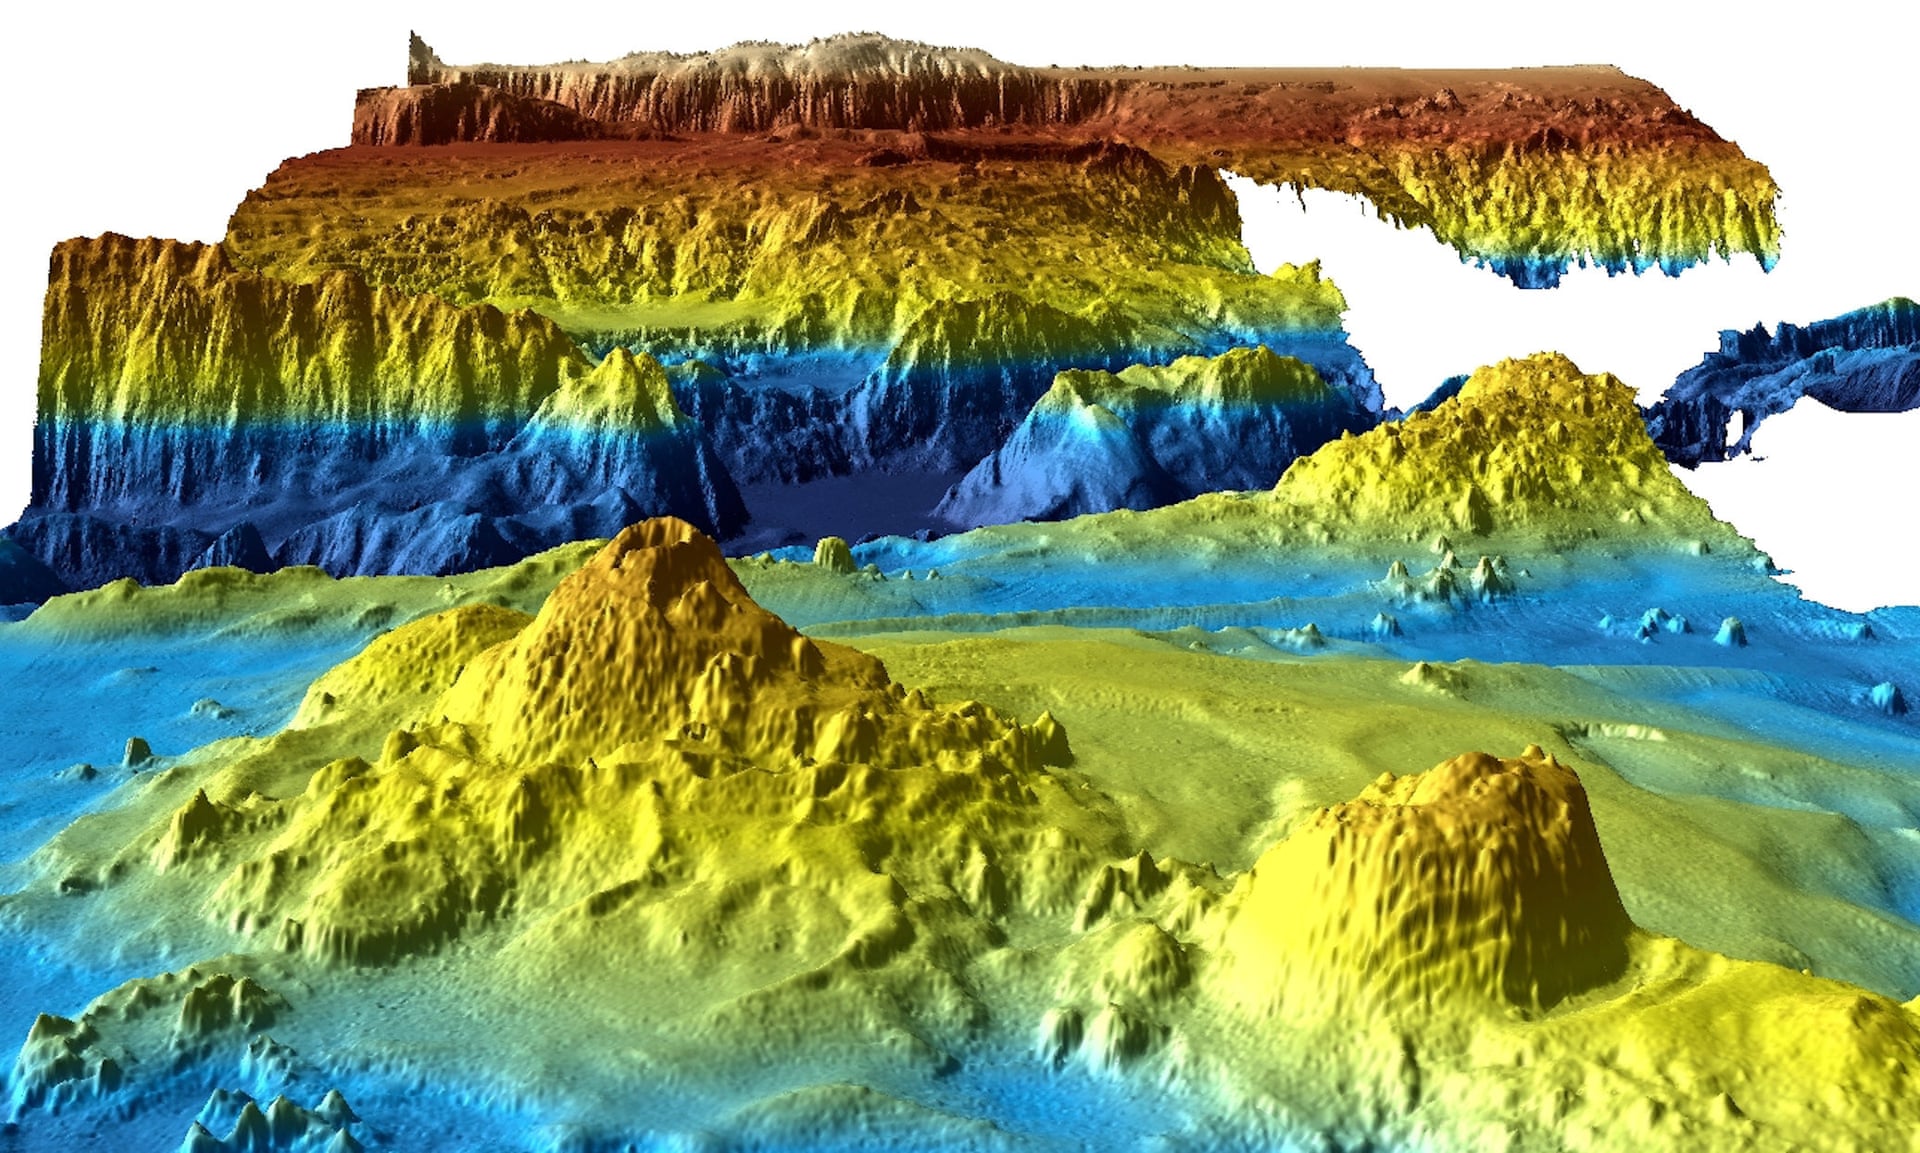
An undated supplied image from Geoscience Australia shows a computer generated three-dimensional view of the sea floor.
Photograph: Reuters
Photograph: Reuters
One way to reduce noise is to crowdsource from ships that are already charting the ocean.
When the multimillionaire Victor Vescovo went on a mission to reach the deepest point of all five oceans, Seabed 2030 mappers collected soundings along the journey.
Other industry partners are donating whatever data they can.
Crowdsourcing is crucial – from cruise ships, hydrographic offices, even weekend boaters with a decent sounder.
By itself, a single ship would need 200 years to map the rest of the uncharted seas.
However, “sharing data is a little taboo”, says Tinah Voahangy Martin, a member of Ferrini’s staff who often approaches institutions located on the Indian Ocean to ask for seafloor information.
Seafloor data is often considered proprietary, classified or simply too valuable to give away.
“You don’t want to be the person who comes in and says ‘Hi, you do this and we expect this.’ You take them on as a partner.
That’s the best way to get them involved.”
Ferrini adds that, because science in the US is often taxpayer-funded, it creates the expectation that data will always be freely available.
“We have to remind ourselves that the whole world doesn’t work that way, and figure out how we can make it mutually beneficial.”
Nevertheless, at their rate of progress, the finish line of 2030 seems possible.
But completing the map on Ferrini’s wall is just the beginning.
“There’s still so much more for us to do and know than the shape of the seafloor,” she says.
“This is just one piece of a much bigger picture.”
Links :
- GreenBiz : Mapping the deep: A new age of exploration
- GeoGarage blog : One-fifth of Earth's ocean floor is now mapped
No comments:
Post a Comment