Marine GeoGarage is a new website that definitively replaces our previous website :
http://demo.geogarage.com/noaaSome users of this website are a little lost moving to the new one because they don't find the NOAA layer directly when the new Marine GeoGarage link is launched.
So to avoid drowning or calling 911, here is the procedure to display the nautical charts :
So to avoid drowning or calling 911, here is the procedure to display the nautical charts :
- Marine GeoGarage will always allow you to look at the NOAA charts but among other charts coming from other Hydrographic Services. It will open in a new window that you can then maximize to get the best view. Also, if you sign up with the site (free), then you will be able to save waypoints and routes.
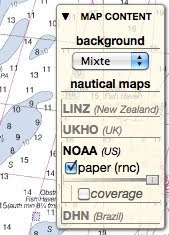
- When you open the site, if you first see a satellite view, then zoom into your favorite area by clicking on the place several times and then click on the “Map Content” box in the upper right hand corner of the chart to drop down the menu. Click on the NOAA box and check the “paper” box. The satellite view will be replaced by the NOAA Chart covering the area. Under the “paper” box, there is a slider. By moving that slider to the left, the background map will start to show through. The background map you see depends of the little drop down box under “background” at the top of the “Map Content” box. “Hybrid” is a good choice. Click on “Map Content” again to close the box. It is interesting to compare the shoal areas on the chart with the view in the satellite view.
- In the lower left-hand corner of the chart, you will see a Lat/lon box giving the lat/lon of the mouse cursor.
- In the upper-left hand corner of the chart you will find the typical navigational tools of a Google Map. You can zoom in and out and move in four directions. You can also zoom with the thumbwheel of your mouse.
- To the right of the navigational tools, there is a tool box. The “hand” lets you move the map around, the “flag” lets you set a waypoint and the “lines and boxes” lets you make a route. Just click on the one you want.
- In the lower right-hand corner, there is a small map. If you grap the shaded box in the middle by clicking and holding your cursor, the can move the box all around the chart quickly.
- Once you play around with the site, it becomes very easy to use.
 Thanks to Henry Moore for this explanation
No comments:
Post a Comment