 A set of resources made available from different organizations that enables users to see the latest maps, web services, and applications devoted to monitoring and tracking the Gulf of Mexico oil spill.
- BP response / Map
- ESRI proposes several web services containing datasets that are of interest to responders of the Gulf of Mexico BP Oil spill : GeoViewer / ArcGis_online / Gulf Oil Spill Map / Economic Impact
- NGA Earth Oil Spill Map
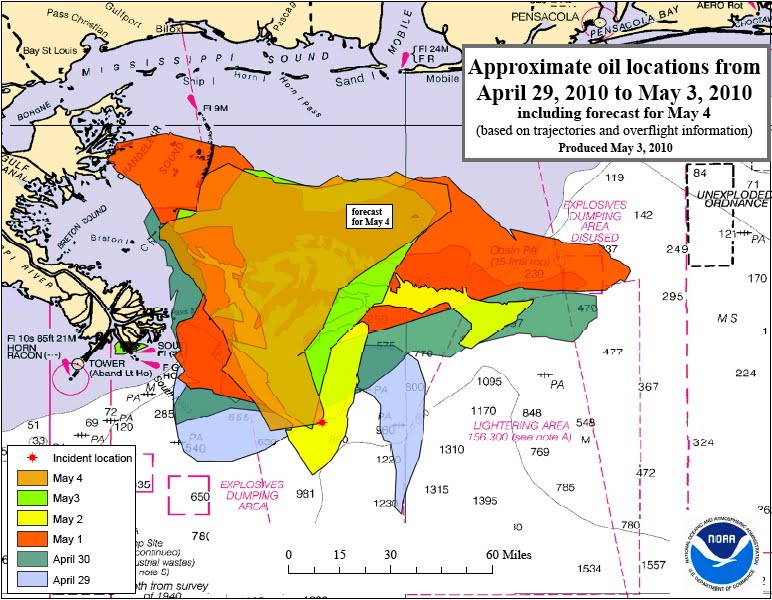
- NOAA Office of Response and Restoration : day to day trajectory forecast
- The original environmental sensitivity index (ESI) mapping concept for oil spills was developed to assist spill-response coordinators in evaluating the potential impact of oil along a shoreline and the allocation of resources during and after a spill.
- Marine GeoGarage : specific NOAA raster nautical map RNC11360.kmz (12Mb) with spill projection for Google Earth
- Google crisis answer
- Microsoft Bing Maps
- Louisiana Bucket Brigade : provide data about the impacts of the spill in real time as well as document the story of those that witness it
- Grassroots Mapping a community participatory mapping initiative from the MIT Media Lab to utilize their balloon-based camera system to acquire imagery and map the Gulf oil spill along the Louisiana coast
- How big is the oil spill (Paul Rademacher)
- New York Times : map of the oil spill spread
- State of Louisiana
- Washington Post TimeSpace
- EPA BP Oil Spill : in addition to monitoring air quality, EPA is assessing the coastal waters affected by the spreading oil (kmz file)
- NASA Satellite imagery keeping eye on the Gulf Oil Spill
- Envisat & Meris, ESA monitoring changes in oil spill trajectory
- Spot5 image
- ZKI maps from German Aerospace Center (DLR) illustrate the extent of the oil spill in the Gulf of Mexico at several times as well as its evolution based on the TerraSAR-X data.
- Weather and currents forecasts : WAVCIS / NOAA Hycom model
- Gulf of Mexico Oil Rigs: 1942-2005
- Ocean Circulation Group : The Deepwater Horizon oil spill trajectory ensemble forecast from different numerical models
- NOAA ERMA (GeoPlatform) : Mapping the response to BP oil spill in the Gulf of Mexico
- Map the Spill : mobile app and website built by Trimble
- Nola : 2010 Gulf of Mewico oil spill
- WAVCIS : Wave-current-surge information system for coastal Louisiana
-> Directory of other ressources on GISUser.com
 A set of resources made available from different organizations that enables users to see the latest maps, web services, and applications devoted to monitoring and tracking the Gulf of Mexico oil spill.
NSF Awards “Human Sensor Web” Project for the Gulf Oil Spill
ReplyDelete