 Figure
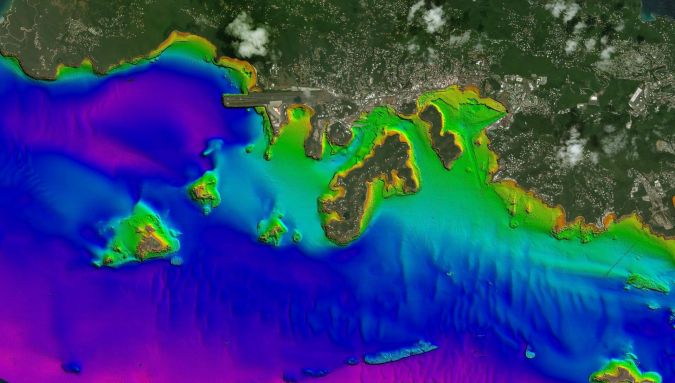
4: Coastal bathymetry, St.
Figure
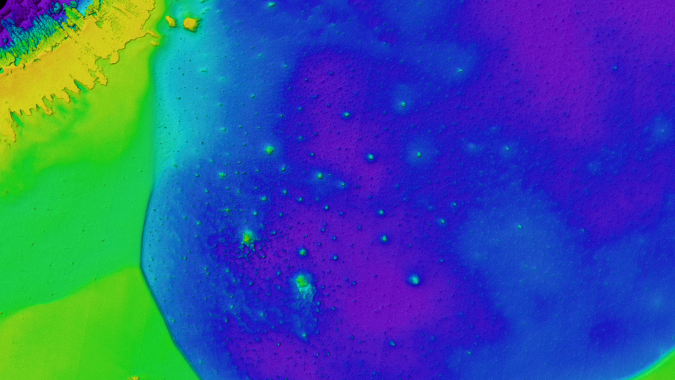
4: Coastal bathymetry, St.Land areas are depicted with satellite imagery.
(Source: USGS)

Visualization with the GeoGarage platform (NOAA raster chart)
From Hydro by Italo Oliveira Ferreira, Laura Coelho de Andrade
Since the 1970s, remote sensing has increasingly been used to conduct underwater surveys.
Several methodologies are employed in hydrographic surveying, from direct techniques such as probing rods to more sophisticated techniques such as satellite-derived bathymetry and altimetric radar.
The growing need for data that is increasingly accurate and available with a quick turnaround has recently led to a worldwide effort to develop sensors and alternative techniques for measuring depth.
Bathymetric survey platforms include surface vessels, submersible platforms, aircraft and satellites (see Figure 1).
Vessels range from large ships, used in offshore surveys, to uncrewed vessels, either remotely controlled or autonomous.
The most commonly used submersible platforms are autonomous underwater vehicles (AUVs) and remotely operated vehicles (ROVs), both of which are used for high-resolution mapping in deep water and can be controlled from a surface vessel.
Acoustic sensors are preferred on these platforms, although AUVs and ROVs now also carry light detection and ranging (Lidar) systems and high-resolution photographic cameras.
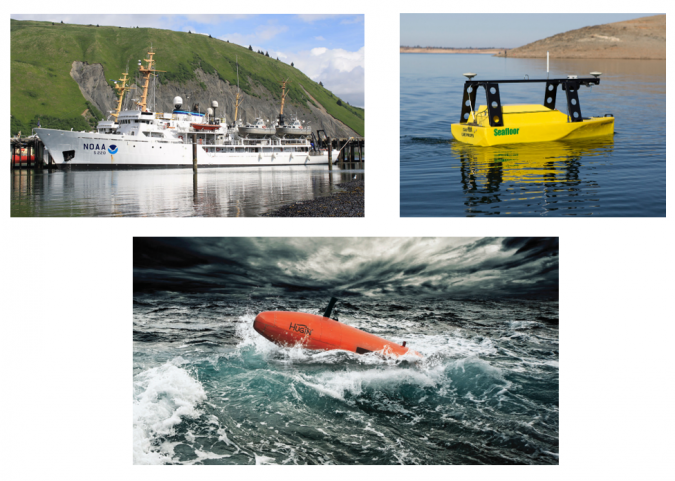 Figure 1: Platforms used in hydrographic surveys: (a) NOAA Ship Fairweather for offshore surveys, (b) EchoBoat-ASV from Seafloor Systems, (c) Hugin AUV from Kongsberg.
The Ship Fairweather of the National Oceanic and Atmospheric Administration (NOAA) is mainly used in offshore hydrographic surveys and port surveys and is equipped with a Reson Seabat 8160 echosounder, which surveys depths of up to three kilometres.
EchoBoat is a small autonomous surface vehicle (ASV) used in bathymetric surveys of inland waters and sheltered areas that are performed using acoustic sensors.
The Hugin AUV from Kongsberg has, in addition to the EM2040 multibeam echosounder, a laser profiler, a coupled photographic camera and a HISAS 1032 synthetic aperture sonar, among other systems and sensors.
Crewed and uncrewed aircraft are also used in bathymetric mapping.
These platforms are equipped with passive sensors, which allow depth estimates to be made through the spectral response of the submerged bottom, and active sensors, such as bathymetric Lidar.
Similarly, satellites also function as bathymetric survey platforms, either through the use of orbital images (bathymetry by spectral response) or through the use of altimetric radars (active sensors), as in the Seabed 2030 project.
There are also hybrid solutions that enable the acquisition of bathymetry using an echosounder towed by a low-flying unmanned aerial vehicle (UAV; Figure 2) or an integrated ground penetrating radar (GPR).
Unmanned surface vehicle (USV)-based platforms are also increasingly used.
Bathymetric Survey Methods
Modern bathymetric surveys are carried out in various media, depending on the method used.
Sound waves are used in the aquatic environment, visible light is used in the air and in the aquatic environment, and bathymetry derived from information from altimetric radars is used in the air.
Acoustic systems are used both in shallow water of around one metre deep and in deep water of many kilometres of depth.
Such systems are preferred as they provide more accurate data than other methods.
The high attenuation of visible light in the aquatic environment means that depth measurement by optical remote sensing (active and passive) is limited to shallow depths.
While aerophotogrammetric (short distance) and orbital images are employed for bathymetry at depths of up to ten metres, Lidar systems operating in the green wavelength can reach up to 50 metres in clear waters.
Finally, altimetric radars can be used to obtain depths in deep waters, especially where bathymetric information is scarce or non-existent.
Acoustic Sensors
The first record of the use of an echosounder, or sonar as it is popularly called, is when Leonardo da Vinci placed a tube in water to detect big ships, by positioning his ear in the tube.
There are both passive and active sonar systems, but active sonar is used in depth measurement.
Between 1920 and 1930, the world saw the development and implementation of single beam echosounders (SBESs), which use sound to measure the depth directly below the sounding platform.
By running a series of lines at a specified spacing, SBES greatly increased the speed of the survey process, allowing more data to be collected compared to direct methods.
However, this method still left gaps in quantitative depth information between the survey lines.
Between the 1950s and the 1980s, technological developments resulted in the emergence of sidescan sonars (SSSs) and multibeam echosounder (MBES) systems (beam-formers).
Lateral scanning sonar technology offered a qualitative means of obtaining the sonic equivalent of an aerial photograph and improved the ability to identify submerged shipwrecks and obstructions.
This proved to be an excellent aid for SBES surveys, since it enabled the search for submerged objects between the navigated lines.
Beam-forming MBES made it possible to obtain quantitative depth information for almost 100% of the submerged bottom.
SBES is ideal for shallow water surveys and is very cost-effective.
The planning, operation, processing and analysis are simple, and there is a huge range of equipment operating at low frequencies (12kHz–50kHz), high frequencies (100kHz–700kHz) and even dual frequencies (24kHz/200kHz, 33kHz/200kHz, 50kHz/200kHz, etc.).
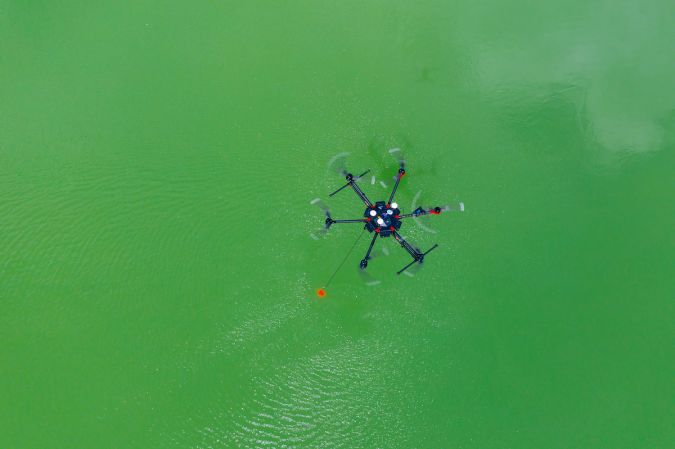 Figure 2: Integrated system for bathymetry using an echosounder in a UAV.
MBES traditionally obtains depth measurements through the process of electronic beam-forming (Demoustier, 1996).
Alternatively, some equipment employs interferometry to measure depth.
Such systems are popularly known as interferometric sonar, interferometric multibeam, interferometric sidescan, bathymetric sidescan or phase-differencing bathymetric sonar (PDBS).
The latter term is theoretically the most correct, since only the first systems actually employed the process of interferometry.
There are several advantages to using PDBS, the main one being the background coverage, which in some cases is up to 12 times the nadir depth.
This means that, at 4m depth, PDBS should be able to cover a range close to 50m, while a standard multibeam (120° swath) would cover about 12–16 metres at this depth.
PDBS technology has in fact existed for many decades, but several operational and technical problems were only recently solved.
It can be concluded that the main advantage of this type of system is the wider sweeps, which result in a significant increase in productivity in shallow water.
A problem still to be resolved is the theoretical uncertainty model (a priori) of the PDBS.
Improvements in synthetic aperture sonar have also take place in the last few years.
Kongsberg recently launched HISAS 1032, a system capable of generating approximately 1,000 metres swath at 2.5 knots and images with a resolution of 5cm.
For bathymetry, HISAS 1032 demonstrated a significant improvement over its previous version in which a resolution of 50cm was obtained, now producing a resolution of 20cm.
The system is able to generate coverage of approximately 4.5 km2/h, which is also high compared to previous versions.
Finally, in all cases, the primary disadvantage of surveys with acoustic systems lies in the high costs associated with vessels and their crew.
In shallow waters, a higher level of detail is always required, which is reflected in a higher number of survey lines.
In deep water, on the other hand, the problem is the high costs due to the large ships and their crew.
Even when using autonomous vehicles, vessels are needed to control the uncrewed platform and provide acoustic positioning when using AUVs.
Air- and Spaceborne Remote Sensing
Despite the high attenuation suffered by electromagnetic waves in water, the visible portion of the spectrum can be employed in bathymetric mapping, especially where acoustic methods have limitations.
In this context, depths can be measured either employing passive methods, which measure only the natural light reflected from the submerged bottom (spectral response bathymetry), or active methods, which use lasers to measure the distance to the seabed.
The great advantage of these methods lies in the productivity that can be achieved (Figure 3).
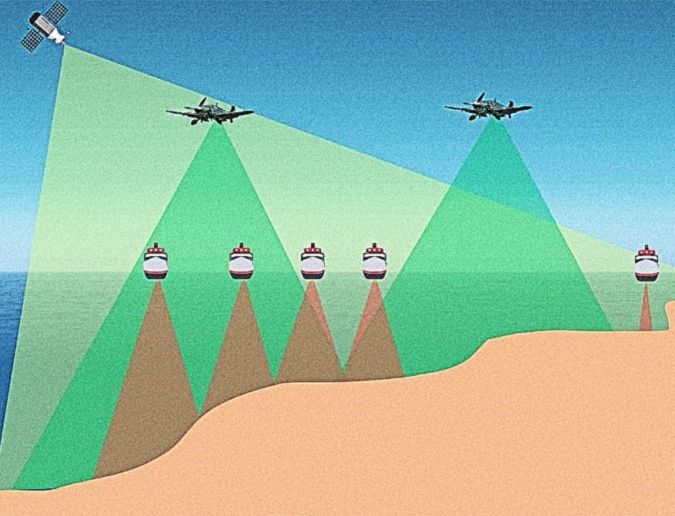 Figure 3: Different methodologies for extraction of bathymetry, exemplifying the high productivity of optical remote sensing.
Spectral Response Bathymetry
The method using sensors embedded in crewed or uncrewed aircrafts or satellites is based on the principle that part of the sunlight that reaches the submerged bottom is reflected and can be detected by these sensors, which use this radiation to measure depth and obtain bathymetric maps.
The principle of using orbital and aerial images for bathymetric mapping is not the same as that adopted by active sensors.
Satellite-derived bathymetry is based on three techniques: empirical approaches, empirically tuned physics-based approaches and optimization-tuned physics inversion approaches.
Empirically tuned physics-based approaches follow the principle that the intensity of the radiant energy that is reflected by a water column and received by the sensor is a function of the water depth; that is, the portion of solar radiation that penetrated the water column.
In most cases, the Normalized Difference Water Index (NDWI) is used.
The empirical approaches are the newest method (machine learning techniques) and not widely used.
In the optimization-tuned physics inversion approaches, the application of the model requires the specification of a range of optical properties of the water and the seafloor, but no in situ data is needed for calibration.
Spectral response bathymetry makes it possible to quickly collect data over large areas at a low cost, but the maximum depth is approximately 30 metres in clear waters and much less in turbid waters.
In addition, the information is obtained at accuracies that are incompatible with current requirements, restricting its use for planning, recognition and environmental modelling purposes.
Aerophotogrammetric and orbital images are therefore mainly used as a recognition and planning tool in areas where bathymetric information is non-existent or insufficient.
However, images from orbital and airborne sensors are very useful for the delineation of coastlines and the mapping of port structures and as a navigation aid.
Lidar
Bathymetric Lidar is the most productive method for bathymetric mapping in shallow water (< 50m), as it usually surveys at 180 knots and the covered range is higher than most modern MBES and PDBS.
Similar to acoustic systems, Lidar measures depth indirectly using the travel time of a laser pulse.
These systems were first introduced in the mid-1960s, originally as a tool for topographic mapping.
During flights over lakes and coastal regions, the researchers noticed a double return, from which they concluded that the laser penetrated the water and could be used to map the bathymetry.
 Bathymetric Lidar is one of the solutions to address governments' coastal, riverine and shallow-water geospatial and hydrographic needs.
The basic working principle is the emission of two laser pulses, the first in the infrared wavelength (~1064nm), which allows the detection of the surface since penetration into the water is effectively zero, and the second in the green-blue wavelength (~532nm), which – despite a high level of dispersion – can reach the submerged bottom.
As with an echosounder, a time series of light intensity (instead of acoustic intensity) is recorded.
The typical scan interval is 1ns (10-9 seconds), as opposed to ~1ms to 10µs (10-3 to 10-5 seconds) for acoustic signals.
The echo envelope, or waveform, is then used to estimate the depth.
The penetration is generally three times the depth observed with the Secchi disc and is determined in situ.
Another method, which is technically more effective, would be to determine the attenuation coefficient for the wavelength used, which describes the exponential decay of light with depth.
More modern systems are able to obtain a vertical and horizontal accuracy of about 20cm, with a spacing of 1m.
Altimetric Radar
In the 1970s, the main purpose of radar altimetry was to measure the ocean’s surface that most closely approximates to the geoid.
Thus, over the years, several altimetric missions were carried out to meet demands in the areas of geodesy, oceanography and continental hydrology.
Examples of this were the Geosat missions in 1985 and ERS-1 in 1991, which obtained as results good-quality surface models of ocean topography.
It is known that there are small depressions on the surface of the ocean that mimic the topography below water.
This is due to the extra gravitational pull of seabed features such as seamounts, producing variations in gravity which in turn produce small variations in the height of the ocean surface.
These depressions can be mapped by an altimetric radar mounted on a satellite.
In deep ocean basins, where sediments are thin and the morphology simple, altimetric radar data can even be used to predict current bathymetry.
On continental platforms (where sediments are thicker and conventional bathymetric surveys are in abundance), the gravimetric methodologies used to estimate depth are of limited value.
However, much bathymetric data has been obtained together with gravimetric information derived from satellites, allowing an optimal interpolation of the depths.
It is therefore evident that information derived from altimetric radars is not sufficiently accurate for verifying risks to navigation and also not functional in shallow water, where other techniques (such as Lidar) produce more reliable and better results.
In addition, the data obtained with radar alone is unable to provide the true depth and correlation with bathymetric data is necessary, as is performed in the methodology for measuring bathymetry through the spectral response.
Conclusions
Our knowledge of bathymetry has advanced rapidly over the last century, due to the rise of acoustics, optics and radar techniques.
Methodologies have been developed that are capable of providing a better quality control of the information acquired, together with the use of more robust and rigorous interpolators that have led to forms of representation of the seafloor in a more realistic way.
Despite such progress, there are still numerous technologies that can be studied and some issues to be resolved.
Further improvements should include motion sensors, positioning systems and speed sensors, lifting platforms and sophisticated software, including algorithms that dynamically compensate and allow narrower beam widths at short distances; in other words, with a higher spatial resolution.
Another trend is the use of point density with robust techniques for cleaning spurious data, as well as more accurate tide models and methods based on unsupervised machine learning.
Deep learning can also be used to predict and classify the seafloor with orbital images with more accuracy and speed and no reliance on in situ data, which will contribute to related areas, such as biological, climatological and sedimentological studies.
No comments:
Post a Comment