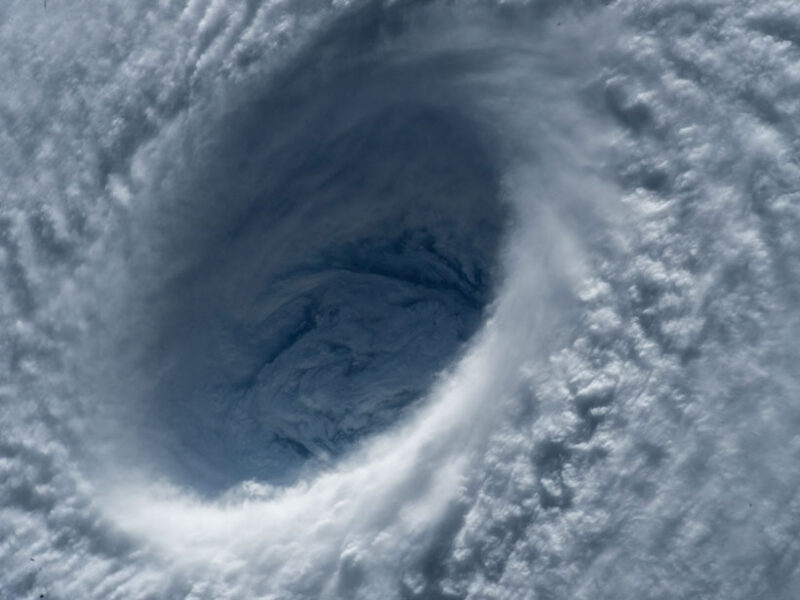
 Astronauts aboard the International Space Station provided this close-up
view of the eye of category 5 Typhoon Maysak in March 2015.
 Sampson
The pioneering use of satellite-based synthetic aperture radar to characterize tropical cyclones in near-real time has provided a crucial new tool with which to forecast powerful storms.
Hurricanes, typhoons, and cyclones are beautiful to behold from Earth orbit.
Most of us are familiar with satellite images of these intense storms, with their dark, near-circular eyes surrounded by spirals of whites and grays.
Here on Earth’s surface, however, they are among nature’s most destructive forces.
Cumulatively from 2000 to 2019, these storms accounted for about 30% of all global economic losses caused by natural hazards.Synthetic aperture radar (SAR) provides highly detailed views of wind speed at the ocean surface under the tropical cyclones as they travel and evolve.
Here we discuss how this new set of capabilities is already greatly improving storm characterization and forecasting.
Storms Above and Below the Clouds
Satellite observations of tropical cyclones now regularly include high-resolution visible and infrared imagery—with pixels representing areas less than 1 kilometer across—acquired from geosynchronous orbit, as well as images from moderate- to low-resolution (12- to 40-kilometer pixels) passive radiometers and active microwave scatterometers aboard satellites in polar orbit.
The radiometers measure microwaves, visible light, and infrared radiation reflected by or emitted from Earth, whereas the scatterometers transmit microwave pulses and measure the amount of energy returned via scattering from the planet’s surface.
These traditional satellite observations from visible, infrared, and microwave sources are indispensable to tropical cyclone forecasting, and they provide information about storm characteristics and the surrounding atmospheric and oceanic conditions driving them.
But they also all have limitations.
Visible and infrared imagery of these storms is primarily restricted to features observed at or near cloud tops.
And although microwave sensors can observe features beneath the clouds, they lack sufficient horizontal resolution to capture the steep wind speed gradients around the eye of a storm.
But there is another type of sensor that overcomes these limitations: synthetic aperture radar.
A Uniquely Useful Tool
Synthetic aperture radar (SAR) works by transmitting radar pulses and recording both the amplitude and phase of the reflected return signals.
These return pulses are then coherently combined over a specific time interval to produce a 2D image of radar backscatter.
For a SAR on a polar-orbiting satellite, this imagery can have fine spatial resolution of less than 100 meters over a swath that can be as wide as 500 kilometers.SAR’s unique ability to record the roughness of the ocean surface directly allows for the creation of high-resolution 2D maps that significantly improve estimates of a storm’s eye location.Currently, two SAR missions are being used to study and monitor tropical cyclones.
Sentinel-1, a two-satellite system, was developed and is operated by the European Space Agency (ESA) under the Copernicus Earth Observation Program.
RADARSAT-2 is the result of a collaboration between the Canadian Space Agency and MDA Space, a private company that owns and operates the satellite.
Directly captured in the backscattered signals acquired with SAR are many of the well-known tropical storm features found in visible or infrared images, such as the eyewall, mesovortices (circulations within the eyewall), boundary layer rolls, outflow boundaries, and rainbands (Figure 1).
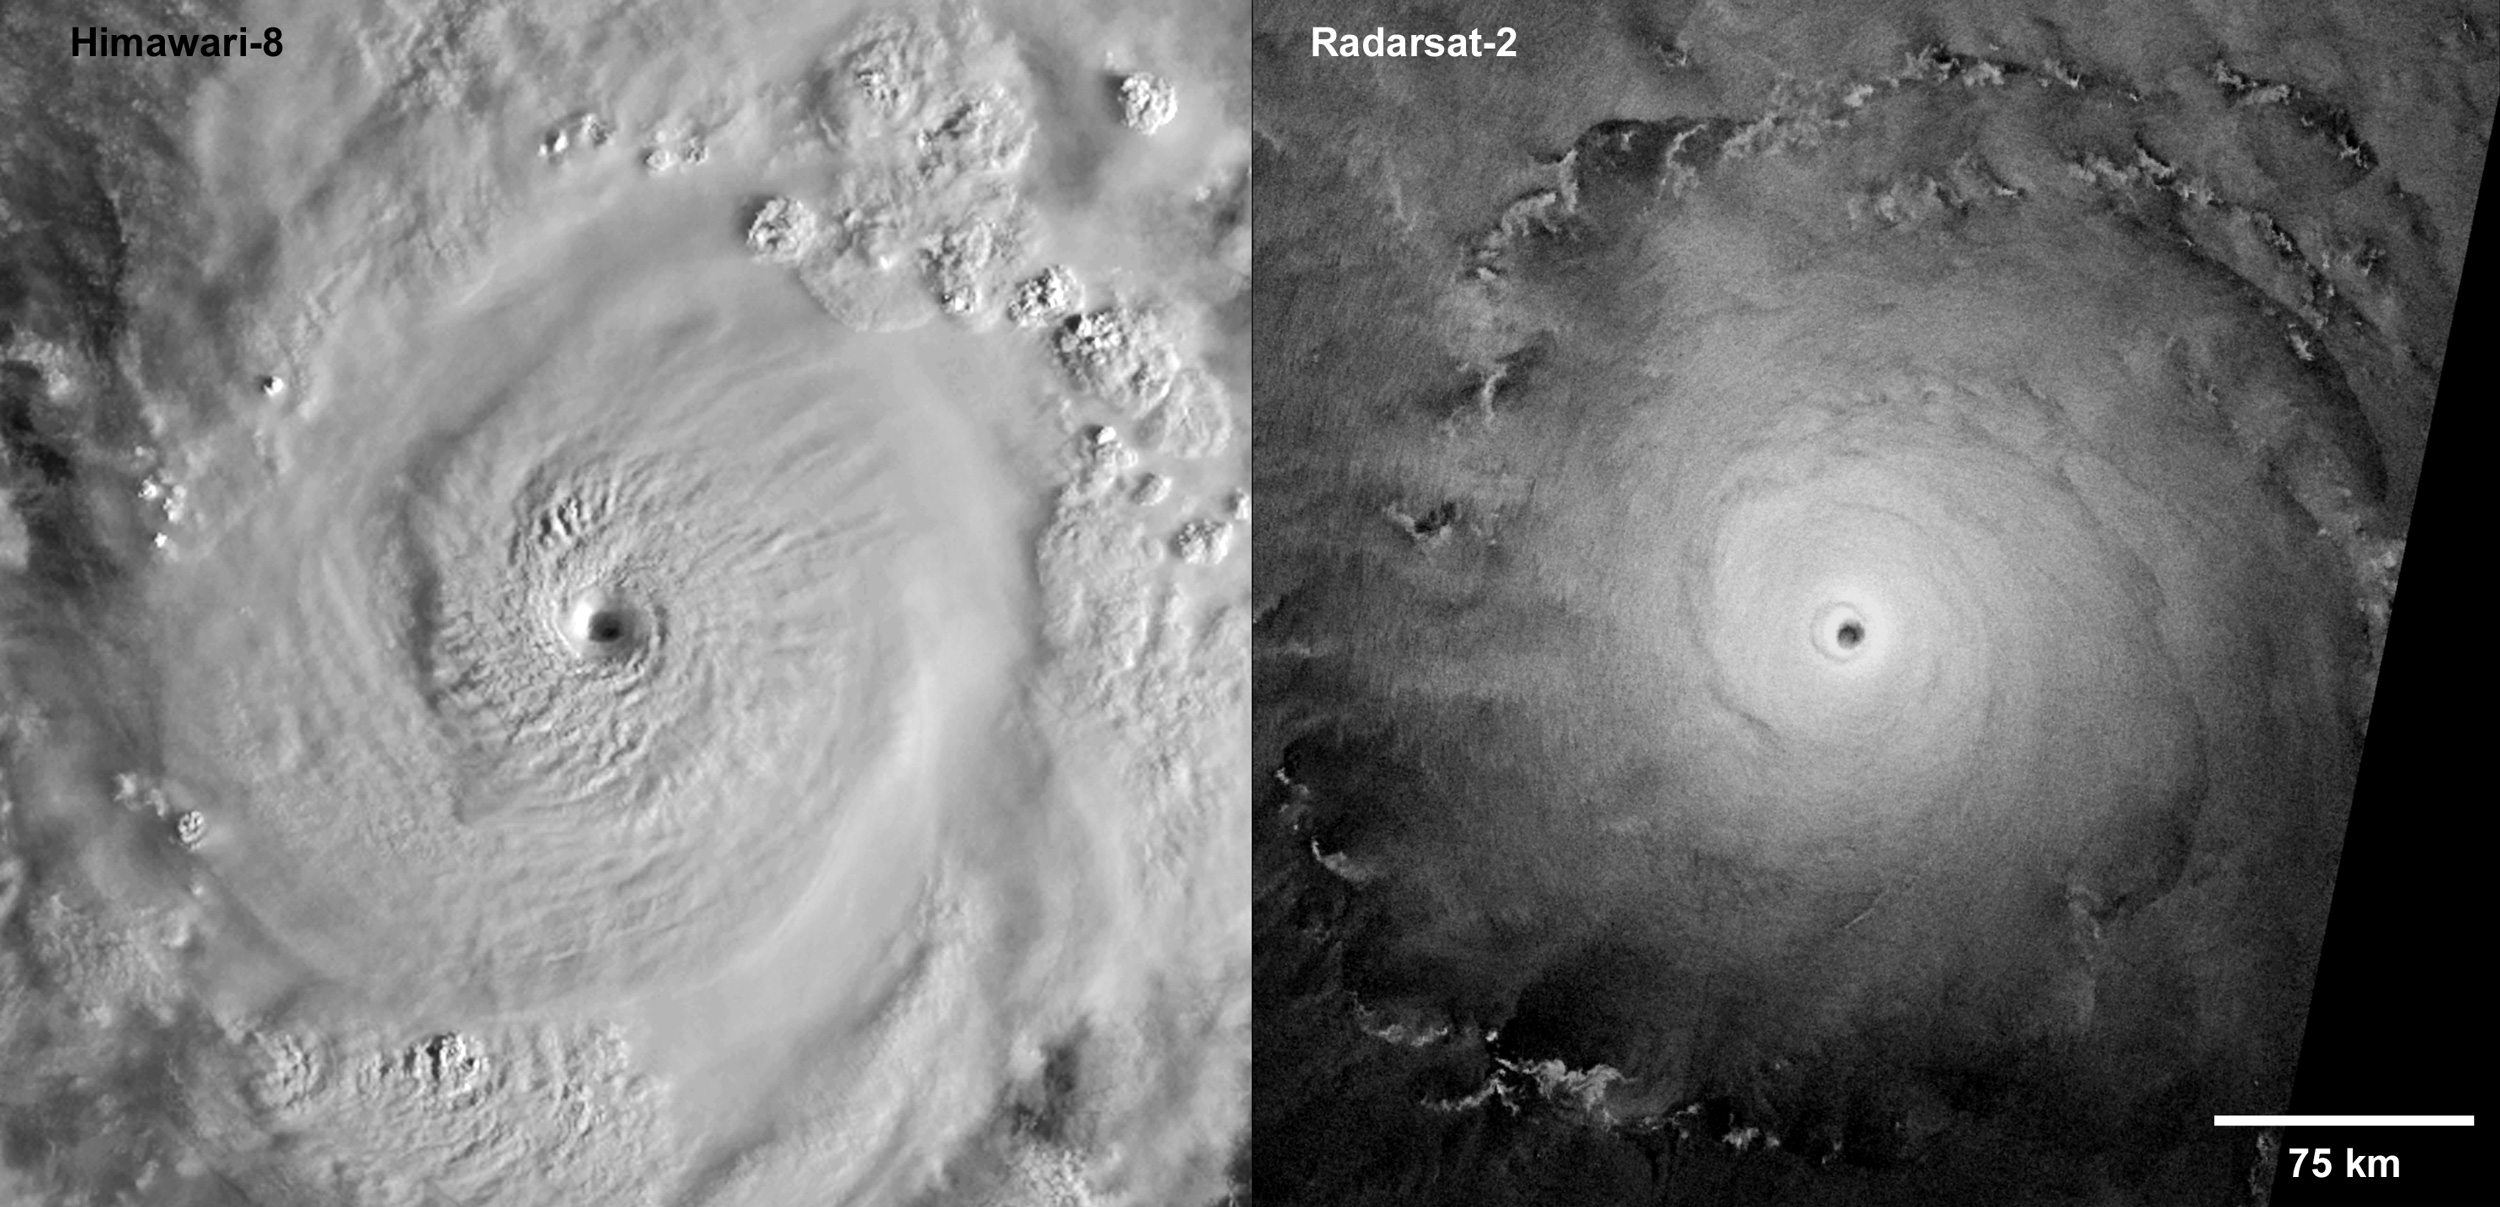
These two satellite images of Super Typhoon Goni over the Pacific Ocean were taken at almost the same time on 30 October 2020, when the storm was close to peak intensity with wind speeds exceeding 155 knots.
The visible-light image from Japan’s Himawari-8 satellite (left; 500-meter resolution) captures the reflection of sunlight from the cloud tops and shows transverse bands in the cirrus clouds, a sloping eyewall, spiral banding features circling more than 360°, and a clear eye (indicative of an intense tropical cyclone).
The wide-swath SAR image acquired by the Radarsat-2 satellite (right; with 100-meter resolution) shows the radar backscatter return from the ocean surface and patterns from convection cells, rainbands, and outflow boundaries, along with spiral wind streaks.
Credit: RADARSAT-2 Data and Products © MDA Geospatial Services Inc.
2020; Himawari-8 image courtesy of the Japan Meteorological Agency.
The maps also improve estimates of other important storm parameters used by forecasters, including maximum wind speed, the radius of maximum winds (the distance between a storm’s eye and the band containing the strongest winds), and the distance and areal extent of winds at critical wind speed thresholds that define tropical depressions, tropical storms, and hurricanes (34, 50, and 64 knots, or 17, 25, and 33 meters per second, respectively).
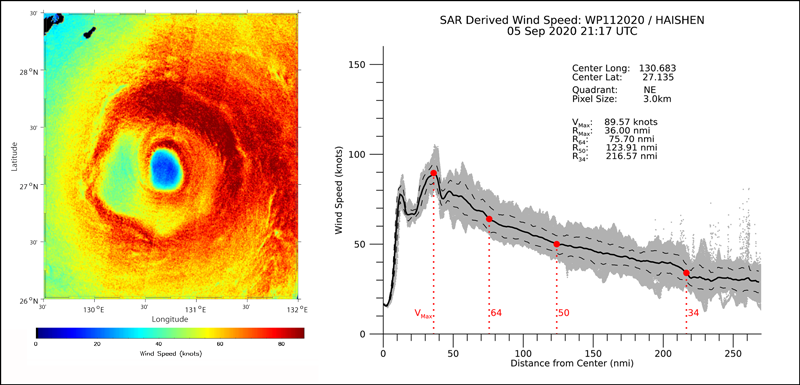 Fig. 2.
This SAR-derived wind speed map (left) shows the eye region of Typhoon Haishen on 5 September 2020 at 21:17 UTC based on data from RADARSAT-2.
Two-dimensional wind speed maps like this produce very accurate estimates of eye location and extent and clearly resolve steep wind speed gradients (shown by strong variations in the color scale).
These maps are also used to create wind speed profiles (right) that help determine maximum wind speed, the radius of maximum winds, and the extent of winds at the critical speed thresholds that forecasters use to characterize a storm as a tropical depression, tropical storm, or hurricane.
Gray dots represent SAR-derived wind speeds at each 3- × 3-kilometer pixel in the northeastern quadrant of the map at left, and the solid black curve represents the average wind speed at each distance from the storm’s center (in nautical miles, nmi).
The two peaks in the wind speed profile near 15 and 36 nautical miles (28 and 67 kilometers) from the center indicate that Haishen had a double eyewall.
SAR Capability Comes to Hawaii
Over the past 2 years, forecasters at JTWC, in cooperation with researchers at NOAA, the French Research Institute for Exploitation of the Sea (Ifremer), and the U.S. Naval Research Laboratory (NRL), have been leveraging Sentinel-1 and RADARSAT-2 SAR imagery to gain additional insights into tropical cyclone storm structure and to incorporate this information into JTWC’s operational forecasts and warnings.
The SAR-derived wind information fills an important role at JTWC because, since 1987, there has been no routine aerial reconnaissance in the area that JTWC is responsible for monitoring.
And although satellite microwave radiometers have been providing direct measurements of extreme winds to JTWC since about 2017, SAR is the only satellite sensor with sufficient spatial resolution to measure a storm’s radius of maximum winds.
In 2020, for the first time, near-real-time SAR-based wind speed maps, eye position estimates, and derived wind fixes were incorporated into operational forecasting at JTWC through the center’s Automated Tropical Cyclone Forecasting (ATCF) system [Sampson and Schrader, 2000].
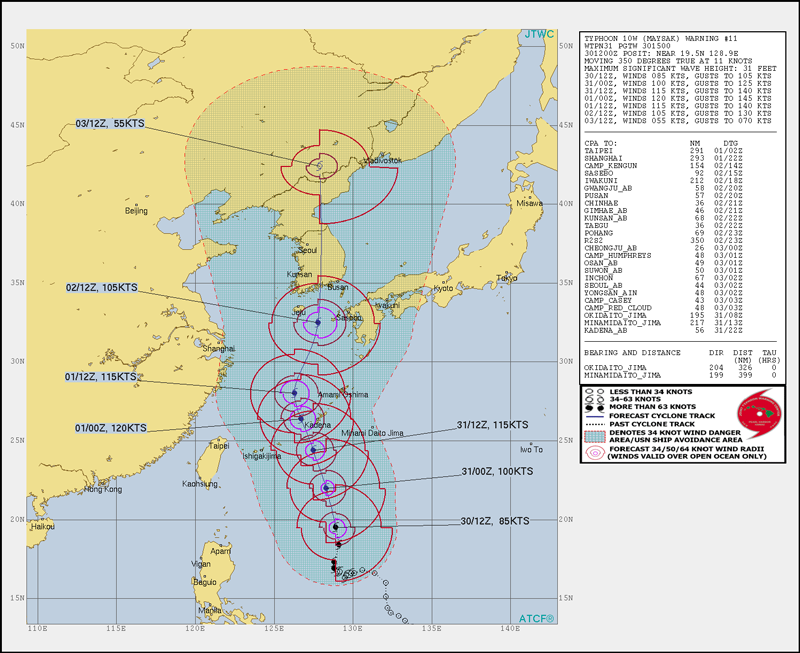
This output graphic from the Joint Typhoon Warning Center’s Automated Tropical Cyclone Forecasting (ATCF) system contains information for 30 August 2020 on Typhoon Maysak’s position (past and forecast), speed and direction of travel, and the predicted areas covered by 34-, 50-, and 64-knot winds in each quadrant of the storm (irregular circle-like outlines).
The dashed red line and the enclosed shaded area highlight the 34-knot-wind danger area.
The ATCF system produces similar reports every 6 hours during the lifetime of a storm.
(Note: Like the 2015 tropical storm in the photo at the beginning of this article, this 2020 storm is also named Maysak.)
During Super Typhoon Goni, which struck the Philippines in October 2020, several timely acquisitions of SAR data over the storm were collected prior to its landfall.
These acquisitions helped JTWC fine-tune its storm wind estimates, according to Cmdr. R. Corey Cherrett, the center’s commanding officer at that time.
He noted that accurate analyses and forecasts helped to drive the evacuation of more than 350,000 people, potentially saving countless lives.
As the frequency of SAR acquisitions increased during the 2020 storm season, JTWC began relying on SAR wind data in real-time tropical cyclone analysis, with great success.
Brian Howell, Best Track Officer at JTWC, and Typhoon Duty Officer Caitlin Fine compiled a 2019 and 2020 data set of subjective wind intensity estimates made by forecasters at the center along with concurrent SAR acquisition passes over storms.
From this compilation, they found that the information provided by the SAR passes either reinforced or prompted adjustments to forecasters’ subjective determinations.
In all cases, however, the SAR data have proved invaluable in both real-time and postseason analyses.
From Data to Forecasts
Obtaining SAR observations over the eye of a tropical cyclone using the Sentinel-1 and RADARSAT-2 systems requires some luck.
Unlike weather satellites in geostationary orbit (e.g., GOES (Geostationary Operational Environmental Satellite), Himawari, and Meteosat), which can image an entire hemisphere continuously every 10–15 minutes, satellite-based SAR instruments acquire data with a limited footprint.
Also, they acquire data during only about 30% of every orbit because of the radar’s power requirements and because of the large data volume that must be downlinked.
Further, SAR data collections must be programmed 3–5 days in advance.
Collection opportunities are identified by comparing forecast storm tracks against possible SAR time or spatial footprints.
In addition, Sentinel-1, as part of its daily standard collection pattern, sometimes fortuitously acquires imagery over tropical systems before explicit planning is enacted.
Planning collection opportunities and obtaining data are only the first steps in getting the information derived from the SAR imagery into the hands of the forecasters, however.
The NOAA Center for Satellite Applications and Research’s (STAR) Tropical Cyclone Wind System continuously monitors the advisories on active storms released by JTWC and other forecast centers to identify any imagery from Sentinel-1 passes that contains information about a tropical cyclone.
The system processes this imagery, or the preprogrammed acquisitions from Sentinel-1 and RADARSAT-2, in near-real time to determine an accurate eye location for a storm.
Next, the NOAA system creates 2D wind speed maps along with estimates of maximum wind speed, the radius of maximum winds, and the profiles detailing the distances to the three critical wind speed thresholds.
This information is sent to NRL, repackaged, and then ingested into JTWC’s ATCF system.
It is also posted to the STAR Cyclone Winds website.
At the same time, the Copernicus Cyclone Monitoring Service (CYMS) team gets the Sentinel-1 data through Copernicus’s dedicated near-real-time data hub, where targeted processing and distribution of Sentinel-1 imagery is typically done in less than 3 hours.
From there, the CYMS team converts the imagery into ocean surface wind data, which it makes publicly available through the Earth Observation Data Access website.
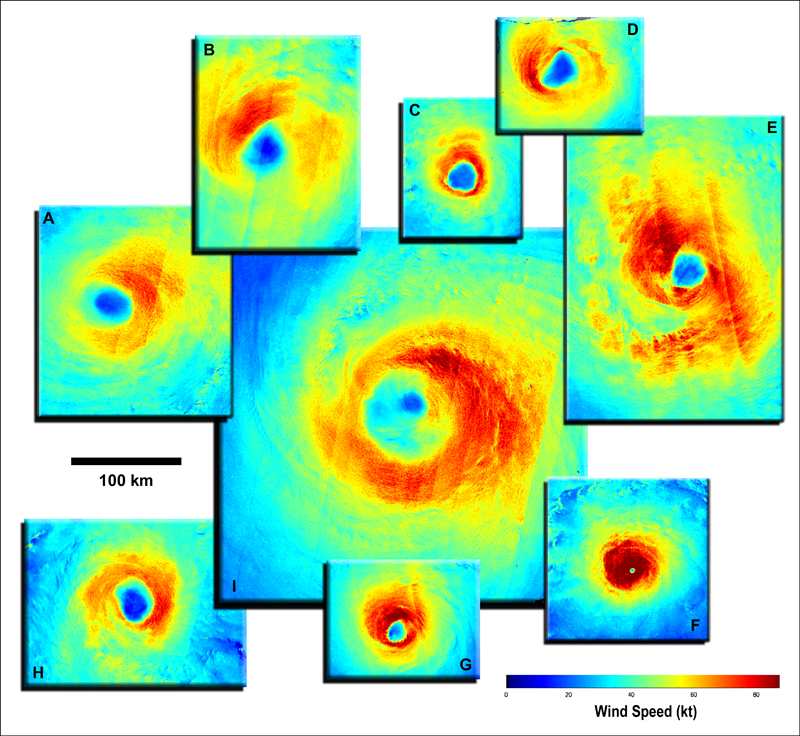
Ocean surface wind speed maps (color scale shows speed in knots) from a selection of tropical cyclones of various sizes and intensities from the 2020 season.
Categories represent intensities at the times of the SAR observations.
The colors highlight azimuthal variations in wind speed and differences in eye shapes.
(a) Category 1 Typhoon Bavi (observed by RADARSAT-2, 25 August).
(b) Category 1 Hurricane Marie (Sentinel-1B, 4 October).
(c) Category 1 Hurricane Delta (Sentinel-1B, 8 October).
(d) Category 1 Hurricane Sally (Sentinel-1B, 15 September).
(e) Category 2 Typhoon Molave (Sentinel-1A, 27 September).
(f) Category 4 Typhoon Goni (RADARSAT-2, 30 October).
(g) Category 2 Hurricane Douglas (Sentinel-1A, 25 July).
(h) Category 1 Cyclone Herold (Sentinel-1A, 16 March).
(i) Category 2 Typhoon Maysak (RADARSAT-2 and Sentinel-1A, 1 September).
This figure contains modified Copernicus Sentinel data 2020.
In 2020, 45 tropical cyclones with sustained winds stronger than 64 knots were observed: 13 over the Atlantic, 14 over the western Pacific, 4 over the eastern Pacific, and 14 in the Southern Hemisphere.
In total, 92 SAR collections were made during 31 of these cyclones (Figure 4), with observations over the eye of the storm in about two thirds of the cases (including 51 in which complete coverage of the eye was achieved and 9 with partial coverage).
In several instances, eye-centered SAR imagery was captured when major storms were near their peak intensity.
These storms include Laura (over the Atlantic, with maximum sustained winds of 145 knots), Goni (western Pacific, 155 knots), Marie (eastern Pacific, 130 knots), and Harold (Southern Hemisphere, 145 knots).
SAR collections in 2020 also included several standout accomplishments.
Daily SAR images of several storms, including Hurricane Marie (five eye-centered acquisitions, collected in 4 days) and Typhoon Goni (four eye-centered acquisitions in 3 days), produced unprecedented high-resolution looks into the time evolution of these storms’ surface wind structures.
In addition, Sentinel-1 and RADARSAT-2 obtained nearly simultaneous (within 10 minutes) and spatially overlapping data collections over Typhoons Bavi, Chan-hom, and Maysak and Hurricanes Epsilon, Eta, and Zeta.
The combined coverage passes from the two satellites produced more complete pictures of the spatial extent of the storms’ winds than would have been available with coverage from a single satellite collection.
The passes also provided opportunities to compare SAR wind speeds derived from Sentinel-1 and RADARSAT-2 under extreme wind conditions.
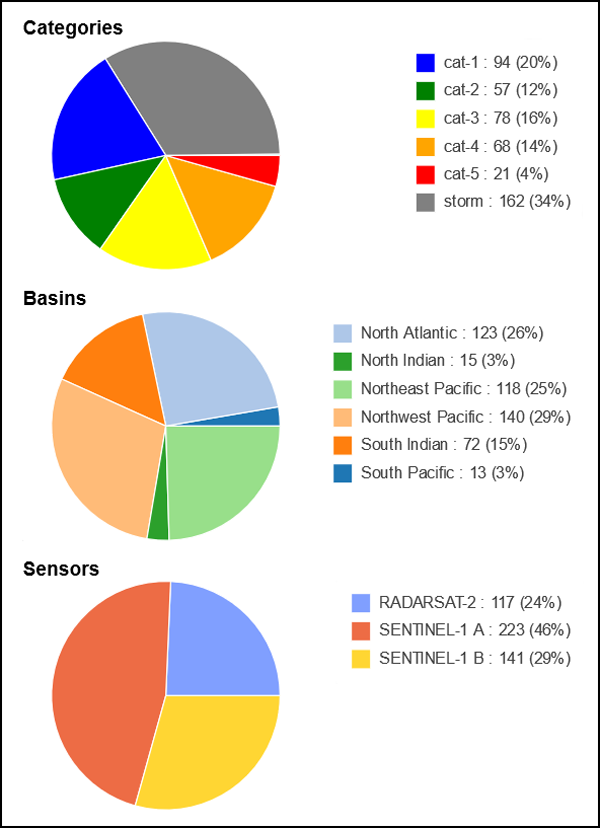
Between 2015 and 2018, SHOC collected SAR imagery over 72 different tropical systems, with 161 data collections covering the eye of a storm (Figure 5).
A recent analysis using 29 of these collections demonstrated close agreement between wind data derived from SAR and data from in situ airborne measurements [Combot et al., 2020].
Just as new SAR data provide input to support near-real-time observations for current storms, the SHOC SAR collections have been invaluable in post-storm reanalysis efforts to refine final estimates of tropical cyclone parameters for past storms in the historical archive at JTWC.
Such refinements are necessary because researchers use the JTWC archive extensively for seasonal verification and analysis studies, and their work must be based on the best available information.
Ongoing Advances in Cyclone Science
Last year was clearly a notable time in the development and use of SAR in characterizing tropical cyclones.
JTWC, in collaboration with Ifremer, NRL, and NOAA, pioneered the incorporation of SAR-derived tropical cyclone wind data into forecast products in near-real time.
The ability of SAR to produce quantitative, fine-resolution information about cyclone winds, eye locations, and other characteristics represents a significant new tool that can assist in the forecasting of tropical storms.
In 2021, ESA and NOAA will continue to acquire and analyze Sentinel-1 and RADARSAT-2 imagery over as many tropical cyclones worldwide as possible (and as often as possible) to support operational forecasters.
Both the National Hurricane Center and the Central Pacific Hurricane Center are working on ways to incorporate the SAR-derived tropical cyclone wind information into their forecasting systems.
The current season is off to a strong start with SAR collections over 12 Southern Hemisphere storms (including 20 eye/partial-eye acquisitions achieved for nine of them) and in the western Pacific over Super Typhoon Surigae, with five eye acquisitions in one 60-hour period.
On 17 May, SAR data captured the eye of Tropical Cyclone Tauktae in the Indian Ocean.
Moving forward, data collection is expected to be augmented by acquisitions from the Canadian Space Agency’s RADARSAT Constellation Mission and from upcoming missions, including ESA’s Sentinel-1C and NASA’s NISAR, both expected to launch in 2022 or 2023.
With the new capabilities provided by SAR and growing data streams from current and planned satellites, JTWC and other agencies tasked with forecasting tropical cyclones are better positioned than ever to help people and countries around the world prepare for these beautiful but destructive natural forces.
No comments:
Post a Comment