From Geosciences AU
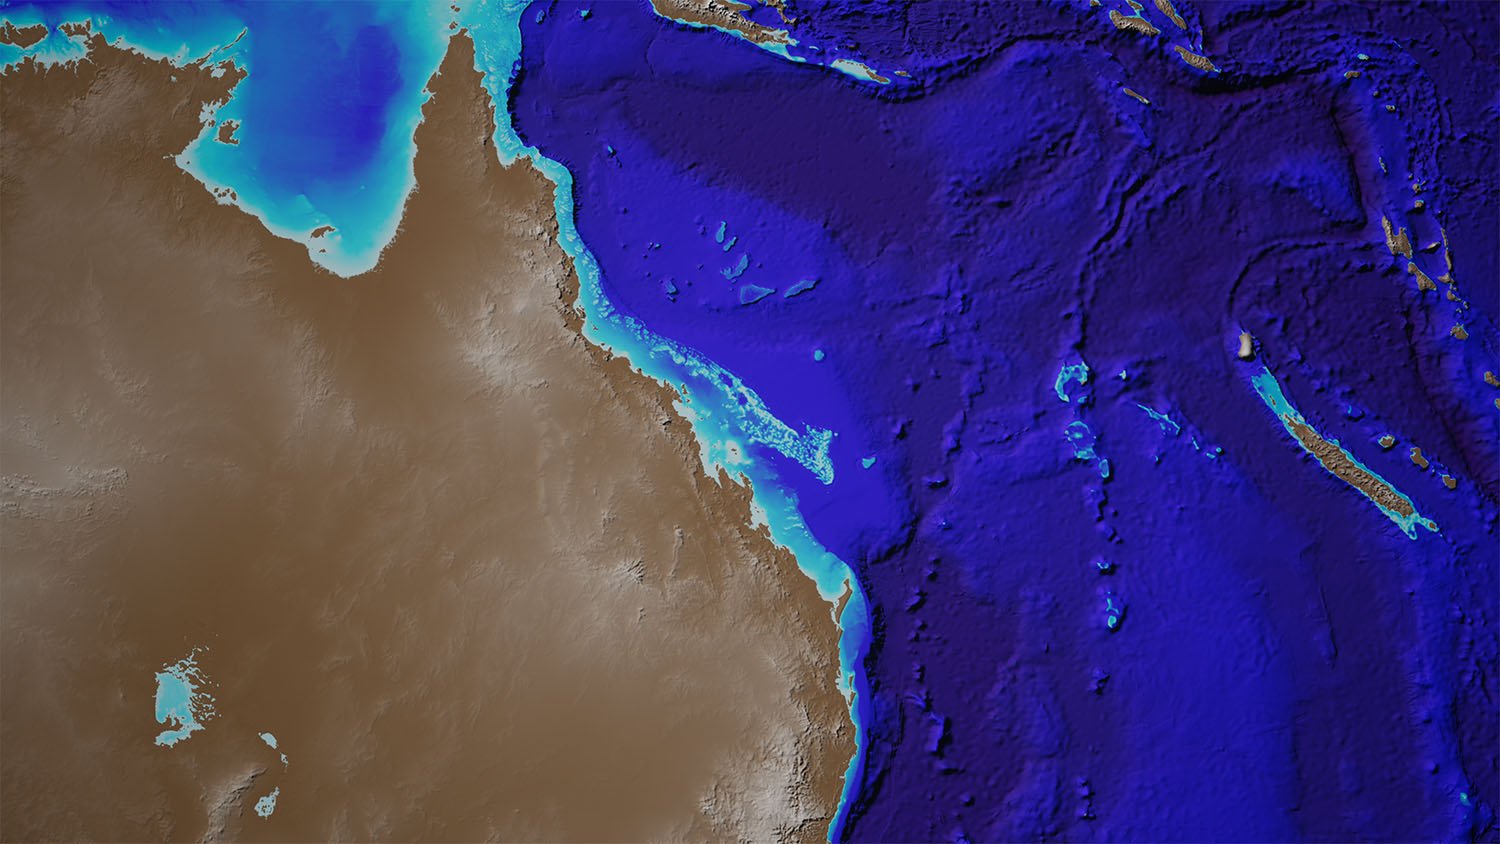
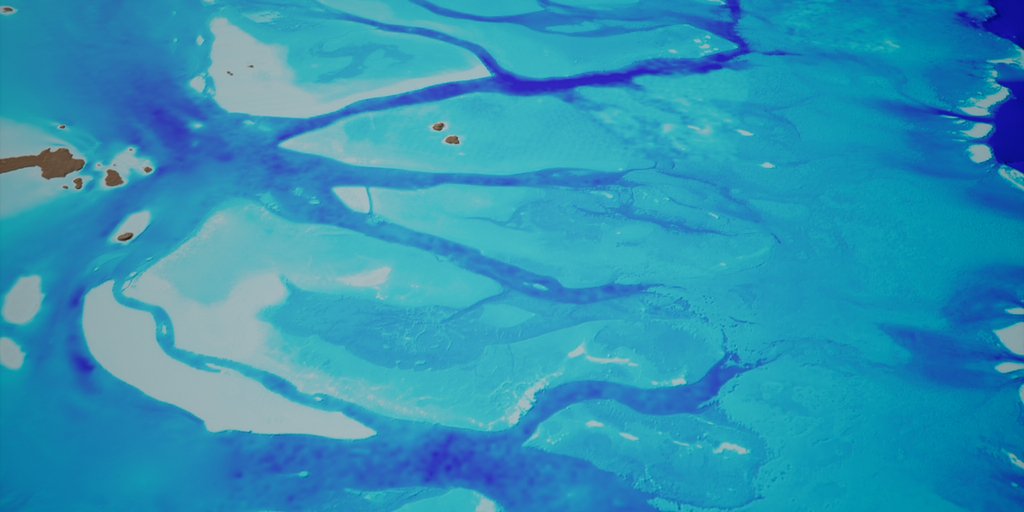
High-resolution sea floor maps released today show 1.5 million square kilometres of Australia's iconic Great Barrier Reef in unprecedented detail.
The maps are the product of a collaborative project between James Cook University, Geoscience Australia and the Australian Hydrographic Service.

This is the first high-resolution mapping of the
sea floor of the entire Great Barrier Reef.
Attribution: "Australian Hydrographic Service, Geoscience Australia, James Cook University"
JCU's research leader, Dr Robin Beaman, initiated the project in 2009.Attribution: "Australian Hydrographic Service, Geoscience Australia, James Cook University"
"The Great Barrier Reef data is the first in a series of '30-metre' datasets that will be released as part of this project. This represents the highest resolution depth model of the Great Barrier Reef, to date," he said.
"We're using cutting-edge scientific techniques to combine historical and newly-acquired bathymetry (undersea mapping) data of the entire northern coastline of Australia," he said.
"Along with the quality of the new data we've acquired, we've also been able to access undersea mapping data collected over the past few decades by government and university research programs."
"Our partners at Geoscience Australia will be releasing open source data of large parts of the coastline as it becomes available. The grids we've built will enhance our understanding of the terrain of the sea floor in shallow waters off the coast of northern Australia."

new 30 m bathymetry gridding
Attribution: "Australian Hydrographic Service, Geoscience Australia, James Cook University"
Attribution: "Australian Hydrographic Service, Geoscience Australia, James Cook University"
Chief of Geoscience Australia's Environmental Geoscience Division, Dr Stuart Minchin, said he was pleased that his team was able to get on board and support this important project with such wide-ranging potential.
"The dataset we've released today maps the entire Great Barrier Reef with data that is around eight times higher resolution than what was available previously. This is a vast improvement and it creates huge opportunities for the scientific and policy community, most importantly for the environmental management of the reef," Dr Minchin said.
"Having greater knowledge of the shape of the reef will be a critical tool for the government agencies responsible for its protection.
This gives those organizations a far more detailed view of the reef with which they can identify new reef structures and coral formations.
"Bathymetry data is also an important input for oceanographic modelling which can be used to improve our knowledge of climate change impacts, marine biodiversity and species distribution. It will also support modelling of tides and ocean currents.
"We've been able to support the team at JCU, who are specialists in this kind of marine research by contributing our resources and expertise to the project. We've also worked with the Australian Hydrographic Service to bring their vast stores of marine mapping data into the project as well.
"Collaborating with these organisations over the past four years has seen us map the entire northern Australian coastline, including the Great Barrier Reef. We saw the value in JCU's work and the potential of these high-quality datasets to provide greater certainty on Australia's maritime boundaries for government and other maritime operators."
Northerly view of Hook and Line Reefs off Airlie Beach.
Depths are
coloured red (shallow) to blue (deep), over a depth range of 84 metres.
Attribution: "Australian Hydrographic Service, Geoscience Australia, James Cook University"
Attribution: "Australian Hydrographic Service, Geoscience Australia, James Cook University"
Hook reef with the GeoGarage platform
(AHS nautical raster charts overlaid upon Google Maps satellite imagery)
Easterly view of Sudbury and Moore Reefs off Cairns.
Depths are coloured red (shallow) to blue (deep), over a depth range of 100 metres.
Attribution: "Australian Hydrographic Service, Geoscience Australia, James Cook University"

Moore & Sudbury Reefs with the GeoGarage platform
Attribution: "Australian Hydrographic Service, Geoscience Australia, James Cook University"

Moore & Sudbury Reefs with the GeoGarage platform
(AHS nautical raster charts overlaid upon Google Maps satellite imagery)
Westerly view of One Tree and Heron Reefs off Gladstone.
Depths are coloured red (shallow) to blue (deep), over a depth range of 100 metres.
Attribution: "Australian Hydrographic Service, Geoscience Australia, James Cook University"
Wistary, Heron, Sykes, One Tree Reefs with the GeoGarage platform
Attribution: "Australian Hydrographic Service, Geoscience Australia, James Cook University"
Wistary, Heron, Sykes, One Tree Reefs with the GeoGarage platform
(AHS nautical raster charts overlaid upon Google Maps satellite imagery)
Dr Beaman said he
was pleased that the Great Barrier Reef bathymetry was the first dataset
to be released, given the reef's unique marine environment.
"Being
based in northern Queensland, JCU prides itself on being at the
forefront of scientific research when it comes to the reef; we are
committed to providing government and researchers with information that
will ultimately help protect it," he said.
The series of datasets
produced through this project will provide a detailed view of the marine
geography of Australia's northern coastline, providing greater
certainty on the location and extent of the country's maritime
boundaries.
The datasets will support safety of life at sea, the
enforcement of law, and government operations.
Case study: Captain Cook and the Endeavour
When Captain Cook's ship the Endeavour first entered the Great
Barrier Reef on 20 May 1770, Cook found an 'insane labyrinth' of coral.
The ship ran aground on what is now called Endeavour Reef.
Captain Cook made painstaking maps of the region, such as this section from Cape Tribulation to Cape Flattery.
Captain Cook's map of the Great Barrier Reef, from Cape Tribulation to Cape Flattery
Cape Tribulation to Cape Flattery with the GeoGarage platform
Cape Tribulation to Cape Flattery with the GeoGarage platform
(AHS nautical raster charts overlaid upon Google Maps satellite imagery)
In 2009, we had 250 m bathymetry grids of this area:
250 m bathymetry data of the Great Barrier Reef, from Cape Tribulation to Cape Flattery
The new 30 m bathymetry grids of this region show it in extraordinary detail.
30 m bathymetry data of the Great Barrier Reef, from Cape Tribulation to Cape Flattery
Links :
- GeoSciences : To learn more on the Great Barrier Reef sea floor data / Open data
- GeoGarage blog : Ancient undersea landslide discovered in Australia /Hydrographic Surveys: Surveying Australia / Effective surveying tool for shallow-water zones / Vast reef discovered behind Great Barrier Reef / 'Un-mappable' Great Barrier Reef finally mapped ... / 3-D maps reveal depths of sea floor


No comments:
Post a Comment