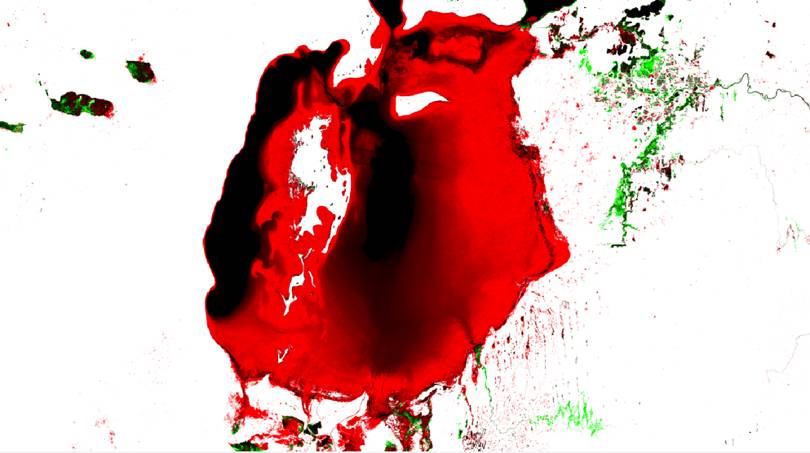
Over the past 32 years, 90,000 sq km of water have vanished. The drying up of the Aral Sea in Uzbekistan and Kazakhstan (pictured) accounts for the biggest loss
EC JRC/Google
EC JRC/Google
From Wired by
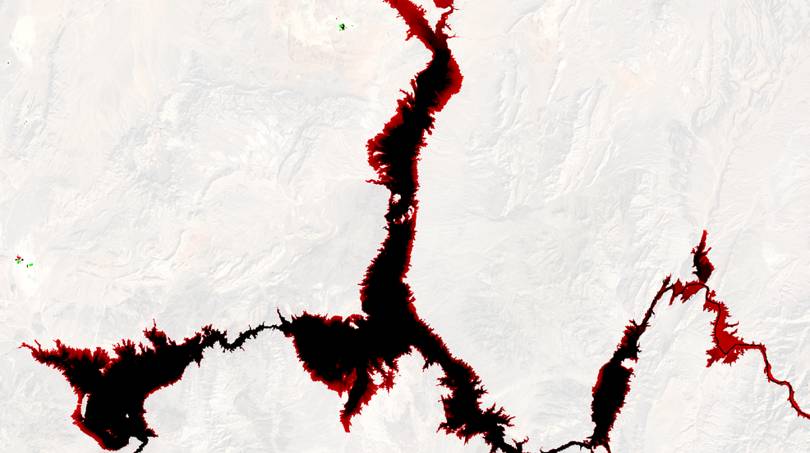
Google has partnered with the European Commission’s Joint Research Centre to produce the greatest views of water on the surface of Earth ever.
The images show changing water levels, and reveal some of the stories behind the changes from the past three decades to see how they "have shaped the world over time, in unprecedented detail."
Timelapse is a global, zoomable video that lets you see how the Earth has changed over the past 32 years. Explore the world through time at https://earthengine.google.com/timelapse.
Image credit: Landsat / Copernicus
Image credit: Landsat / Copernicus
The project took more than three years and involved thousands of computers downloading 1.8 petabytes of data from the USGS/NASA Landsat satellite program.
Each pixel in 3 million satellite images, going back to 1984, was analysed by an algorithm developed by the Joint Research Centre running on the Google Earth Engine platform.
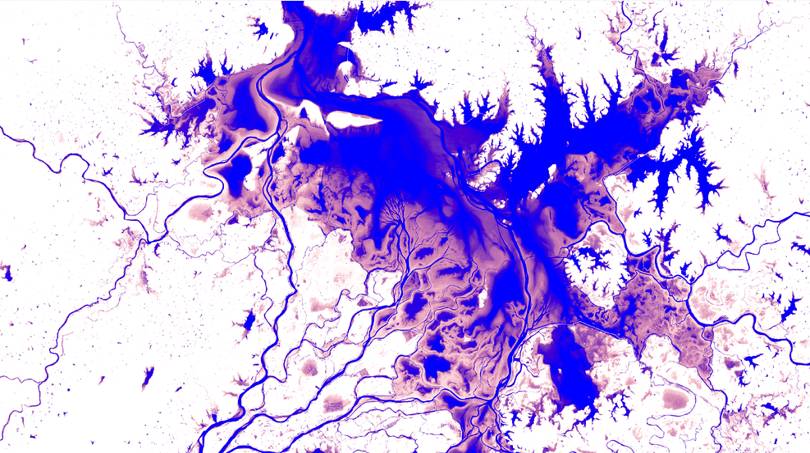
Poyang Lake, Jiangxi China
EC JRC/Google
EC JRC/Google
More than 10 million hours of computing time was needed for this,
roughly equivalent to a modern 2-core computer running day and night for
600 years.
From this, the researchers were able to establish that, over the past 32 years, 90,000 square kilometres of water - the equivalent of half of the lakes in Europe - have vanished, while 200,000 square kilometres of new, mostly man-made water bodies appeared.
The
continuing drying up of the Aral Sea in Uzbekistan and Kazakhstan
accounts for the biggest loss in the world.
Iran and Afghanistan lost over a half, Iraq over a third of its water area.
The research findings and the maps, published in the journal Nature, can be explored on the Global Surface Water Explorer site.
The data is also available in Google Earth Engine to help designers, engineers and other organisations research, use, and download.
The maps, statistics and stories, for example, can help global water security, agricultural planning, preparing for disasters, public health, climate research and so on.
The water research used the same engine recently involved in creating Google's fascinating Timelapse interactive map.
Timelapse
was first released in 2013 and a recent update added four more years of
satellite imagery, petabytes of new data and sharper photos than in any
previous version.
Users can now explore Antartica’s shifting glaciers, Bangkok’s sprawling urban growth and the rapidly drying Aral Sea.
Links :
From this, the researchers were able to establish that, over the past 32 years, 90,000 square kilometres of water - the equivalent of half of the lakes in Europe - have vanished, while 200,000 square kilometres of new, mostly man-made water bodies appeared.
Iran and Afghanistan lost over a half, Iraq over a third of its water area.
The research findings and the maps, published in the journal Nature, can be explored on the Global Surface Water Explorer site.
The data is also available in Google Earth Engine to help designers, engineers and other organisations research, use, and download.
The maps, statistics and stories, for example, can help global water security, agricultural planning, preparing for disasters, public health, climate research and so on.
The water research used the same engine recently involved in creating Google's fascinating Timelapse interactive map.
Users can now explore Antartica’s shifting glaciers, Bangkok’s sprawling urban growth and the rapidly drying Aral Sea.
Links :
- The Guardian : Google's satellite timelapses show the inconvenient truth about our planet / Google timelapse
- YouTube : videos
- Time : Google timelapse 2016
- DailyMail : Watch Earth change eyes Google unveils stunning 3 decade timelapse planet
No comments:
Post a Comment