Monday, December 23, 2024

Airlines, shipping companies and sleigh drivers rush to update crucial navigation systems ahead of Christmas rush

Magnetic declination (the angle between magnetic and geographic north) in 2025 according to WMM2025.
Red is magnetic north to east of geographic north; blue is to west. 
BGS © UKRI and © Wessel, P., and W. H. F. Smith (1996), A global, self-consistent, hierarchical, high-resolution shoreline database, J. Geophys. Res., 101(B4), 8741–8743, doi:10.1029/96JB00104 (v2.3.6)
 
From BGS 
 
Release of major upgrade to a new model tracking magnetic north prompts global reset of satellite tracking systems across trade and passenger transport routes.
 
Hundreds of thousands of mariners, airline operators and North Pole-based gift distribution specialists will be rushing to update their navigation systems after the launch of a new model tracking magnetic north, which is crucial to the accuracy of global positioning systems (GPS) that are relied upon across the world.

In partnership with the UK Defence Geographic Centre and the US National Geospatial-Intelligence Agency (NGA), BGS and the US National Oceanic and Atmospheric Administration (NOAA) have teamed up to update the World Magnetic Model (WMM).


The WMM is the standard model used by the United Kingdom and the United States governments, including the U.S. Federal Aviation Administration and the U.S. Department of Defense, as well as organizations with an international remit such as the North Atlantic Treaty Organization (NATO), the International Hydrographic Organization and the UK Hydrographic Office.

The model comprises a series of magnetic field maps that track changes in the magnetic field, such as the spot at which compass needles point in the northern hemisphere.
To ensure pinpoint accuracy, it is crucial that the shifts in magnetic north, which are caused by flow of the liquid iron in the outer core of the Earth, are taken into account in the electronic equipment that is trusted to guide global trade and enable the safe transit of travellers across the planet.
 
From GPS-enabled mobile phones to nuclear submarines, this improved resolution update will allow navigation with more accuracy than ever before to take place in the run up to Christmas — vital for all those who do not have a red nose to follow.
The WMM is officially released today, ensuring users can have the most up-to-date information so they can continue to navigate accurately for the next five years.
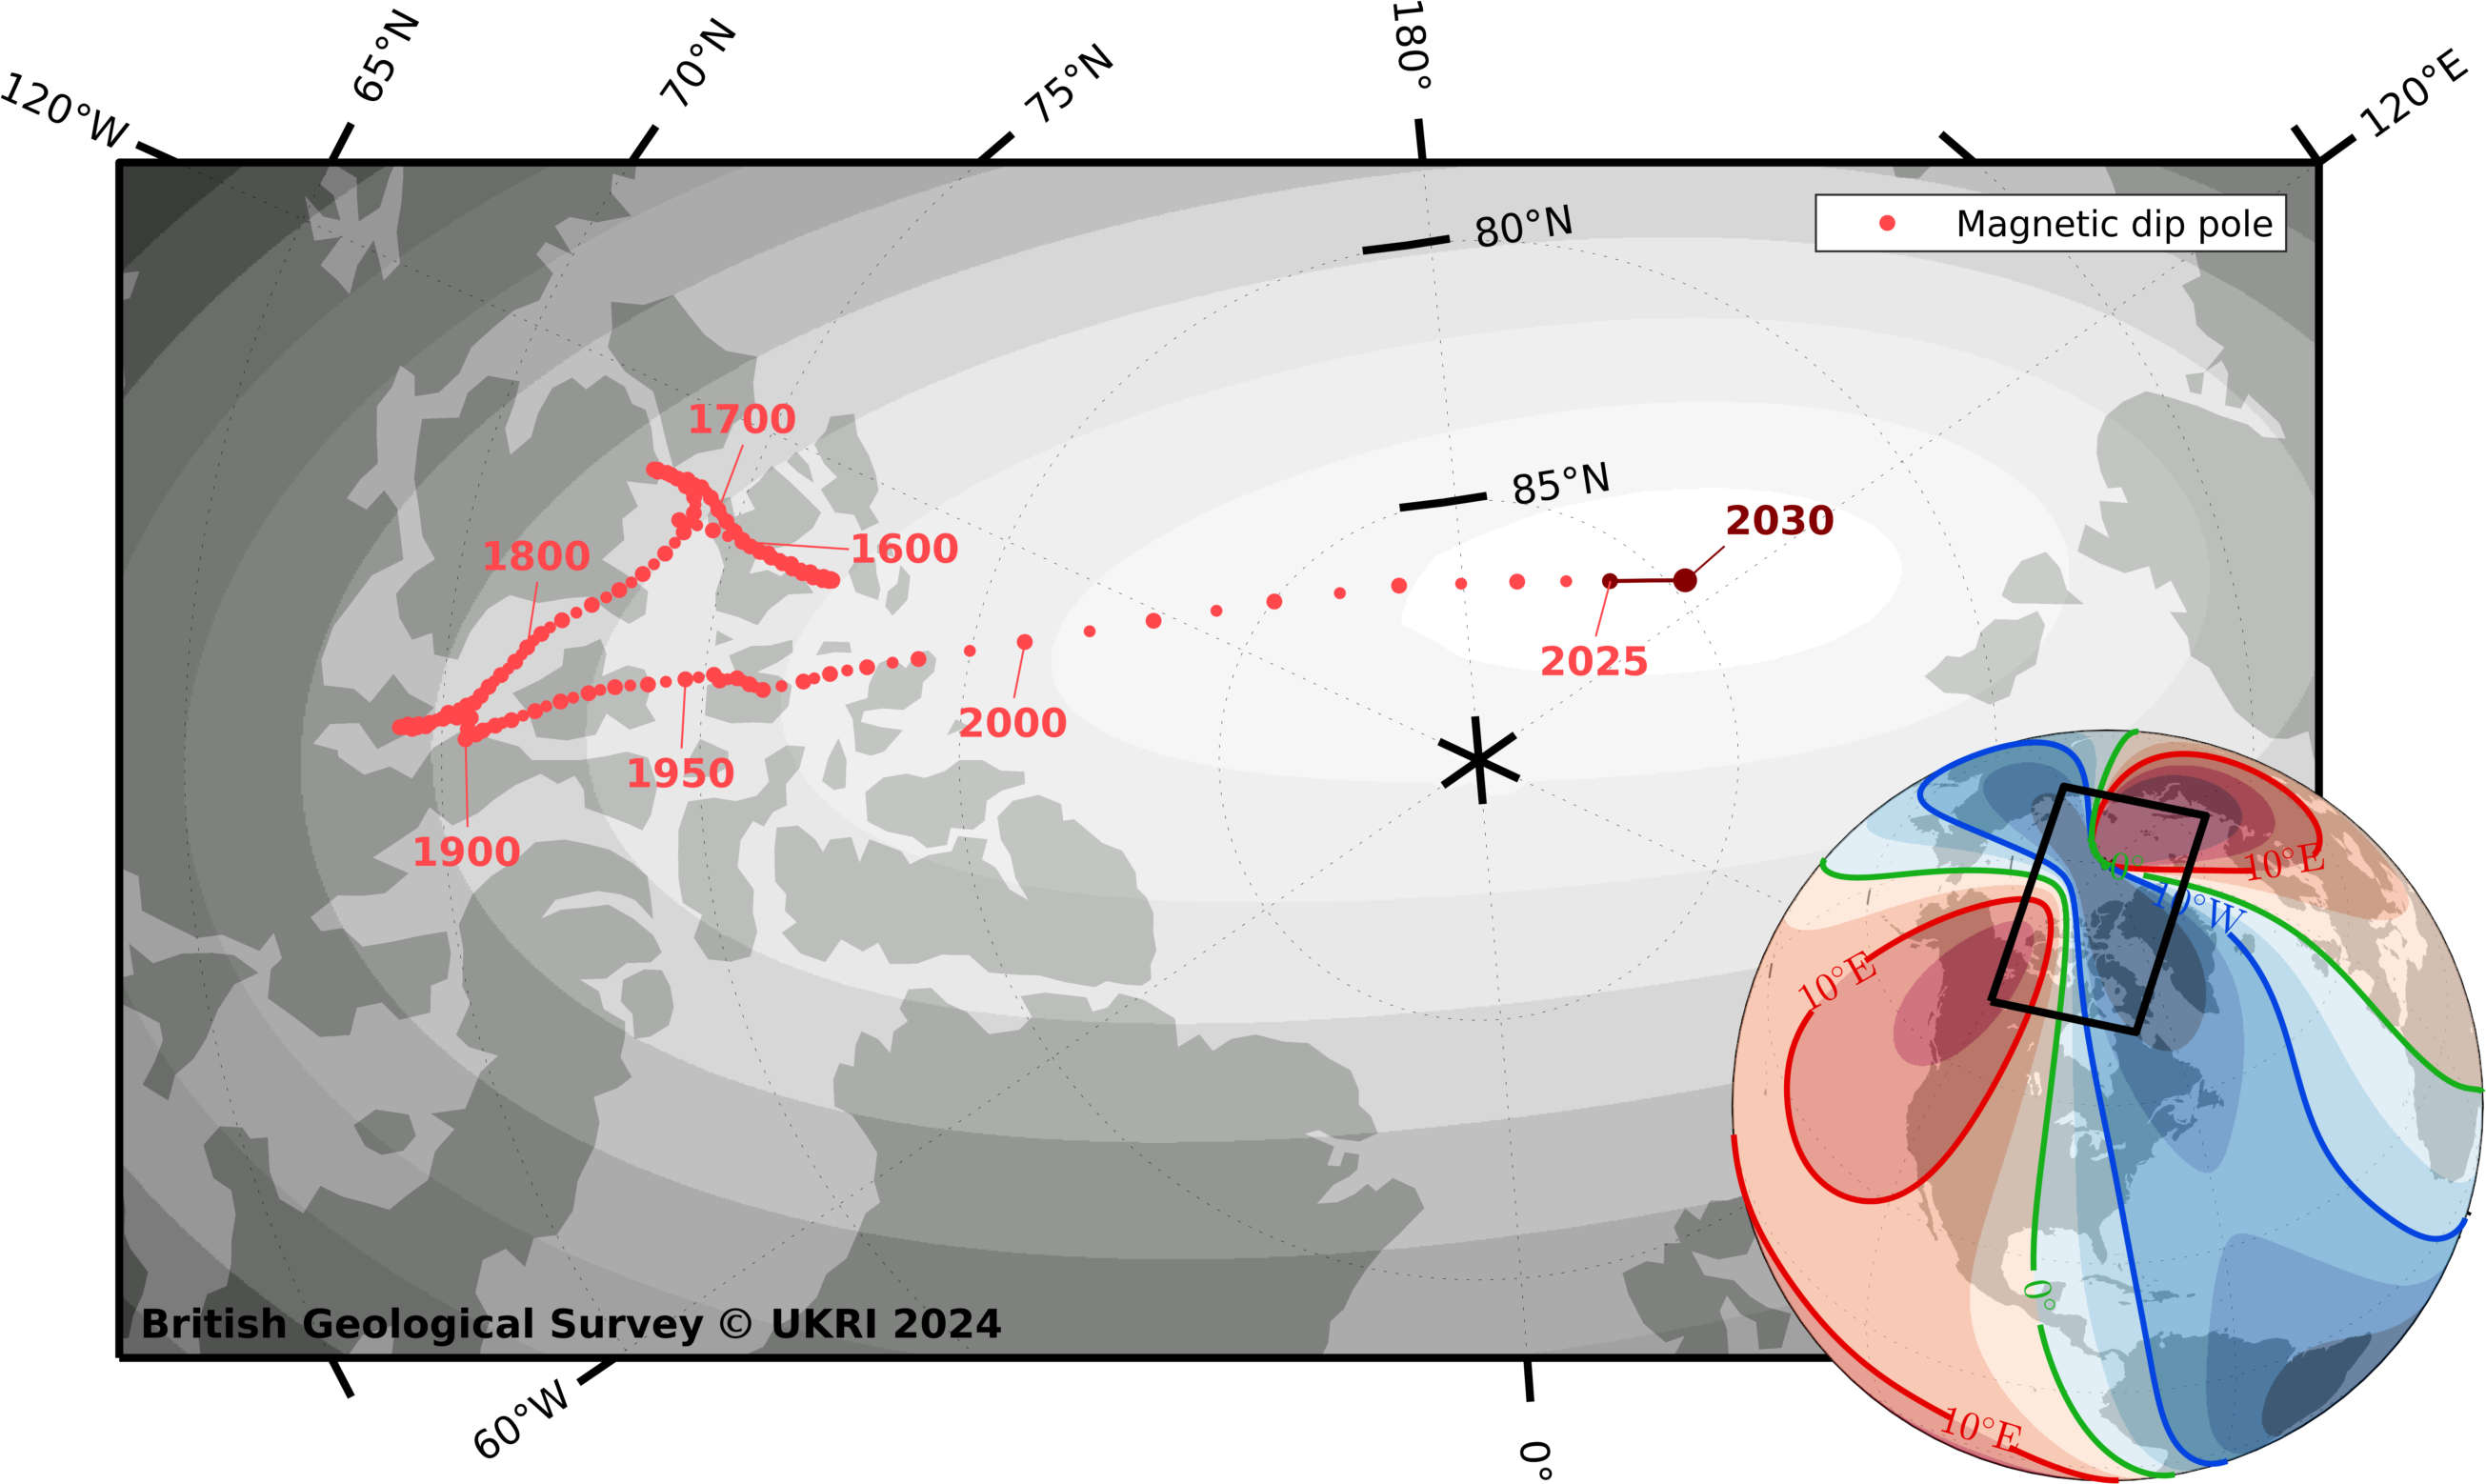
The current behaviour of magnetic north is something that we have never observed before. Magnetic north has been moving slowly around Canada since the 1500s but, in the past 20 years, it accelerated towards Siberia, increasing in speed every year until about five years ago, when it suddenly decelerated from 50 to 35 km per year, which is the biggest deceleration in speed we’ve ever seen.
Dr William Brown, global geomagnetic field modeller at BGS.
While each model predicts how magnetic north will shift over the five-year period to limit any error, the change will have an impact on travellers.
 

Magnetic north pole locations from 1590 to 2030. BGS © UKRI and © Wessel, P., and W. H. F. Smith (1996), A global, self-consistent, hierarchical, high-resolution shoreline database, J. Geophys. Res., 101(B4), 8741–8743, doi:10.1029/96JB00104. (v2.3.6).

Imagine someone was planning to travel by sleigh from a chimney top in South Africa to a snow covered-roof in the UK, a journey of around 8500 km. Using the previous WMM and setting off just one degree off-course, he would end up approximately 150 km away from where he should[1].
With a margin of error of only a few inches between chimney flues, this could cause significant issues.
Values from the updated model can now be calculated, and the WMMHR2025 and the WMM2025 are available for download.
 
Links :

Sunday, December 22, 2024

Chido tropical cyclone over Mayotte

Links :

Saturday, December 21, 2024

Sea lions with video cameras help scientists map ocean floor

Australian sea lion by John Turnbull via Flickr (CC BY-NC-SA 2.0).
 
From Mongabay by Shreya Dasgupta 
 
For the first time ever, scientists have had help from sea lions in mapping the ocean floor.
And the marine mammals have done their job well, capturing six different marine habitats, including algal meadows and reefs, that make up South Australia’s seabed, researchers report in a recently published study
 
For much of the planet’s ocean, what the seafloor looks like is still a mystery.
Conventional surveys using specialized underwater equipment and vessels require large crews as well as good weather, which makes mapping wide areas challenging and expensive, Nathan Angelakis, lead author of the study and a doctoral student at the University of Adelaide, Australia, told Mongabay in an email.
As an alternative, the researchers fit small, lightweight video cameras and movement trackers on eight adult female Australian sea lions (Neophoca cinerea).

The team had two goals: to understand the habitats and food that are critical for the endangered species, and to map the little-known seafloor off southern Australia’s coast. 

 Sea lion swimming through invertebrate reef, sponge garden, macroalgae reef, bare sand, and invertebrate boulder habitats.
Video: Angelakis et al. 2024. 

 The sea lion videographers ended up capturing more than 89 hours of data and footage, recording around 560 kilometers (350 miles) of the continental shelf, at depths of 5-110 meters (16-360 feet).
 
On reviewing this data, the scientists saw that the sea lions eat a wide variety of fish, small sharks, stingrays and octopuses, either by flipping rocks over, digging up sand, or ambushing schools of fish.
“We were also lucky enough to capture footage of a mother taking her pup on a trip to sea, providing the first direct evidence we have that Australian sea lion mothers pass on their foraging skills to pups,” Angelakis said.
 
The team also identified six kinds of seabed habitats from the videos.
They combined this habitat data at different locations, with long-term oceanographic and environmental data for those locations, to then predict habitats for areas that the sea lions didn’t visit.
“This allowed us to map and predict habitats on the seabed for more than 5,000 square km [1,930 square miles] of previously unexplored seabed across the continental shelf in southern Australia,” Angelakis said.
 
Katie Dunkley, a marine researcher at the University of Cambridge, U.K., who wasn’t involved in the study, told The Washington Post that while the number of sea lions used in the study was small, the study was a “proof of concept” showing that sea lions can help us map the ocean floor. 
Angelakis added that such baseline knowledge of seabed habitats and the conditions that influence their distribution is crucial “for understanding how they may be impacted by human activity.” 
Furthermore, the study improves our understanding of the marine habitats that are crucial for the rapidly declining Australian sea lions, he said. 
“This information is fundamental for better conserving and managing their populations in the future,” Angelakis added.

Friday, December 20, 2024

Your data’s strange undersea voyage


Courtesy of TeleGeography.
 
From Nautil.us by Charles Digges

The internet is a series of tubes.
In the ocean.


In late December of 2021, the seafloor near the tiny South Pacific Island nation of Tonga began to rumble.
The restive Hunga Tonga–Hunga Haʻapai volcano was waking up.
In the wee hours of January 15, after days of tremors, the bottom of the ocean finally cracked, disgorging the largest explosion on record.
Four blasts of molten rock that packed 1 billion tons of force each sent a plume 36 miles into the sky.
The blast was so powerful it could be heard in Alaska, 6,000 miles away.
For days afterward, lashed by tsunamis and clouded beneath volcanic ash, the Tongans were unable to call for help.

Severed in the eruption was the single undersea telecommunications cable that could carry Tongan voices and emails the 514 miles to Fiji, and from there, to the rest of the world.
It was as if a drunken god had tripped over the power cable to the collective computer.
Screens went dark, phones went silent, and the internet disappeared.
The Tongans were all alone.

“We were totally blank from the internet world for at least three days,” said Samisi Panuve, head of Tonga Cable, the company that owns the nation’s subsea connection.
In fact, Panuve said, it would take weeks of exacting repair work at sea aboard highly specialized ships for the line to be fully restored.

All the electrons of information stored on the internet’s servers may only weigh as much as an apple.

So much of the cable was damaged that portions of it had to be remanufactured from scratch.
In the interim, contemporary staples such as Google, Facebook, Amazon, and Netflix—to say nothing of telephone calls and text messages—were only flickeringly available via vexingly slow backup satellites.
Even now, internet coverage on the island can be a little spotty.
It’s still nearly impossible, for instance, to reach the website for the Tonga Cable Company itself, at least from where I sit in the United States.

For so long, the online world has been so available that its heavenly omnipresence is simply assumed.
We pick up a smartphone or open our laptops, and our consciousness is seamlessly transported to wherever—be it the ear of your grandmother in Budapest, a hotel reservation site in Jakarta, or an office meeting in Oslo—all at almost the speed of light.
But the experience of the Tongans exposes that apparent ubiquity as something a little more precarious.
The online world doesn’t simply rain down from The Cloud: It is transported by something far more tangible, far removed from the weightless data swirls that appear to emanate from Silicon Valley.
All the electrons of information stored on the internet’s servers may only weigh as much as an apple—but it takes a couple million pounds of wire to get them to your screens.

For the internet to be the truly global service that it is, many of these wires—most of them no thicker than a garden hose—are sunk full fathom five across the bottom of the ocean, where they lay alarmingly vulnerable to fishing nets, ship anchors, currents, shark bites, scuba divers with saws, earthquakes, and, of course, volcanoes.
These slender strands of mega-charged fiberoptic cables moving terabits per second account for 95 percent of all international data and voice transfers—volumes that blow satellites out of the sky.

What is more shocking than having the vast bulk of non-physical human interaction carried by something that looks like it comes from the lawn care section of a hardware store, is how comparatively rare disconnection calamities like the one that befell Tonga really are.
According to the folks who lay them and fix them, the 870,000 miles of submarine cables invisibly meshing the world together under each of our planet’s oceans demand only about 100 repairs per year—far fewer than their wind- and rain-swept terrestrial cousins.

The telecommunications analytics agency TeleGeography maintains an addictive map of all the world’s undersea cables, which bears a stylistic—and almost metaphoric—resemblance to the map of the London Underground.
To access thatmap, which is stored on a server in London, my web requests may follow a few possible routes, according to TeleGeography’s map.
It might leave the continental U.S. through Brookhaven, New York on a cable called Atlantic Crossing-1, surfacing again at Whitesands Bay on the Irish Sea.
Or it might disembark via Island Park on Long Island traversing the newer FLAG Atlantic -1cable to the town of Skewjack on the bony finger of England’s Cornwall coast.

These circuits were on my mind as I spoke with Dieter Dillard in France.
Dillard is one of those affable engineers whose enthusiasm for his craft makes it possible for him to explain it to anyone.
He started in the cable business aboard a cable laying ship in the Mediterranean, and over a couple of decades, he worked his way up to CEO of Orange Marine, a company that has laid 164,000 miles—close to 18 percent—of the world’s operational subsea cables.
He’s also whom you call when one breaks—and although Orange Marine wasn’t the company that restored Tonga’s cable (New Jersey-based Subcom was), Dillard knows exactly how it was done.

“The cable laying industry is a small one, and we all know each other,” he told me.
 
DIGITAL SPIRAL: Looking a bit like a garden hose, a glass-filled cable that can transmit data at nearly the speed of light gets slowly wound onto a ship that will lay it carefully along the ocean floor.
This ship can carry nearly 5,000 miles of cable, enough to cross the Pacific.
Photo courtesy of Orange Marine.


He came through crisp and clear over a Microsoft Teams video meeting, the 5,000 or so miles of cable between me in New Orleans and him in Paris amounting to only the slightest little visual flickers.
I imagined, with no easy way of knowing, that our conversation was piped through the Dunant cable, running from Saint Hilaire-de-Riez on France’s Atlantic Coast to Virginia Beach stateside.
As that’s one of the newer transatlantic cables, laid in 2021, we agreed it was a pretty good guess.
But the sheer number of routes running between the U.S. Atlantic Coast and Europe meant we couldn’t be positive.

And therein, he told me, lies one of the chief protections of our transoceanic communications: redundancy.
Although the companies and telecommunications consortia that own the cables are in competition with one another, Dillard said that each nonetheless rents capacity to others as insurance against a dead line.
If, for example, the company BW Digital’s Hawaiki cable is having trouble updating your Instagram from a beach in New Zealand, your attempts to inspire FOMO might instead travel to the U.S. server via the Southern Cross Cable owned by the eponymous Southern Cross Cable Network—or a dozen other circuitous routes owned by various telecom companies.

And this is, of course, what doomed Tonga: its single, lonely cable tethering it to the rest of the globe, which was laid in 2013.
Michael Clare, who studies how undersea environments interact with subsea infrastructure at Britain’s National Oceanography Center, told me that the violence of the Hunga Tonga eruption surprised everyone.
A wall of subsea debris was hurtled more than 60 miles across the seafloor toward Tonga’s cable, according to a paper Clare co-authored.
Such force, though, suggests even a redundant system along a similar route might not have kept the Tongans online in their hour of need.

The first truly intercontinental subsea cable was laid in 1866 between Newfoundland and Ireland by the SS Great Eastern, the biggest ship of its day.
Made of seven copper coils insulated in gutta-percha—a rubbery substance from the tropical sapodilla tree that’s also used to fill modern-day root canals—this cable established a 2,226-mile telegraph link, run by the Atlantic Telegraph Company.
Today, of course, we would consider it intolerably slow.
The first official message it carried was a 98-word dispatch of congratulations from Queen Victoria to President James Buchanan that took 16 hours to arrive.

Another problem was that as electricity traveled the copper, it lost power and began to smear and slur the dots and dashes of its Morse Code vocabulary, making life miserable for the telegraphists.
And that cable didn’t last long.
Attempting to sober up the cable’s diction, the company’s strident head engineer Wildman Whitehouse—a loathed figure in cable laying lore—simply shot more electricity through it, thus baking the insulation and frying the line.

It would be the invention, a few years later, of the mirror galvanometer by Whitehouse’s more brilliant workplace nemesis, William Thomson, that allowed for the much more precise articulation of electrical pulses that finally put Europe and the U.S. into regular real-time conversation.
For saving the day, Queen Victoria elevated Thomson to “Lord Kelvin”—yes, the Kelvin who invented absolute zero—and he went on to make a fabulous fortune.

By 1956, the advent of much higher capacity coaxial cable began replacing the copper subsea lines.
This enabled crisper transoceanic telephone calls, which, since the late 1920s had only been haltingly possible by radio and only during good weather.
In 1988, fiberoptic cable arrived.
These cables work by sending light pulses down long tendrils of glass, and they made everything that came before obsolete.

The first transoceanic cable message was a 98-word dispatch that took 16 hours to arrive.

The newer cables, like the old, follow 19th-century trade routes—which, in turn, follow the older pathways of human interaction, migration and, in many cases, domination.
On the TeleGeography map, it’s clear that South America and Australia don’t seem to have much to say to each other.
But among the first subsea cables installed were ones linking telegraph operators in England with colonial colleagues in India and Australia.
The new Amitié cable, a Microsoft-Meta joint venture, moves 400 terabits a second of data between the U.S. and the United Kingdom along one of humanity’s most traversed sea routes.
Meta’s planned Anjana cable, scheduled to be operational later this year, could be seen to chart Columbus’ route from Spain to the New World.

The business of getting a cable from point A to point B begins on special surveying ships running a chorus of acoustical sounding equipment.
Sonar readings are fed into a bank of shipboard computers that provide remarkably high resolution, allowing engineers to see whether the seabed is sand or hard rock.
These data trace a corridor to pass the cable though as close as possible to the intended route.
The width of the corridor is usually two- or three-times the depth at which the cable will lie, which allows for some—but not much—wiggle room to skirt undersea formations—like cliffs and trenches.
When a survey ship encounters an impassible barrier—a sharp drop not accounted for on nautical charts, for instance—all it can do is back up and attempt to rechart another route as close to the planned route as possible.

With all this high-tech undersea cartography, how did the poor Tongans end up with a cable running so close to a volcano?
Clare pointed out that two unavoidable factors beset its route.
First, the Tonga volcano eruption was one of those once-in-a-thousand-years type scenarios.
Given that the expected lifespan of any given cable is about 25 years, he told me, the gamble seemed worth it.
Second, subsea cables are really expensive.
At north of $80,000 per mile, survey ships get points for sticking as close as possible to the route drawn out by the folks on dry land.
But volcanoes, Clare said, continue to be blind spots, especially in the South Pacific.

When it comes to physically laying cables across the floor of the ocean, Dillard says that the crew of the SS Great Eastern in the 1860s would recognize what crews on Orange Marine vessels are up to today.
“It’s all cable and hooks,” he tells me.
“The mechanics of the process have remained pretty much the same.”

The process of laying underwater cable begins by coiling several thousand miles—and tons—worth of cable onto the specialized circular basins aboard, say, Orange Marine’s vessel the Rene Descartes.
As the cable is fed aboard at port, one person on the ship will walk the cable in a circle, as if coiling the world’s longest garden hose, while other crewmembers literally lie down on it to ensure it doesn’t snag or knot or gain tension.
Upward the cable will coil on top of itself, like a snake in a charmer’s basket until the basin is full.
Even with teams of dozens of people working around the clock, it takes as long as four weeks to load the ship.
The Rene Descartes, which measures about 475 feet long, can pack nearly 5,000 miles of cable—enough to lay an uninterrupted line across the Pacific.

At sea, paying out the cable from deck to seafloor is slow business—and that’s basically all down to managing slack.
Figuring out how much slack to pack is a headache, Dillard says.
Bring too much, and your cable will lie lazily across the seafloor in an unmappable mess; too little, and it could hover like a tightwire between rises on the seafloor, apt to get snagged by surface ships, unable to reach its landing station.
 
REMOTE WORK: When undersea internet cables break, technicians pinpoint the damage, and other workers deploy an ROV—navigated from onboard a ship—to cut the cord so that crews can haul it onboard to repair.
Photo courtesy of Orange Marine.


Following the granular details of the surveys that Orange Marine’s bathymetry vessels would have taken months before, the Rene Descartes will chug forward at about 9 miles per hour, sometimes more quickly if the cable is running down an underwater incline, sometimes more slowly if up an ascent.
Each of the ship’s movements is guided by what is known as differential GPS, a system that allows not just the ship as a whole, but its bow and stern, to occupy different sets of coordinates down to the centimeter.
These coordinates are fed into another bank of computers that guides how quickly or slowly the cable gets paid out.

At each end of a cable is a landing station, often as big as a house and usually tucked away in some unassuming seaside settlement—near, rather than in, a bustling harbor, an industry practice that keeps the cables inconspicuous and away from the hardware dragged by shipping and fishing traffic.
The fundamental purpose of the landing stations is to shoot light frequencies carrying our data down the hair-thin tendrils of fiberoptic glass that run down the center of each cable.
For this light to travel the enormous distances between landing stations and maintain its original strength, about 10,000 volts of electricity are pumped from both sides of the cable down a copper sleeve that cocoons the fiberoptic strands.
This electricity powers signal amplifiers called repeaters.
All of this AC voltage is grounded by the seafloor itself, Dillard explains.

The repeaters lie on the ocean floor along the cable at intervals of about 50 miles.
Each is a pressurized chamber that weighs about 500 pounds and creates a bulge in the cable that resembles a rat just swallowed by a snake.
Within them, little spiral tracks of erbium are charged to goose along the photons that make up our emails, newspaper subscriptions, and cat videos.

The most perilous part of any cable’s journey is through the shallows near their landing stations.
At less than about 3,000 feet of depth, the cable will take on additional armor, usually steel rods and, closer to shore, a shell of cast-iron piping.
During this stretch of the journey, a cable will ordinarily be buried.
For this purpose, the Rene Descartes, for example, has an enormous plow it can lower to dig trenches through the seabed, the cable laid in the furrow from the plow’s trailing edge.

Then, when the water eventually becomes too shallow for the ship itself to progress, the cable is floated to shore on a series of balloons, one every few feet holding the cable along the surface while a bevy of technicians guide it to its plug-in on shore.
The balloons are then snipped off, the last yards of the cable buried, and the very end wired into the network of whatever landmass is the next stop on the information superhighway.

As Tonga—or other recent failures like the SEACOM and EASSy cable outages around South Africa last spring—reveal, things can and do stumble over the network.
And it doesn’t always take something as catastrophic as a volcano to foul things up.
In fact, natural events like eruptions, earthquakes, or freak currents only account for about 12 percent of disconnects.
The most common emergencies that any of Orange Marine’s six globally stationed vessels respond to are cases where dragging anchors slice cables or fishing trawlers snare and sever them.

But how on earth do you locate a break along thousands of miles of cable at the bottom of the ocean? For electricians at the landing stations, it’s a relatively easy process: spread-spectrum time-domain reflectometry.
In simple terms, a landing station sends out a special electrical “ping”—much like sonar—and waits for the echo.
The so-called spread-spectrum signal means that it’s scrambled into a unique digital fingerprint that distinguishes it from other electrical noise on the cable.
When the ping bounces back, the cable operators can detect the coordinates of the break.

A submarine cable generally consists of a lead sheathed cable and is usually armored.
This is a cross section of a submarine power cable used to connect mainland areas or cities via water passages.
(30cm of cable costs around $400)

How do you locate a break along thousands of miles of cable at the bottom of the ocean?

Arriving at the site, a repair ship again has to manage problems of slack—or rather lack of it.
If the cable has been laid to the exacting specifications of its survey, hugging the contours of the seafloor, you can’t just drop a hook and fish it out.
It’s too tight.

Instead, the technicians on the ship will lower a grapnel, which the ship will then hitch up under the cable to just slightly raise it from the ocean floor.
The ship’s ROV will be lowered to the sea floor, where it churns toward the cable with shears and cuts it off.
At this point, yet another hook can be lowered to retrieve the loose end of the cable and haul it onto deck.

This is when something like neurosurgery begins in a special workshop on deck as four cable engineers, working two at a time in 12-hour shifts, fuse a fresh length of new cable to the broken end they just hauled up from the deep.
From here, the other cut end of the cable still on the seafloor can be hoisted aboard, and the two sides can be spliced together.
All of this typically takes days.

To ensure that the newly lengthened cable doesn’t stray from its original coordinates—which are noted precisely on navigation charts the world over—the extra length that was added during the repair must be carefully folded along the contours of the original cable.
Yet even these small additions will be blasted out to the folks that make the navigation charts so the tiny bits of extra cable can be noted and, hopefully, avoided.

As humanity’s thirst for data and communication are growing, so too, must the cables.
As of five years ago, Dillard says the cables he was laying off any of Orange Marine’s six installation vessels contained 12 gossamer strands of fiberoptic cable: six carrying humanity’s queries in one direction, six in the other.
By now, he says, the cables contain as many 24 fiberoptic strands, doubling their already searing bandwidth to about 225 terabits a second.
With such capacity, one could send all of the information in the Library of Congress to Bombay in about 12 minutes.
Or, more practically, 9 million viewers in Japan and Taiwan could simultaneously stream high-definition films from a Netflix server in the U.S. on half of a single cable with no discernable lag.

“Their capacity is unimaginable,” says Dillard.

For all their hair-raising bandwidth, the retracing of the same lines woven decades ago under the seas threatens to leave countries like Tonga adrift with their single cables or single paths of data in and out.
As Panuve told me, he’d love to see new pathways of connectivity—if anyone could be persuaded to pay for them.
For the internet to be the borderless egalitarian love-in it was always sold to be, its very hardware needs to ford new routes.
For now, the imbalance shows where the money really flows.

Links :

Thursday, December 19, 2024

SWOT sharpens seafloor focus

 
Floors of three oceans seen by SWOT's satellite-mounted altimeters

From SpaceDaily by Robert Monroe
 
A satellite-mounted instrument has in just one year produced higher-resolution imagery of the global seafloor than that from comparable systems over the past 30 years.

 
The Surface Water and Ocean Topography (SWOT) satellite-mounted instrument package is revolutionizing several areas of oceanography. 
Scripps Institution of Oceanography at UC San Diego researchers Yao Yu and David Sandwell with colleague Gerald Dibarboure reveal sharper images of the seafloor made from only one year's worth of data collected from SWOT flyovers. 
 
At present, ship-mounted soundings have surveyed about 25% of the seafloor.
For the other 75%, the only information comes, indirectly, from satellite altimeters that measure the detailed shape of the sea surface.
This shape provides information about the variations in gravity from undersea topography, so altimeter data provide most of the seafloor topography shown in common map programs such as Google Earth.
 

The parallel ridges of abyssal hills, as seen by the Surface Water and Ocean Topography satellite, extend out from the flanks of a seafloor spreading center (black lines) in the Indian Ocean.
-Yao Yu-
 
Satellite communication devices

Yao Yu, a postdoctoral researcher at Scripps Institution of Oceanography at UC San Diego, and colleagues revealed the results produced by the Surface Water and Ocean Topography (SWOT) radar altimeter in a study published Dec 13 in the journal Science.

The team used SWOT data to transform what may have resembled blurry blobs into discernible seamounts, ridges and troughs.
They compared SWOT data to 30 years' worth of data from traditional altimetry that only measured in one dimension rather than in the swaths that SWOT measures.

"In this gravity map made from merely one year of SWOT data, we can see individual abyssal hills, along with thousands of small uncharted seamounts and previously hidden tectonic structures buried underneath sediments and ice," said Yu.
"This map will help us to answer some fundamental questions in tectonics and deep ocean mixing."

A multipurpose instrument package, SWOT can also resolve subtle nuances of ocean circulation by measuring the topography of the ocean surface, which is ever-changing.
Those data show what gravity's pull is like across given swaths of ocean, revealing phenomena such as internal waves the way a medical imaging device can view internal organs of the body.

The SWOT measurement concept (image credit: NASA)
 
The instrument-packed satellite, launched on Dec. 16, 2022, is a joint endeavor by NASA's Jet Propulsion Laboratory ( JPL) and its French counterpart CNES (Centre National D'Etudes Spatiales), with contributions by the Canadian and UK Space Agencies.
Scripps Oceanography joined six other research institutions leading ocean campaigns based on SWOT data.

Co-authors of the study include geophysicist David Sandwell from Scripps Oceanography and Gerald Dibarboure from the Centre National d'Etudes Spatiales in Toulouse, France.

The ultimate resolution of marine gravity from SWOT will provide sharpness to the level of at least eight kilometers (five miles).
That is still not as detailed as the 200-meter (650-foot) scale resolution obtained from ship-mounted instruments but will cover the three-quarters of the seafloor not mapped by ships.

"We haven't reached the plateau yet," said Yu.
"With more data accumulated we will be able to study changes in the marine gravity field, such as from undersea volcano eruptions."

Sandwell, already the originator of most Google Earth seafloor imagery, is now leading a global effort with the Technical University of Denmark and the U.S. National Geospatial Intelligence Agency, the Naval Research Laboratory, NOAA, and the French agency Collecte Localisation Satellites to make an improved global seafloor map using SWOT marine gravity combined with all publicly available ship soundings.

Links :

Wednesday, December 18, 2024

World's most dangerous sea passage : the Drakes Passage

 
From MarineInsight by Zhara Ahmed
 
You must have heard of the Panama Canal, a marvel of engineering that revolutionised travel by significantly reducing the time it takes to ship goods around South America.
But before this shortcut existed, sailors had to brave a much more treacherous route: the Drake Passage.


The Drake Passage, a 620-mile body of water separating Cape Horn, Chile from Antarctica, is as legendary as perilous.
Imagine the distance between London and Berlin condensed into a churning seaway where the Pacific and Atlantic Oceans collide.

The average depth here is a staggering 11,150 feet, with some areas plunging deeper than the peak of Mont Blanc!
This infamous strait isn’t just a geographical curiosity; it’s a rite of passage for some of history’s most daring explorers, and a region even seasoned mariners avoid at all costs.

The passage is named after Sir Francis Drake, a swashbuckling Elizabethan seaman who spent his life plundering for the British crown.
In 1577, Drake led an expedition to find a passage around South America.

While he never actually crossed the Drake Passage itself, his journey paved the way for future exploration.
Interestingly, the first sighting is attributed to Spanish explorer Francisco de Hoces decades earlier.

Even today, some call this route Mar de Hoces. This route, around Cape Horn, remained crucial until the Panama Canal opened.

The Drake Passage in the GeoGarage platform (UKHO nautical raster chart)

So what makes the Drake Passage so dangerous?


Firstly, its remote location offers no refuge in case of emergencies.
Ships must be well-equipped and self-sufficient for the journey.
Secondly, the waters are some of the coldest unfrozen on Earth, making hypothermia a constant threat for anyone who falls overboard.
Thirdly, the passage is a battleground where currents from the Pacific, Atlantic, and Antarctica collide, creating unpredictable and turbulent conditions.

Finally, the winds here are no joke.
Nicknamed the Roaring Forties, Furious Fifties, and Screaming Sixties for their ferocity based on latitude, they whip up monstrous waves and choppy seas, making navigation a terrifying ordeal.

Centuries before Antarctica’s discovery, Captain James Cook ventured south in 1772, reaching record latitudes but missing the continent itself.
His warnings didn’t deter 19th-century explorers like John Davies and Robert Falcon Scott, who braved the region’s dangers for seal hunting and exploration.

Tragedies like Shackleton’s Endurance, trapped in ice, showcased both human courage and the unforgiving nature of the region.

Even today, the Drake Passage continues to challenge those who dare to cross it.
In 2012, a yacht named Mar Sem Fim encountered hurricane-force winds and was ultimately wrecked on the Antarctic ice.

It is estimated that Drake’s Passage contains about 800 shipwrecks, where around 20,000 sailors have lost their lives.

The most recent accident in Drake’s Passage occurred in 2022 on a Viking cruise ship.
A rouge wave smashed through a window, which sent broken glass flying.
Sadly, a 62-year-old woman was killed and 4 other passengers suffered injuries.

Today, scientists continue to study the Drake Passage, not just to understand the past but also to predict the future of our planet’s climate.

While exploration technology has improved, the respect for the Drake Passage’s power remains paramount.
It serves as a reminder of humanity’s smallness in the face of nature’s might, and the delicate balance between courage and recklessness.
 

Tuesday, December 17, 2024

A new layer in the GeoGarage platform : Argentina nautical charts based on rasterized ENC material from SHN

 Availability of a new dedicated layer for Argentina with SHN rasterized ENCs (full catalogue)
 
The layer also contains charts for Antarctica areas managed by SHN
so 6 ENC for : Coronation & Laurie Island, Esperanza, Primavera, Melchior, San Martin Bases & Deception Island
 
Until today, the GeoGarage platform used the raster paper chart material (RNC) provided by SHN to display nautical charts for the Argentina areas.

For internal management reasons specific to SHN (Serviceio de Hidrografia Naval) -the Argentina Hydrographic Office- has canceled the delivery of updated RNCs.
By the way, the availibility of RNCs was not completed (83 raster charts on a total of 144 paper maps).

The GeoGarage platform was already in the capacity to deliver a rasterized visualization of Electronic Navigation Chart (vector ENC) through their web services (WMTS) for their B2B customers involved in webmapping and other onshore GIS activities.

Today, the GeoGarage platform is now ready to propose the visualization of official ENC to their customers using mobile navigation apps (non SOLAS) so Weather 4D Routing and Navigation on iOS and SailGrib on Android.
 
In consequence, the GeoGarage platform no longer offers a subscription to Argentina Raster charts for Argentina on its e-commerce platform for mobile apps.
However, the Argentina RNC subscription will continue for their current mobile customers until its expiry date (visible on your W4D R&N/Sailgrib application) but will not be automatically renewed on this date.

The RNC plan is replaced by a new layer based on ENC type maps edited by the Servicio de Hidrografia Naval (SHN), and rasterized for W4D/Sailgrib : Argentina (derived from SHN ENC)
The price of the annual subscription is now 38.99 EUR.
 
So Weather4D R&N and Sailgrib users (with last updated versions) can right now display the whole catalogue of NLHO ENC (107 ENC at this time), with a half-yearly updating process : see GeoGarage news

Today, in this first version, the vector ENC are displayed using a graphical rendering similar to the one used in official ECDIS (s-52 IHO specifications) : they are not to be used for shipping navigation (IMO SOLAS), but only for recreative use, not as a primary tool for navigation.
Effectively, in contrast to the use in ECDIS, there is no possibility -today with the W4D/SailGrib current version- to ask for text info and details regarding any navigational objects (beacon, buoy, marks...).
 
View of Buenos Aires harbor with RNC chart
 
View of Buenos Aires harbor with ENC chart
 

China unveils a new unmanned warship, the "Killer Whale"

 
Via Chinese social media

From Maritime Executive

An unusual trimaran drone ship was spotted at Guangzhou Shipyard earlier this year, and it has now made its first public appearance. On Friday, at the Zhuhai Airshow, the PLA Navy unveiled a new surface combatant called the "Killer Whale" - a miniature warship with an operating concept much like the U.S. Navy's Independence-class Littoral Combat Ship, but smaller and potentially without crew.

According to Chinese media, the vessel has a length of 190 feet and displaces about 300-500 tonnes, with a maximum speed of 40 knots and a range of about 4,000 nautical miles. It is reportedly fitted to carry a wide array of weaponry - antiship missiles, antiaircraft missiles, torpedoes, and a drone helicopter on the rear deck. 


Its most notable feature might be the resuscitation of the "modular mission package" concept, which first entered full-scale service with the debut of the Littoral Combat Ship in the 2010s. The underlying concept was to field a multipurpose vessel that could carry "swappable" weapons packages for different missions - mine warfare, antisubmarine warfare and surface warfare. In practice, the U.S. Navy was not able to develop or operationalize the "swappable" concept aboard its two LCS classes, and each LCS vessel is now permanently fitted with specific equipment.

According to local media, the new Killer Whale's mission sets include surveillance patrols, surface warfare, anti-submarine operations, and air defense missions. It can be reconfigured for "sea battlefield environment surveys and rescue in distress," making it an "all-around warrior."


Though designed by CSSC's autonomous vessel specialists and designated as unmanned, the new USV also has a prominent wraparound bridge deck for human watchstanders. Naval analysts have noted that it bears a striking resemblance to Indonesia's manned Klewang-class fast attack craft: The carbon fiber Klewang-class is longer, narrower, and has less range and payload, but has a comparable top speed and a superficially similar appearance.
 
  • Illustrations and scale models of the Killer Whale's design have appeared at Chinese defense trade shows over the past two years under the program name "JARI-USV-A." Open-source intelligence analysts first spotted the full-sizgoog_535963585e prototype in satellite imagery at CSSC Guangzhou Shipyard last month.


Links :

Monday, December 16, 2024

Arctic tundra is now emitting more carbon than it absorbs, US agency says


From The Guardian by Dharna Noor

Drastic shift driven by frequent wildfires, pushing surface air temperatures to second-warmest on record since 1900

The Arctic tundra is undergoing a dramatic transformation, driven by frequent wildfires that are turning it into a net source of carbon dioxide emissions after millennia of acting as a carbon sink, the US National Oceanic and Atmospheric Administration (Noaa) said on Tuesday.

This drastic shift is detailed in Noaa’s 2024 Arctic Report Card, which revealed that annual surface air temperatures in the Arctic this year were the second-warmest on record since 1900.

“Our observations now show that the Arctic tundra, which is experiencing warming and increased wildfire, is now emitting more carbon than it stores, which will worsen climate change impacts,” said Rick Spinrad, a Noaa administrator.

NOAA Arctic Report Card: Update for 2024 - Tracking recent environmental changes, with 12 essays prepared by an international team of 97 researchers from 11 different countries and an independent peer review organized by the Arctic Monitoring and Assessment Programme of the Arctic Council.
In the ocean :
In September 2024, the extent of Arctic sea ice, which has a profound influence on the polar environment, was the sixth-lowest in the 45-year satellite record.
All 18 of the lowest September minimum ice extents have occurred in the last 18 years.
Arctic Ocean regions that were ice-free in August have been warming at a rate of 0.5 degrees F (0.3 degrees C) per decade since 1982.
In most of the shallow seas that ring the Arctic Ocean, August mean sea surface temperatures were 3.6–7.2 degrees F (2–4 degrees C) warmer than 1991-2020 averages, while the Chukchi Sea were 1.8–7.2 degrees F (1–4 degrees C) cooler than average.
Plankton blooms — the base of the marine food chain — continue to increase in all Arctic regions, except for the Pacific Arctic, throughout the observational record of 2003–2024. However, in 2024, lower-than-average values were dominant across much of the Arctic.
Ice seal populations remain healthy in the Pacific Arctic, though their diets are shifting from Arctic cod to saffron cod with warming waters. 
 
The report, led by scientists from the Woodwell Climate Research Center in Falmouth, Massachusetts, found that the Arctic is warming faster than the global average for the 11th year in a row.

Currently, it is warming at up to four times the global rate, the authors found.

Climate warming has dual effects on the Arctic.
While it stimulates plant productivity and growth, which remove carbon dioxide from the atmosphere, it also leads to increased surface air temperatures that cause permafrost to thaw.

When permafrost thaws, carbon trapped in the frozen soil is decomposed by microbes and released into the atmosphere as carbon dioxide and methane, two potent greenhouse gases.

“We need accurate, holistic and comprehensive knowledge of how climate changes will affect the amount of carbon the Arctic is taking up and storing, and how much it’s releasing back into the atmosphere, in order to effectively address this crisis,” said Dr Sue Natali, a scientist at the Woodwell Center who contributed to the research.
“This report represents a critical step toward quantifying these emissions at scale.”

Human-caused climate change is also intensifying high-latitude wildfires, which have increased in burned area, intensity and associated carbon emissions.

Wildfires not only combust vegetation and soil organic matter, releasing carbon into the atmosphere, but they also strip away insulating soil layers, accelerating long-term permafrost thaw and its associated carbon emissions.


“In recent years, we’ve seen how increasing fire activity from climate change threatens both communities and the carbon stored in permafrost, but now we’re beginning to be able to measure the cumulative impact to the atmosphere, and it’s significant,” said Dr Brendan Rogers, Woodwell Climate scientist and report contributor.

Since 2003, circumpolar wildfire emissions have averaged 207m tons of carbon annually, according to Noaa.
At the same time, Arctic terrestrial ecosystems have remained a consistent source of methane.

“The climate catastrophe we’re seeing in the Arctic is already bringing consequences for communities around the world,” said Brenda Ekwurzel, a climate scientist at the Union of Concerned Scientists.

“The alarming harbinger of a net carbon source being unleashed sooner rather than later doesn’t bode well.
Once reached, many of these thresholds of adverse impacts on ecosystems cannot be reversed.”
 
Links :

Sunday, December 15, 2024

Eden's whale's incredible new hunting technique helps survival


As agricultural pollution suffocates the ocean, Eden's whales have had to adjust their hunting methods. This adaptation highlights the urgent need for all species to evolve quickly in a world where our actions are rapidly altering their habitats.

Saturday, December 14, 2024

Image of the week : a sea of seas


The region shown in this image includes several full and partial seas.
At top is the southern Black Sea, with high chlorophyll responsible for beautiful teal colors.
The Sea of Marmara, Thracian Sea, Aegean Sea, and Sea of Crete lie between the countries of Greece and Turkey.. 
At bottom is the eastern Mediterranean Sea, which is partially obscured by dust blowing off the African continent. 

Friday, December 13, 2024

Led lights on underside of surfboards may deter great white shark attacks


From The Guardian by Donna Lu

LED lights on underside of surfboards may deter great white shark attacks

Australian-led study using seal-shaped decoys finds lighting disrupts ability of predators to see silhouettes against sunlight above


Using LED lighting on the underside of surfboards or kayaks could deter great white shark attacks, new research suggests.

In an Australian-led study using seal-shaped decoys, underside lighting disrupted the ability of great whites to see silhouettes against the sunlight above, reducing the rates at which the sharks followed and attacked the artificial prey. 
The brighter the lights, the more effective the deterrent was.

The study’s lead author, Dr Laura Ryan of Macquarie University in Sydney, said white sharks seemed to rely on the visual cues of a dark object silhouetted against a lighter background.
“If you flip that to a light object on a dark background, then it doesn’t seem to be something they recognise as prey,” she said.

Ryan’s previous research on great whites suggests that attacks on humans may be a case of mistaken identity.
The animal has a far lower visual acuity – the ability to see shapes and details – than humans.

Her work has suggested that juvenile great white sharks, from below, are unlikely to be able to clearly tell seals apart from swimmers or people paddling surfboards.

 
A great white shark breaches to bite a seal decoy in Mossel Bay, South Africa.
Photograph: Nathan Hart/Macquarie University

Other research has shown that sharks are colour-blind or at best have only limited colour perception abilities.

The new study, conducted in Mossel Bay, South Africa, involved towing decoys behind a boat for dozens of hours.

The researchers initially found success by covering the underside of the decoy entirely in lights. 
“But if you’re actually going to come up with something to protect people, [entirely] covering a surfboard … is just not practical because it’s a huge amount of lighting, which needs a huge amount of battery power,” Ryan said.

The researchers experimented with more sparse lighting options, finding that horizontal stripes of LED lights had a similar deterrent effect. 
“When you do horizontal stripes, the silhouette [appears] wider than it is long, so it’s less like a seal,” Ryan said.

Longitudinal strips of light, however, were not effective, nor were strobe lights, which gave the sharks momentary glimpses of the decoy silhouette. 
“Interestingly, just that small glimpse of the entire silhouette was enough for the white sharks to start biting the decoys,” Ryan said.

The scientists towed the seal decoy to encourage the white sharks to breach – one form of hunting involving rapid acceleration to the surface to catch prey. 
They say more research is required into shark behaviour with static decoys, which would resemble surfers waiting to catch a wave rather than actively paddling.

The team is testing a surfboard prototype with fitted lighting. “Surfers can be a little bit fussy with their surfboards,” Ryan said. 
“As a surfer, I want it to be usable.”

Globally, most shark bites are associated with people surfing or taking part in other board sports. 
Fatal shark bites, though rare, are mostly due to great whites.

The study, published in the journal Current Biology, noted it would be important to test whether lighting was also effective in deterring other speciesthat attack humans, including bull sharks and tiger sharks, as these have different predation behaviours.

Links :

Thursday, December 12, 2024

Bay of Plenty: digger that went overboard shows up in seabed survey


Image of the digger mapped on the Bay of Plenty seabed. Image/ LINZ/Discovery Marine Ltd.

From Bay of Plenty Times by Rosalie Liddle Crawford 
 
Shipwrecks and other potential threats to navigation off the Bay of Plenty coast are being captured in a hydrographic survey of the seabed.

Among things detected by experts from Toitū Te Whenua Land Information New Zealand (Linz) is a large digger, believed to have fallen off a barge travelling between Maketu and Motiti Island more than 15 years ago.

The discovery was made by contractor Discovery Marine Ltd, which was conducting the survey.

The 4m tall digger is sitting upright in 12m of water, with the top of the digger 8m below the surface.

A Linz spokesperson said the high-resolution images captured by the survey team showed the digger seemingly undisturbed for over a decade.

“It’s great to see it in such detail after all this time.”

This discovery is part of a larger, ongoing hydrographic survey that aims to update nautical charts and improve safety for mariners navigating the waters of the Bay of Plenty.

The survey is being conducted to capture a wide range of underwater features, including shipwrecks, rocks, and other natural formations that could pose hazards to navigation.

Survey boat MV Tranquil Image conducts surveys of the seafloor. 
Photo/Discovery Marine Ltd.

Linz officials said while the digger might not pose an immediate risk, its discovery highlighted the importance of surveying the seafloor to ensure that charts remained current and accurate.

The survey began in early November and will continue into 2025. Using advanced multi-beam echosounder technology, the survey boat MV Tranquil Image scans the seafloor, collecting data to generate detailed 3D images.

These images will then be used to update New Zealand’s nautical charts, which are crucial for the safe navigation of commercial ships, recreational boaters, and other marine vessels.

“This work is essential for ensuring the safety of mariners who navigate these waters, whether they are local fishermen or large shipping vessels,” said Annette Wilkinson, senior hydrographic surveyor at Linz.

“We’re also capturing valuable data that can be used for scientific research, like tsunami modelling and marine resource management.”

Image of the digger mapped on the Bay of Plenty seabed. Image/ LINZ/Discovery Marine Ltd.

The data will help build a clearer picture of the underwater environment, enabling safer routes for ships to follow as they approach ports and wharves in the Bay of Plenty.

As part of this project, Linz is also gathering data on the shape of the seafloor, which can be important for various scientific endeavours, including understanding how the coastline and marine ecosystems might respond to natural events like tsunamis.

A second survey vessel, the Tupaia, will map the shallower waters off Ōpōtiki in early 2025.

The survey work is being carried out in two phases: the first focusing on the offshore areas around Tauranga and Whakatāne, and the second concentrating on the shallower waters closer to shore.

Once the data from the survey is processed, it will be made available to the public via the Linz Data Service.

This will allow not only mariners to access the updated charts but also researchers, planners, and conservationists to use the data for various environmental and scientific purposes.

The survey also fills in important data gaps and helps improve the resolution of existing nautical charts, which is particularly useful for areas with heavy marine traffic.

“The more accurate and up-to-date the charts are, the better-equipped mariners are to navigate safely and avoid underwater hazards,” Wilkinson said.
 
Map showing digger location in the Bay of Plenty. 
Visualization with the GeoGarage platform (Linz nautical raster chert)

The data collected from this survey will also support the development of tools for managing New Zealand’s marine resources and improving our understanding of the seafloor.

Linz said these 3D models would be particularly helpful in marine conservation, providing a more detailed understanding of the habitat and the types of underwater features that might be significant for marine life.

Linz has also encouraged the public to keep an eye out for the survey boats operating in the Bay of Plenty over the summer.

“If you see the survey boats out on the water, give them a wave from us,” said the spokesperson, highlighting the importance of public awareness and support for the surveying effort.

Survey boat MV Tranquil Image coming into Whakatāne Harbour. Photo/Annette Wilkinson/LINZ

The updated nautical charts will eventually be available for free via the New Zealand Electronic Navigational Chart (NZENC) Service.
 
Links :

Wednesday, December 11, 2024

Coast Guard icebreaker finds small, uncharted seamount in Beaufort Sea

New data is used to map a volcano-like feature discovered this fall by science teams aboard the U.S. Coast Guard Cutter Healy, a polar-class icebreaker used for Arctic research.
The scientists found the structure on the continental slope off northern Alaska.
It rises from the seabed about 585 meters, but it is at least 1,600 meters below the sea surface, according to the scientists. 
The discovery was made during the first phase of a project to better map the Chukchi and Beaufort Seas north of Alaska along a corridor that the Coast Guard is proposing as a preferred shipping route between Utqiaġvik and the U.S.-Canada maritime border in the Beaufort Sea.
(Image provided by the National Oceanic and Atmospheric Administration)

From Maritime Executive

While under way off the coast of Alaska on a survey mission, the U.S. Coast Guard cutter USCGC Healy and an embarked science party found a previously-uncharted volcano-like feature, like a small seamount.

USCGC Healy finished up a repair period in Seattle on October 1 and got under way for a rare late-season Arctic deployment. 
Her first mission was to deploy oceanographic buoys and conduct surveys along a portion of the Coast Guard's proposed Alaskan Arctic Coast Port Access Route Study corridor, a planned route connecting the village of Utqiagvik on Alaska's North Slope to the U.S.-Canadian border demarcation in the Beaufort Sea.


During the first phase of the survey, Healy's sonar revealed a volcano-like feature about 585 meters tall protruding from the seabed, with a minimum depth below the surface of about 1,600 meters. 
The science party also detected signs of what may be a gas plume rising from the feature - a common feature for volcanic seamounts.

The area has very little marine traffic, and it was only lightly surveyed in decades past. 
Many parts of the Arctic lack detailed bathymetric charts, and the new surveyed routes are intended to ensure safe navigation for deep-draft shipping. 
"These findings are exciting and offer insight into what may exist beneath the ocean's surface, much of which is unknown in this region," said Capt. Meghan McGovern, the commanding officer of NOAA survey ship Fairweather and a member of the Healy's mapping team. 

U.S. Coast Guard Cutter Healy crewmembers retrieve a measuring instrument from the Chukchi Sea on Oct. 30, 2024. 
(Image credit: U.S. Coast Guard photo by Senior Chief Petty Officer Matt Masaschi)
 
A NOAA team from Fairweather is embarked aboard Healy to add hydrographic survey expertise for the mission. 
They are using the icebreaker's multibeam sonar to produce detailed, precise measurements of the seabed along the proposed deep-draft shipping route.

After completing the first elements of the mission, Healy returned south through the Bering Strait and called at Dutch Harbor.
In a statement, the Coast Guard said that her mission continues. 

The U.S. Coast Guard Cutter Healy maneuvers off the coast of Nome on Oct. 24.
(Photo by Senior Chief Petty Officer Matt Masaschi/U.S. Coast Guard)
 
Healy sustained a fire in a transformer room on July 25 while operating off of Banks Island, near the western entrance to the Northwest Passage. 
While her propulsion remained functional, as a precautionary measure she returned to Seattle early, arriving August 16. She got back under way once more on October 1.

Healy is one of the Coast Guard's two seagoing icebreakers, along with the 1976-built USCGC Polar Star.

Links :