Researchers from several institutions, including Rutgers University, Princeton and Harvard, worked with Climate Central to create an interactive map which illustrates sea level projections in cities across the globe.
The map provides projections that both include and exclude the new Antarctic research.
Local rises would vary from region to region under the same scenario and would exceed the global average for all US Gulf and Atlantic coast locations, according to the report.
The study ‘Evolving Understanding of Antarctic Ice-Sheet Physics and Ambiguity in Probabilistic Sea-Level Projections’ is the first to integrate Antarctic models into sea-level projections.
From Ars Technica by Scott K. Johnson
These sea-level rise scenarios aren’t new, but they are food for thought.
Sea-level rise is one of the more challenging effects of climate change to project.
It’s not that the direction of the change is unclear—sea level will rise as the planet warms—but it’s extraordinarily difficult to know when which sections of which glaciers will slide into the sea.
Many factors are involved besides temperatures, including ocean currents and the topography of the bedrock below ice sheets.
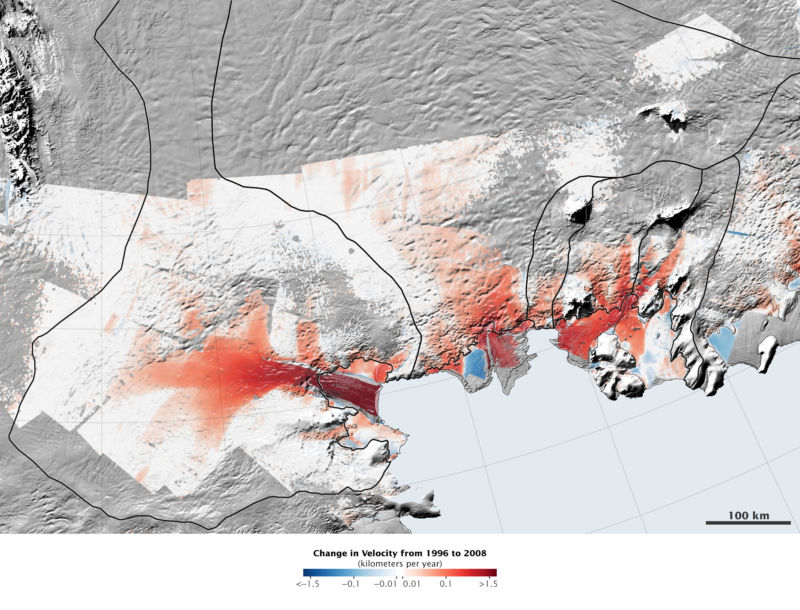
The flow of glaciers into the sea has accelerated in this vulnerable area of the West Antarctic Ice Sheet along the Amundsen Sea.
As a result, the projections of sea-level rise presented to entities like the Intergovernmental Panel on Climate Change (IPCC) have been heavily caveated and have changed significantly over time.
The 2013 IPCC report, for example, projected considerably higher sea-level rise than the 2007 report, which explained that it was leaving out important ice-sheet processes that needed more research.
And the recent 2017 US National Climate Assessment again increased projections of sea-level rise based on the current state of the science.
A new study from a group of researchers led by Rutgers’ Bob Kopp has made for splashy headlines in recent days, some of which claimed the study showed that sea-level rise will be “worse than thought” or that the study confidently predicted how many people would be inundated by rising seas this century.
Neither description is really true, as there is nothing new about the sea-level rise scenarios shown.
In fact, Kopp also helped put together the sea-level chapter of the US National Climate Assessment, and the numbers in the new study obviously match those in the report.
That doesn’t mean the study from Kopp et al. isn’t notable and interesting.
It relates to something the scientific community has been wrestling with for the last couple of years—a pair of studies using an improved ice-sheet model that simulated much faster ice loss from the vulnerable West Antarctic Ice Sheet.
While this simulation was more compatible with recent research in Antarctica, it’s not easy to fold the model’s alarming first results—which are not the final word—into the existing outlook.
Partly because ice-sheet models have not reached the point where researchers feel they accurately represent everything we know, several past efforts have produced a hybrid sort of projection incorporating detailed surveys of experts in the field.
This new study takes a hybrid projection like that from 2014 and replaces the Antarctic ice-loss estimates with the alarming model simulations to find out what the implications would be.
The answers are more interesting (and wonky) than “sea-level rise goes higher.”
But yes, the new study definitely does increase the estimated future sea-level rise.
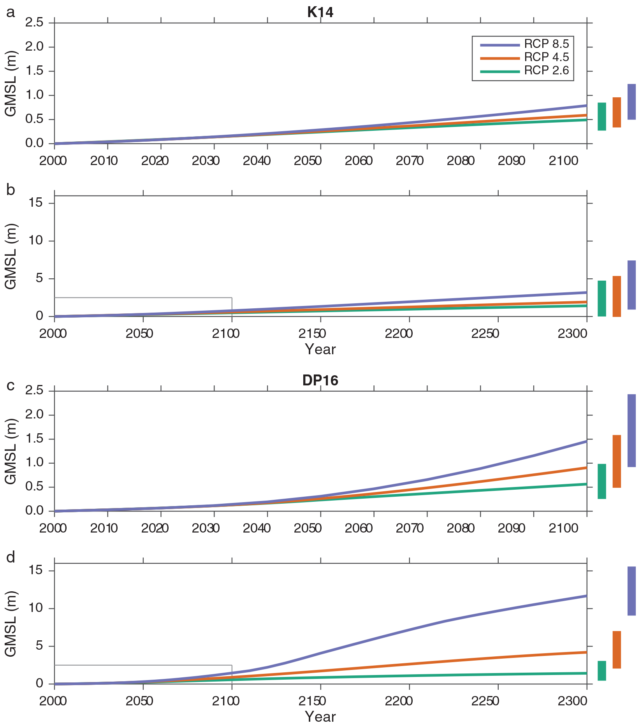
The top two graphs show sea-level projections for three emissions scenarios from a 2014 study.
The bottom two graphs update those projections with recent model simulations of vulnerable Antarctic glaciers.
In the high greenhouse-gas emissions scenario, the 2014 projection estimated about 0.5 to 1.25 meters of sea-level rise by 2100, whereas this new version shows 0.9 to almost 2.5 meters.
(For reference, the 2013 IPCC report projected about 0.5 to 1 meter, and the new 2017 US National Climate Assessment put it in the neighborhood of 1 to 2.5 meters using a different scenario scheme.)
Once you move past 2100, the scenarios diverge in a big way. By 2300, the difference in sea level between the low and high emissions scenarios grows to more than 10 meters.
Once ice sheets become destabilized, they keep raising sea levels for a long, long time—our actions this century can shape the world for many centuries to come.
Beyond that, here’s what the study really reveals: in this century, the biggest variable controlling how much sea-level rise we get is the behavior of Antarctic ice.
We don’t know whether to expect the high end or the low end of the range of projections, even assuming we follow the high emissions path.
And because the situation can change in Antarctica in a matter of decades, we can’t really know what will happen in the second half of the 21st century based on what we see in the first half.
The model simulations with the highest rate of sea-level rise in 2100 weren’t necessarily those with the highest rate in the 2020s.
The lesson, the researchers write, is that “this means that ‘extreme’ future scenarios need to be considered even if they overestimate current rates of sea-level rise.”
Again, the researchers emphasize that these model simulations of higher sea-level rise provide a realistic “worst-case scenario” more than they predict the most likely outcome.
But because the real possibility of a worst-case scenario isn’t likely to be ruled out any time soon, planning should account for an uncertain future.
To add some more meaning to these numbers, the researchers calculated the present population living in areas that could become inundated by sea-level rise in 2100.
Even in the lowest emissions scenario (where global warming is limited to about 1 degree Celsius beyond current temperatures), that includes at least 75 million people worldwide.
In the high emissions scenario, the “worst-case” pushes that number as high as 235 million.
The difference between these two future worlds is far from academic.
Links :
- ArsTechnica (2016) : New model shows Antarctica alone could raise sea level a meter by 2100
- Eco Watch : New Research Confirms 'Catastrophic' Climate Threat: Global Sea Levels could rise 174 feet from melting East Antarctic Ice sheet
- National Geographic : East Antarctic Ice Has a Wild Past. It May Be a Harbinger
- DailyMail : Climate change activists used 'arbitrary' adjustments to exaggerate sea level rise, scientists claim
- Wired : Sea Level Rise Will Imperil Humanity's Future and Its Past
- GeoGarage blog : Antarctica's warm underbelly revealed / Scientists warn of 'giant leap backward' at climate talks /From Miami to Shanghai : 3C of warming will leave world cities below sea level /New Greenland maps show more glaciers at risk /New science suggests the ocean could rise more — and faster — than we thought /Greenland’s coasts are growing as seas rise /


No comments:
Post a Comment