
Gravity data and constraints for the inversion. (A) AntGG2021 free-air gravity anomalies color coded from −150 mGal (1 Gal = 1 m/) to +150 mGal with location of MBES/SBES from6. (B) Geographic names and ocean temperature at 310-m depth from the Southern Ocean State Estimate (SOSE) model61color-coded from cold (C, blue) to warm (C, red). White areas are less than 310 m depth. Ice shelves are light blue. Bed beneath grounded ice is black if below sea level, grey otherwise. Zoom in on (C) English and (D) George V Coasts with bathymetry from MEOP41 in pink and IBCSOv2 or seismic in black. (E) Standard deviation map of free-air gravity anomalies from AntGG2021. The map is color coded from 1.5 mGal (blue) to +15.5 mGal (yellow). Standard deviations of 15 mGal indicates regions that are not covered by terrestrial gravity measurements.
Around the edges of the Antarctic ice sheet, glaciers flow into the ocean to form long floating ice shelves, which regulate the flow of ice that the ice sheet discharges into the ocean.
The increased mass loss of the Antarctic ice sheet has been attributed to the significant weakening of these floating shelves.
This weakening originates from the advection of warm, salty circumpolar waters onto the continental shelf.
These waters are then channeled beneath the shelves, where they erode the ice from below.
Although this process is well identified, the pathways of these warm waters from the abyssal plain to the grounding line remain unknown for most glaciers around the ice sheet.
This constitutes a major obstacle for models predicting the future evolution of the Antarctic ice sheet: if we do not have accurate maps of the seabed, then the models cannot correctly simulate the circulation of warm waters under the shelves, nor predict their melting appropriately.
The lack of precise measurements of the seabed topography is not accidental.
Indeed, field campaigns in this region are particularly complex and costly due to the isolation of Antarctica, extreme weather conditions, as well as the presence of icebergs and dense sea ice, which significantly limit the mobility of missions.
Moreover, the specificity of the ice shelves adds an additional difficulty: only autonomous submarines (or seismic measurements) are capable of conducting surveys there.
Thus, it is only at the cost of expensive missions that it is possible to cover tiny portions of the Antarctic seabed, although some vehicles sometimes never resurface.
However, there is an indirect method to measure the bathymetry of the seabed: the use of airborne gravimetry.
Since the gravimetric signal is proportional to the masses located beneath the gravimeter, it is possible to invert this signal and, under certain assumptions, map the bathymetry.
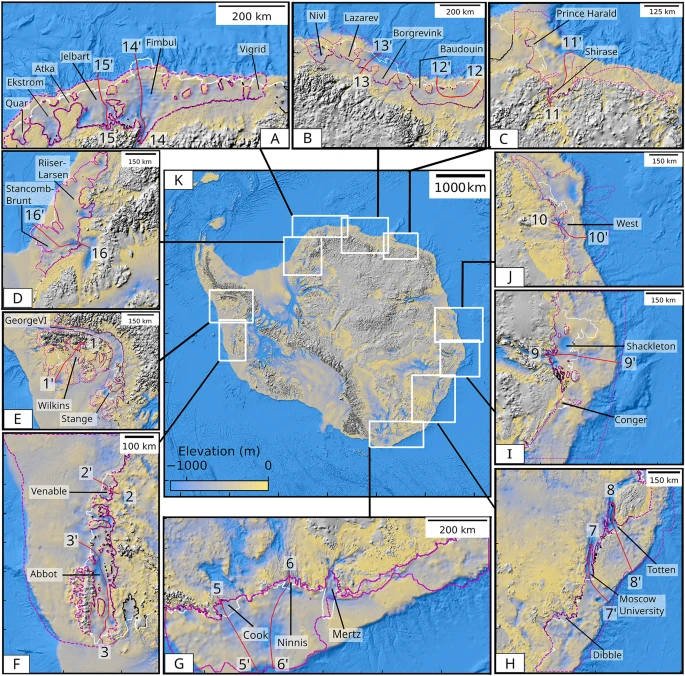
Bathymetry of Antarctica color coded from −1250 m (blue) to 0 m (yellow) with shaded relief for 10 regions: (A) Jebart and Fimbul (R19), (B) Borgrevink and Baudouin (R18), (C) Shirase (R17), (D) Brunt–Stancomb Wills (R20), (E) George VI (R3), (F) Abbot and Venable (R4), (G) Cook, Ninnis, Mertz (R11), (H) Moscow, Totten (R12), (I) Shackleton (R13) and (J) West (R14), with ice shelf boundary in white and inversion domains in purple.
Profiles shown in Fig. 3 are red. (K) Overview of the 10 sub-regions.
This approach, used by an international team including scientists from CNRS-INSU, although less accurate than direct measurements by ship, has the advantage of being conducted from an aircraft, thus allowing coverage of much larger areas.
The researchers used a unique archive of gravimetric measurements, assembled by collaborators from TU Dresden.
These data combine a wide variety of field campaigns conducted in Antarctica since the 1980s, both by aircraft, ship, but also on foot and from space.
The scientists thus collected an impressive amount of data from sonar measurements (ships), as well as CTD (Conductivity, Temperature, Depth) measurements and even probes placed on seals (see MEOP).
The results of this study reveal a new image of the Antarctic seabed.
For most of the still unknown regions, this mapping reveals seabeds with deep canyons under the shelves, but also on the continental shelf, which is the key to channeling warm waters from the abyssal plain to the glaciers.
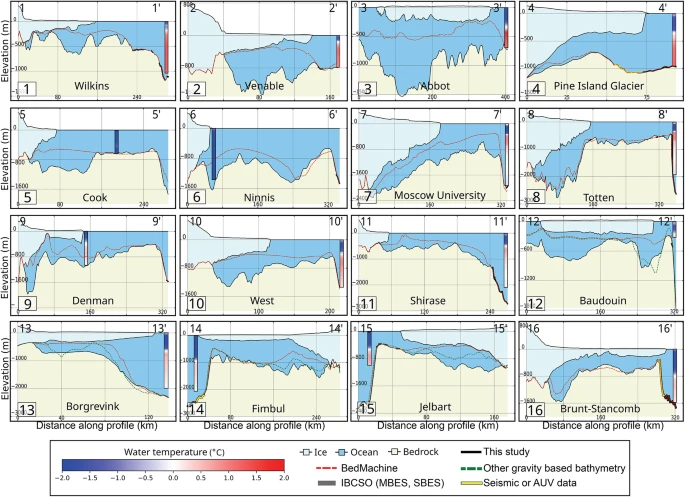
Comparison of AntGG2021 bathymetry with other data sources along specific profiles shown in Fig. 2 for 12 regions, and Pine Island Ice Shelf in Fig. S7e. Ice is light blue, ocean is blue, bedrock is light brown, IBCSOv2 is dotted red, new bathymetry is black, and observations are thick black. CTD observations are color coded from C to C, with geographic locations in Fig. S8.
The results of this study will enable better simulation of the circulation of warm waters around Antarctica and, consequently, better modeling of the evolution of this polar ice sheet and its impact on sea level.
They have also highlighted a critical lack of data, particularly in East Antarctica, an extremely vulnerable region with significant potential for sea level rise.
Links :
- Nature : Bathymetry of the Antarctic continental shelf and ice shelf cavities from circumpolar gravity anomalies and other data
- Maritime Executive : Spanish Expedition Finds Evidence for Methane Leaks in Antarctica
- Marine Isight : Scientists Detect Massive Methane Leaks In Antarctica, Raising Climate Concerns
No comments:
Post a Comment