Tuesday, November 9, 2021

Oil spill: How often should NOAA map ocean floor? Last look off Orange County was in 2013


The pipeline that leaked oil into the ocean off Orange County in early October 2021 may have been damaged in more than one incident, and as early as months ago, U.S. Coast Guard investigators said. (Photo from video taken by Petty Officer 1st Class Richard Brahm, U.S. Coast Guard)

From The OCR by Brooke Staggs

With a ship anchor suspected in the oil spill off Huntington Beach, and with record volumes of traffic in San Pedro Bay, some local leaders demand a new offshore survey.

More than four decades ago, Shell Oil Company submitted blueprints for a 17-mile-long pipeline to connect its oil processing platform off the coast of Huntington Beach with a pumping station at the Port of Long Beach.
The National Oceanic and Atmospheric Administration took Shell’s drawings and used them to add the pipeline to the nautical charts all vessels still use when navigating coastal waters.

The last time NOAA surveyed the waters off the coast of Southern California — to verify that the now 41-year-old pipeline and other possible hazards, including ocean depths, is accurate on nautical charts — was in 2013.
 
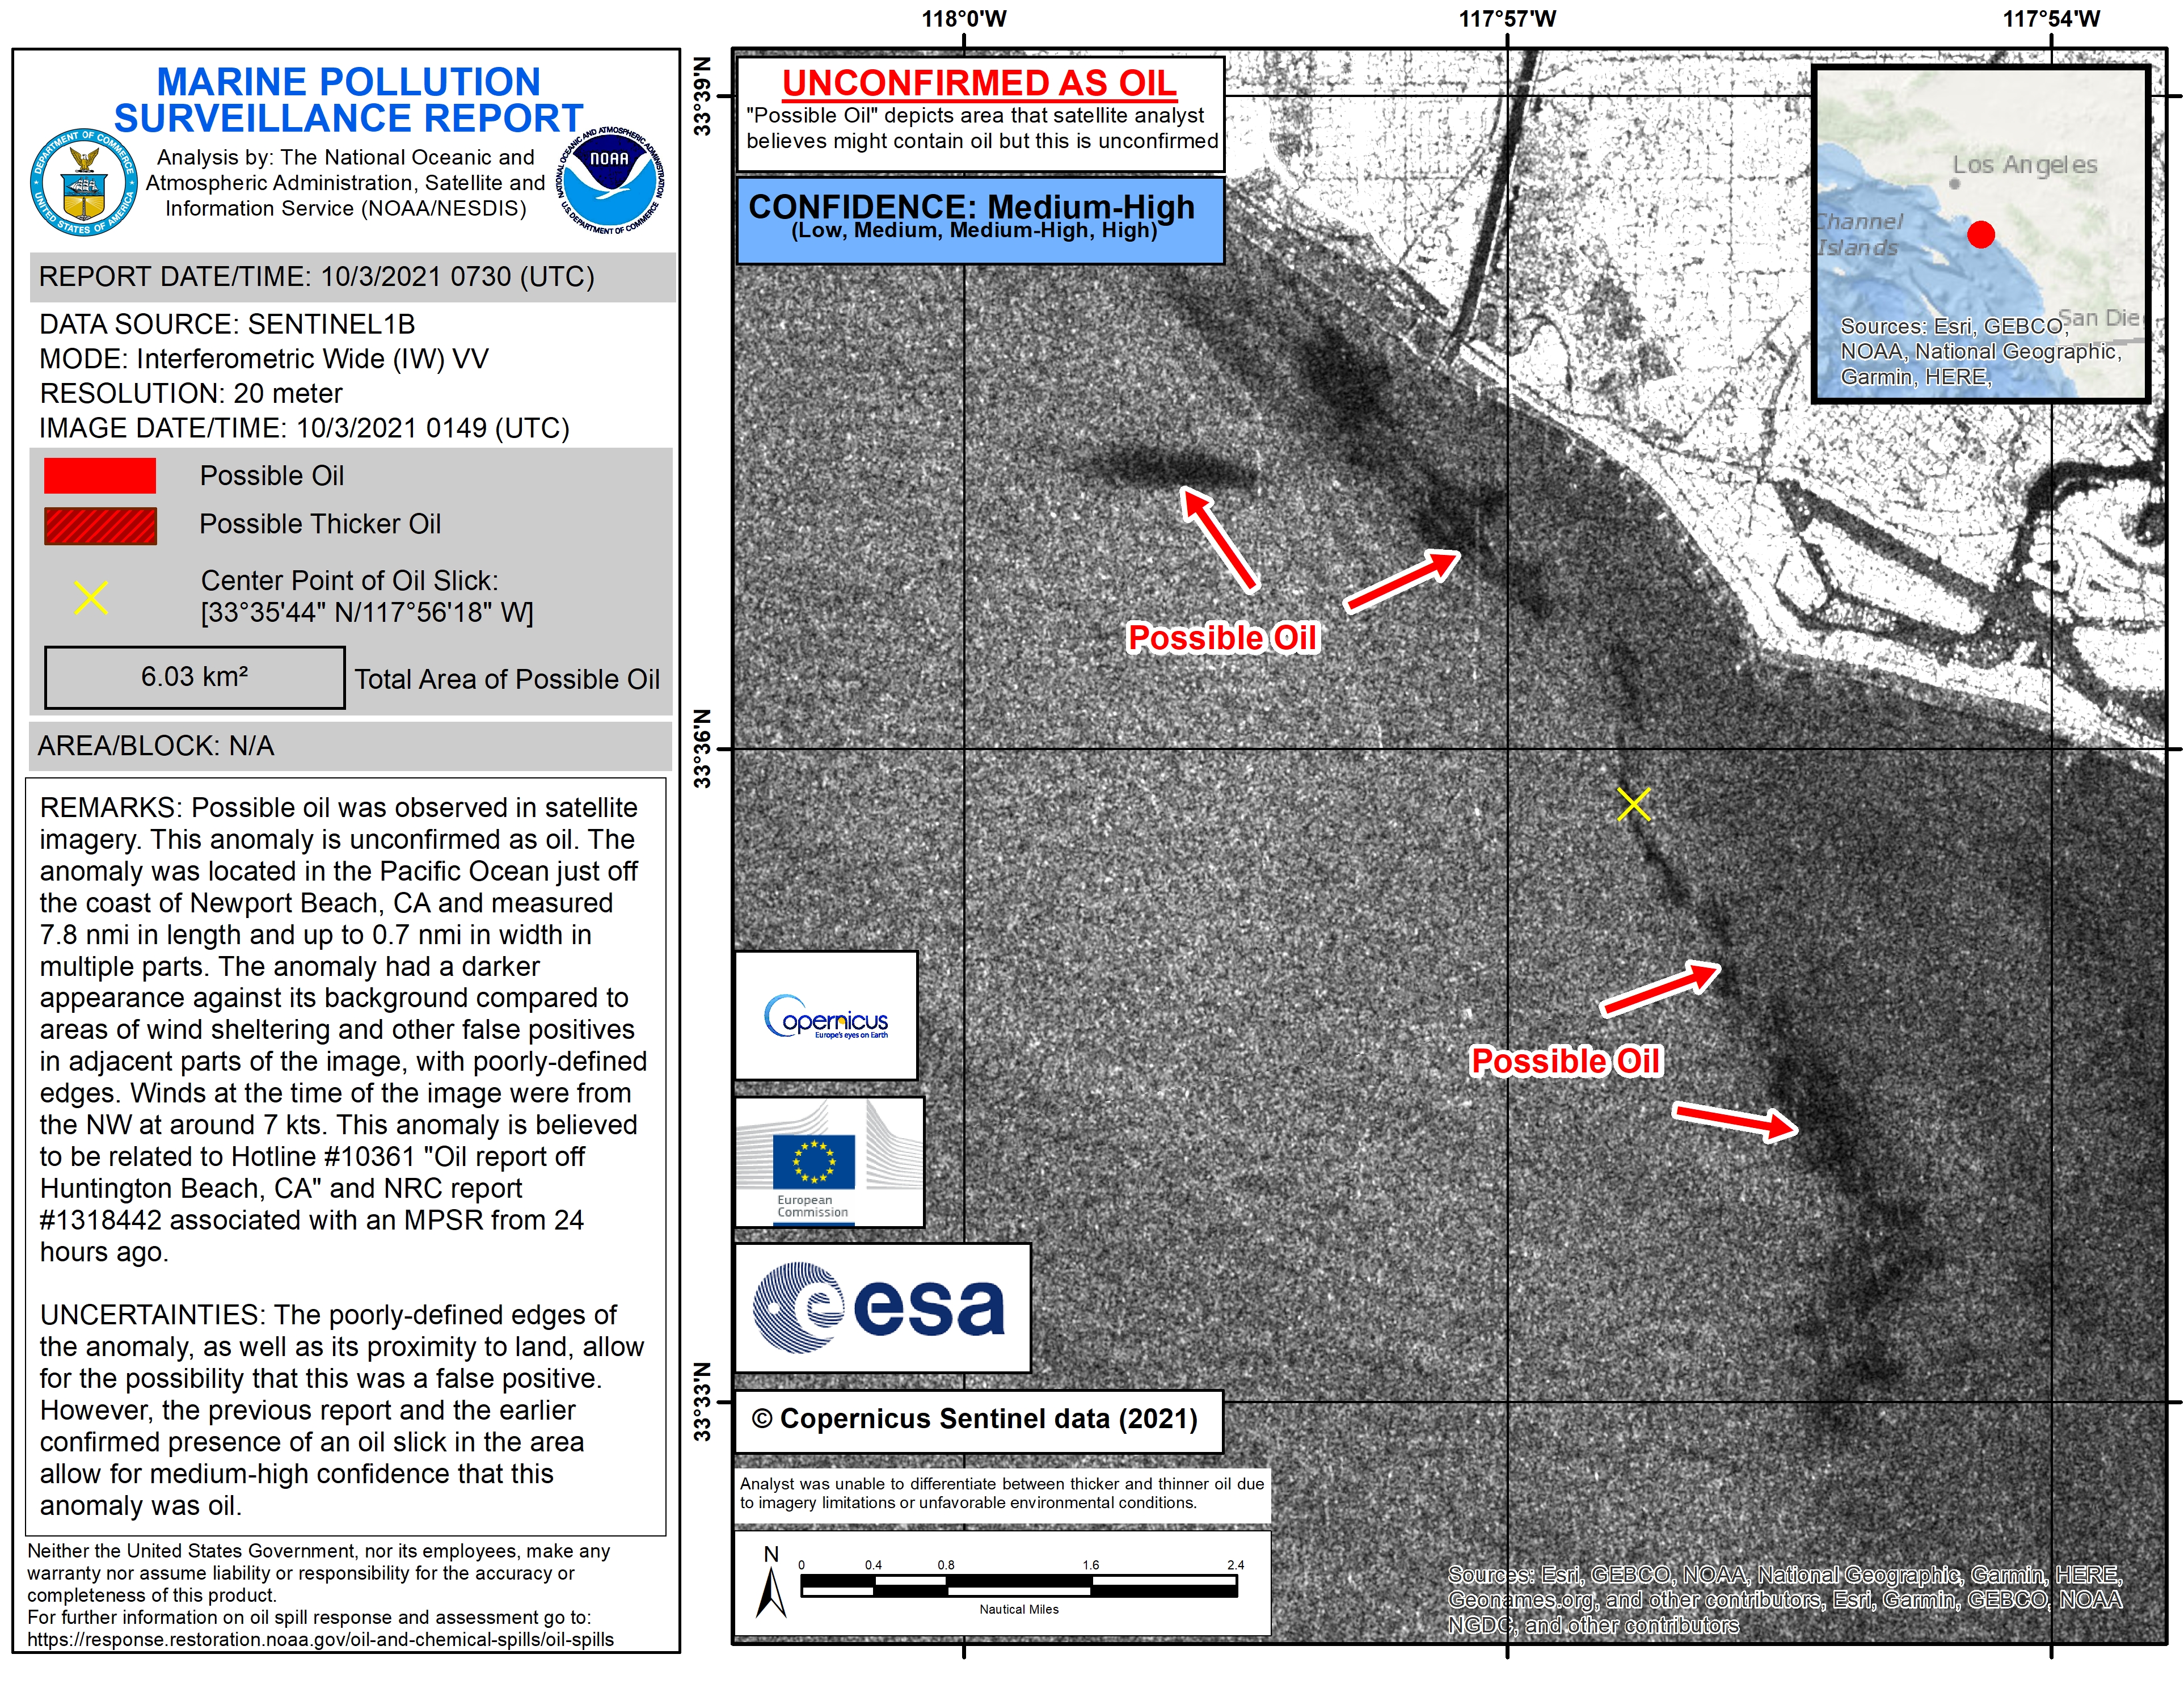
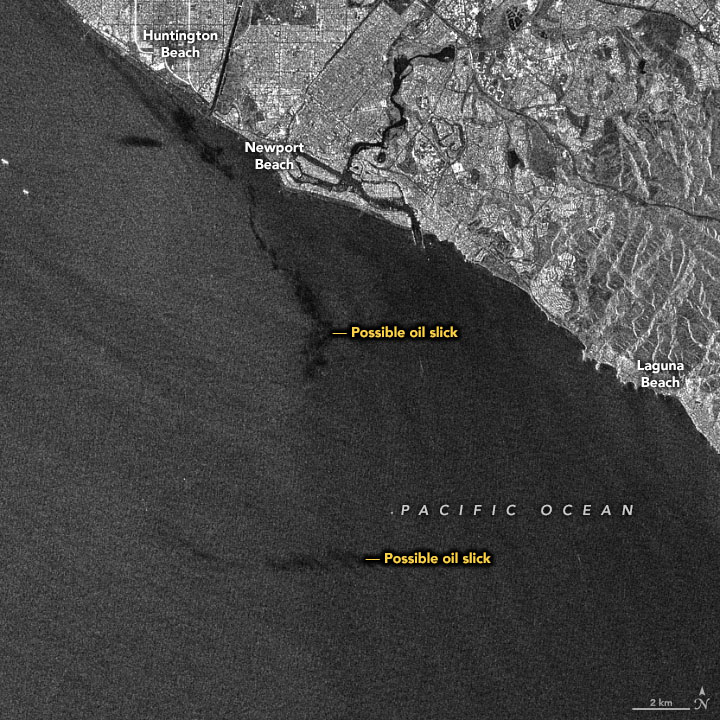
NASA/NOAA Marine Pollution Response Report, Sentinel 1B Imagery (October 3, 2021)

Since then, per NOAA, no surveys have been ordered and no changes have been made to the local nautical charts.

But initial U.S. Coast Guard investigations suggest that in January a ship’s anchor dragged Shell’s pipeline, now operated by a subsidiary of Amplify Energy, more than 100 feet, meaning that pipeline’s location isn’t listed accurately on any existing chart.
That event might have triggered damage that eventually caused the pipeline to rupture and spill an estimated 25,000 gallons into the ocean in early October.

There also are a record number of ships anchoring and loitering in the San Pedro Bay this year due to gridlock at the Ports of Long Beach and Los Angeles.
Those ships can’t all fit at approved anchorage spots.
They also move massive volumes of water as they come in and out of the bay — a phenomenon that according to James Fawcett, an environmental studies professor at USC who specializes in maritime policy, can shift enough sediment to change ocean depths.

That’s why Rep. Michelle Steel, R-Seal Beach, whose 48th District includes beaches most affected by the October oil spill, sent a letter Oct. 14 calling for NOAA and the Coast Guard to immediately survey waters off the coast of Orange County and make any necessary updates to nautical charts.
A bipartisan group of 10 state, county and local leaders, plus three coastal cities, signed on in support of Steel’s letter, which also asked for additional resources to address the effects of the oil spill.

“Any moment wasted is a moment too long if existing pipelines are mapped improperly or moved,” Steel said during an Oct. 22 hearing of the House Transportation and Infrastructure committee.

As of Friday, Steel’s office said they hadn’t yet received any response from NOAA or the Coast Guard.
 
Localization of the incident with the GeoGarage platfom (NOAA raster chart)

While the investigation into the cause of the spill continues, the incident has sparked debate about whether offshore waters should be surveyed more often, whether federal authorities are overly reliant on oil companies to self-report potential problems, and if larger buffers between pipelines and anchor spots are needed.
How do offshore pipelines, including the one that leaked off Huntington Beach last month, end up on nautical charts?
 

NOAA’s Office of Coast Survey uses final construction drawings from pipeline owners to add pipeline locations to navigation charts, according to the agency. NOAA regularly reviews permit requests submitted to the Bureau of Safety and Environmental Enforcement for new and modified pipelines, then updates charts based on drawings submitted by the pipeline owner.

During the Oct. 22 Transportation and Infrastructure hearing, Vice Admiral Scott Buschman with the U.S. Coast Guard said they confirmed that the pipeline that leaked in early October was included on nautical charts.
 

No pipeline location on NOAA ENC
 
Relying on oil companies to supply pipeline locations for nautical charts doesn’t worry Fawcett.

The process of installing pipelines is intricate, and requires the company to work with multiple federal agencies, the USC professor noted.
Plus, he said, pipelines are only allowed in areas believed to be safe from marine traffic and other hazards.
Pipeline owners don’t want to put them outside of safe zones because of the risk of potentially expensive damage.
Does anyone verify the location of those pipelines and check on them over time?

NOAA generally checks pipeline locations only when they lie within an area otherwise approved for a hydrographic survey, the agency said.

There is no set schedule for NOAA to conduct new surveys.
The agency’s Office of Coast Survey generally conducts them in response to requests when there’s heightened concern about risks due to issues such as dense traffic or reported ship groundings.
And they prioritize requests based on a variety of conditions, such as proximity to marine sanctuaries and what models show about likelihood of changes on the sea floor.

Everyone seems to agree that more frequent surveys would be helpful.
But the process is pricey, and so, under the Hydrographic Services Improvement Act of 1998, NOAA is required to get such data from the private sector “to the greatest extent practicable and cost-effective.”
Earlier this year — prior to the spill off Orange County — the agency announced a matching funds program to encourage private entities to help expand coastal survey efforts.

The last time NOAA surveyed the San Pedro Bay was in 2013 after the agency said it received requests “from the Port of Los Angeles, the Port of Long Beach and the pilots who maneuver increasing large oil tankers and cargo ships through the area’s crowded shipping lanes.”
Before that, a survey was conducted in 2010.

In 2013, the agency said NOAA Ship Fairweather confirmed the San Pedro Bay pipeline was charted in the location that matched the chart.
And NOAA said it recently reviewed charts off Orange County, comparing them with BSEE pipeline permits and hydrographic survey data from 2013, and said the pipelines have been accurately charted to current standards.

NOAA declined to say how much it would cost to conduct a new survey offshore Orange County, but estimated it would take 12 hours with three survey launches to complete.

But while NOAA surveys don’t happen often, Fawcett said pipelines and most other underwater hazards don’t typically move much, and anchor drags by large ships aren’t common.
He noted there also are other ways that authorities might still learn about a pipeline moving from its charted location.

“Generally — especially in this area, where there is a lot of marine traffic — there is a lot of underwater surveillance for one reason or another,” Fawcett said. With this pipeline on the surface of the ocean floor, he said, “You can see it on sonar if anybody is looking for it.”

Inspection is a separate issue.
Oil companies are required to inspect their pipelines on dictated schedules. In the case of the local line that ruptured, pipeline owner Amplify has alternated internal and external inspections annually, each no more than 13 months apart.
The last external inspection of the line was conducted in October 2020, perhaps three months before a ship struck the pipe and a full year before the rupture that caused the spill.
What happens if a pipeline moves?
How are maps updated?

If a pipeline is found to have moved from its original location during an NOAA survey, that new information is reported to the Bureau of Safety and Environmental Enforcement.
And “if the change poses a threat to navigational safety, NOAA will update its nautical chart.”

If an oil company or anyone else detects a change in the pipeline at any point, NOAA said the information should be reported to them and they’ll update electronic navigational charts of the area accordingly.

“We have not received new information that would indicate that the pipelines have moved,” NOAA told the Register last week.

“If a new survey is soon required,” NOAA said, “this would likely be done by the pipeline owner.”
The agency said it would then use that information provided by Amplify Energy to update its nautical charts.

But when asked about notifying NOAA of its moved pipeline, Amplify Energy spokesmen said the estimated 100 feet of movement is still well within a 200-foot-wide right-of-way federal authorities permitted in 1998, so they don’t believe the shift triggered reporting requirements.

The company, which already is the target of multiple lawsuits over the spill, also pointed out the responsibility ships face in these situations.
How do ships navigate around pipelines in coastal waters?
And are larger buffers needed?

All large vessels, like those waiting to enter the Ports of Los Angeles and Long Beach, are required to refer to electronic navigational charts maintained by NOAA that include pipeline locations.

When it comes to anchoring offshore, the Marine Exchange of Southern California assigns ships particular anchorage points that have long been designated as safe.
Ships are required to drop anchor — and, more importantly, volumes of heavy chain fixed to that anchor — in the dead center of these anchorage points, Fawcett explained.
The weight of the chain and anchor then allows the ship to drift only in a fixed circle and stay within the designated safety zone.

But with global supply chain issues this year creating delayed cargo traffic — and dozens of huge ships unable to get into local ports — some vessels have been directed to anchor in non-typical locations. That’s where accuracy of NOAA’s nautical maps becomes key, so everyone can be sure ships steer clear of pipelines and other hazards.

It’s not clear if there’s a specific fixed distance that’s required between oil pipelines and permitted anchorage points. Federal agencies didn’t respond to requests for that information.

Still, early investigations suggest it wasn’t a problem with nautical maps or anchor placement that might have triggered the October oil spill.
Instead, Coast Guard investigations suggest one or more ships dragged anchor during unusually strong winds in January, eventually moving a 4000-foot section of Amplify Energy’s pipeline out of place by 100 to 150 feet.
They believe that an anchor damaged a concrete casing around the pipe, which started leaking Oct. 1.

It’s not common for ships to drag anchor.
Fawcett said it generally only happens during strong winds. And ships are required to have a crew member on watch at all times and to quickly report incidents where they’ve dragged anchor and crossed into pipeline rights of way.

With those investigations ongoing, Fawcett said it’s tough to know whether larger buffers between anchor points and pipelines — or any other changes to maritime policy — could have prevented the spill.

“I suspect there will be recommendations once the reports come out,” he said. 
“But right now I think it’s premature.”

Links :

Monday, November 8, 2021

Why do in-flight maps show shipwrecks?

 
Five historical shipwrecks pepper the map of an American Airlines flight’s final approach to Philadelphia International. (Credit: Thomas Weber / Twitter)

From Big Think by Frank Jacobs

On long-haul flights, some airlines show shipwrecks on their in-flight maps.
The aim is to entertain; the result is often to horrify.

  • Some in-flight maps show the locations of famous shipwrecks.
  • The information is offered as education and entertainment, but some find it a bit morbid.
  • The company offering the info is phasing out the shipwrecks. Wrong move !

As his flight approached Philadelphia International Airport one September day in 2018, American Airline passenger Thomas Weber noticed something strange about the live map of his journey, and he tweeted this about it: “Dear American Air, are you including shipwreck locations on your in-flight locations to make your customers feel more at ease about the safety of international travel?”

The airline hastened to reply: “We always want you to have a relaxing trip, but we appreciate your feedback. Many customers find the historical sites interesting.”

Mr Weber, who is a historian himself, agreed: “My tweet was (merely) meant as a tongue in cheek comment,” he said.
But the five shipwrecks on the picture he included in his original tweet do raise a pertinent question: why?
 
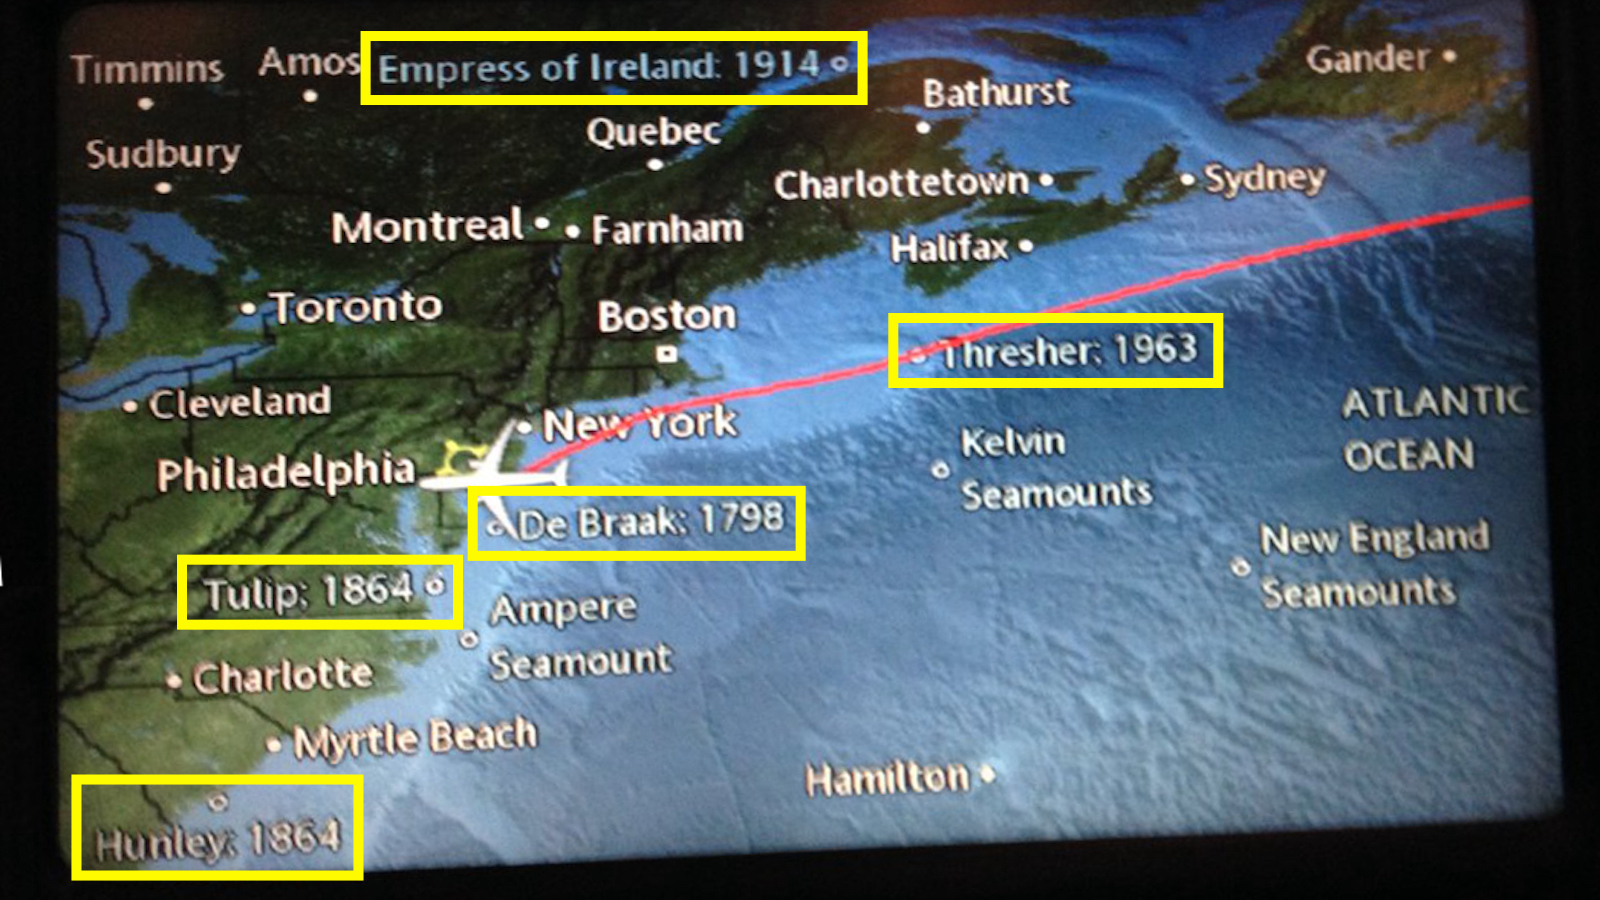
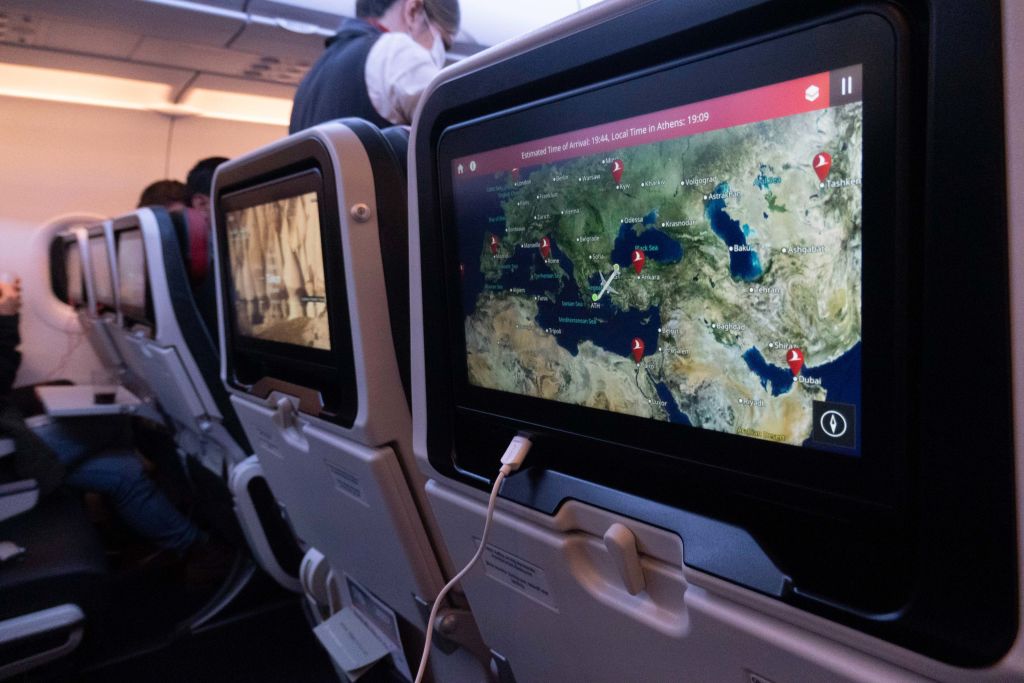
Seen all the movies, played all the games? Dynamic route maps offer another take on in-flight entertainment — especially if they include shipwreck locations.
(Credit: Nicolas Economou / NurPhoto via Getty Images)

Other air passengers too started tweeting pictures of in-flight maps showing the location (and sometimes also the date) of shipwrecks, some infamous enough to send a chill down anyone’s spine.

Like that dot halfway across the Atlantic, marked Titanic, 1912.
Or the RMS Lusitania, which someone saw popping up in the Atlantic just south of Ireland.
In 1915, a German U-boat sank that British ocean liner, killing almost 1,200 passengers and crew, including 128 Americans. The massacre was instrumental in turning U.S. public opinion in favor of the Allied cause in WWI.

All of which may be historically accurate and very educational, but it is also quite unnerving, remarked Wendy Fulton, as the flight tracker map on her Emirates flight pointed out the locations of the Thresherand Andrea Doria shipwrecks, among others. 
“This is deeply weird (…) Who wants to think about deadly transportation disasters during a flight?”
 
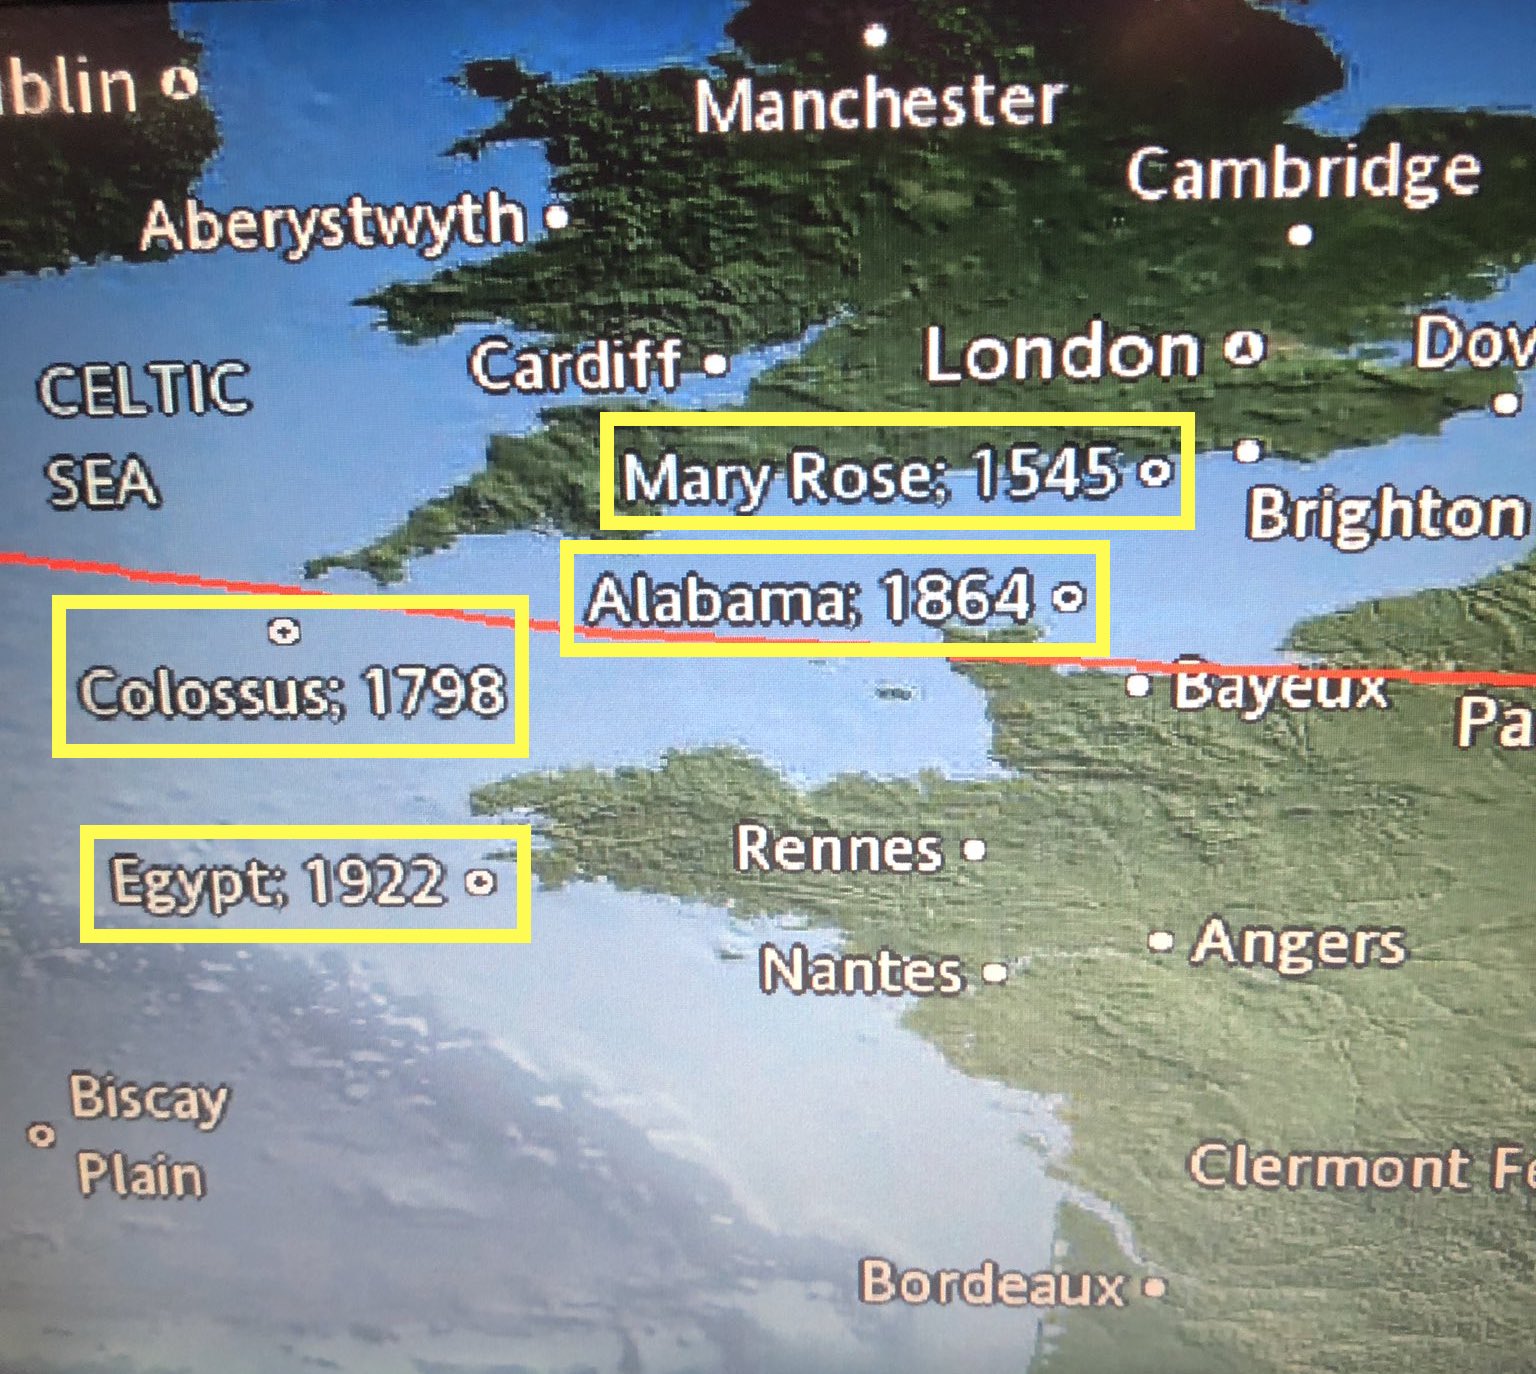
“This flight map shows the locations of famous shipwrecks in history and like… really not inspiring confidence here buddy.” (Credit: Laurel / Twitter)

Flying is safer than floating?

Soon after take-off, Florian Nicklaus, a passenger on a Swiss Air flight from JFK New York to Zürich, spotted the watery graves of the Thresherand the Titanic on his in-flight map.
“Pointing out these catastrophic events while being mid-air made me a bit uncomfortable. Or is this a way to reaffirm that flying is safer than crossing the Atlantic by ship?”

A map of shipwrecks as a not-so-subtle advertisement for the safety of air travel?
Sadly, we can’t test the obvious corollary of that theory.
If any of the old ocean liners were left today, would their on-board entertainment systems show dynamic maps that include the location of the world’s worst air disasters?

The shipwreck maps can be traced back to Collins Aerospace, one of the world’s largest suppliers of the aerospace and defense industries.
It supplies airlines with everything from airplane seats to biometric security systems, and it also produces Airshow, the software for those in-flight maps, including — if the airline wants — all those shipwrecks.

The reason, apparently, is an old and familiar one for cartographers: horror vacui.
On long, transatlantic flights, the vast emptiness of the ocean cries out to be filled with something, anything.
So instead of “Here be monsters,” they mention seamounts, ocean floor canyons, and other features of underwater geography.
Shipwrecks offer another means to keep in-flight map fans entertained and informed.

In a 2017 article in Condé Nast Traveller, a spokesman for Collins Aerospace (then still called Rockwell Collins) said the company is working to refine the information provided by Airshow, looking to add geological content and “moving away” from shipwrecks.

Wrong decision! The in-flight maps should go in the opposite direction and offer more information on the wrecks. Tragic histories, for sure; but they are great stories.
As proof, here are the nutshell histories of the five ships shown on Mr. Weber’s map.
 
 
The Hunley some time before its third and final sinking. The sub’s inventor is seen leaning against its rudder. (Credit: “Submarine Torpedo Boat H.L. Hunley, Dec. 6, 1863,” oil on panel, by Conrad Wise Chapman / Public domain)

De Braak (1798)

Built in Rotterdam in 1781, the Dutch cutter De Braak was seized by the Royal Navy when it sailed into the Cornish port of Falmouth, its crew unaware that the Netherlands had just become a client state of Napoleonic France.
During its short career in British service, it captured a Spanish vessel in the Atlantic, but it capsized and sank in Delaware Bay on May 25, 1798.
The inconsiderate salvaging efforts of this ship in the early 1980s contributed to the passage of the Abandoned Shipwrecks Act (1987) by the U.S. Congress, which laid down some rules for salvaging shipwrecks in American waters.

Hunley (1864)

The CSS H.L. Hunley was a Confederate submarine, at a time when they were new enough also to be known as “fish boats.
 During its short career toward the end of the Civil War, the Hunley was sunk no less than three times, with a loss of 21 crewmen in total, including its inventor, Horace Lawson Hunley. In its last action before its final disappearance, it sank the USS Housatonic, then blockading Charleston harbor.
This is the first time ever that a warship was sunk by a submarine.
The wreck of the Hunley was located only in 1995 and was raised in 2000.

Tulip (1864)

Built in New York in 1862 for service in China, the Zheijang was sold to the U.S. Navy instead. Renamed Tulip and fitted with heavy guns, it served several purposes during the Civil War: helping to maintain the Union’s blockade of Confederate ports, protecting the maritime connections between Washington, DC and other Union ports, and participating in naval attacks on the South.
On November 11, 1864, its defective starboard boiler exploded, instantly killing 47 crew.
Two of the ten survivors later also died of their injuries.

Empress of Ireland (1914)

Having learned from the Titanic disaster two years previously, the RMS Empress of Ireland had plenty of lifeboats when it sailed from Québec City to Liverpool on May 28, 1914.
One day later, in thick fog near the mouth of the St. Lawrence, it collided with a Norwegian collier.
It sank in just 14 minutes, too fast for most of the nearly 1,500 passengers and crew to reach those lifeboats.
More than 1,000 people died. It remains Canada’s worst peacetime marine disaster.

Thresher (1963)

Designed to hunt and destroy enemy subs, the nuclear-powered USS Thresher was the fastest, quietest, and most advanced submarine of its time. 
t sank on April 10, 1963 during training off Cape Cod, with the loss of all 129 crew and personnel aboard.
This is the second deadliest submarine disaster on record, after the sinking of the French sub Surcouf (killing 130 in 1942) but ahead of the Kursk disaster, which killed 119 Russian sailors in 2000.
Being lost at sea, the Thresher has not been decommissioned; it remains “on eternal patrol”.

Links :

Sunday, November 7, 2021

Le chant du large

Aurélien Ducroz onboard Crosscall
If solitude is often accompanied by silence,
the skippers' solitude is punctuated by the sounds that surround them.
Embark with them in a timeless sound universe.


Saturday, November 6, 2021

Building of the cruising ship 'Wonder of the Seas', Chantiers de l'Atlantique


On the occasion of her departure from Saint-Nazaire this Friday, November 5, discover in 12 minutes the construction of the Wonder of the Seas, the world's new largest cruise ship.
Ordered in December 2016 by the American shipowner Royal Caribbean Group, the C34 saw its first sheet officially cut in April 2019, with the ship's lay-up taking place in October 2019 and its launch in September 2020.
After successfully completing her sea trials at the end of August, the Wonder of the Seas was delivered on October 29.
With a length of 362 meters and a width of 64 meters, she has a tonnage of 236,857 GT, with 2807 cabins and 64 suites on board. 
 

Friday, November 5, 2021

A new U.S. maritime strategy


From CIMSEC by representative Elaine Luria 

This article outlines the path that led to the U.S. Navy’s current strategic deficit and proposes a framework for a new maritime strategy, one that I believe should be immediately developed along with the corresponding force structure assessment.
With a modest 5% additional investment in the Navy over the next five years, 90% of the changes required by this strategy can be achieved.

The Death of Naval Strategy


The Goldwater-Nichols Department of Defense Reorganization Act of 1986 effectively ended U.S.
naval strategy.
Through this legislation, Congress affirmed its authority to step in and “right the ship” after a series of well-publicized military failures, which at the time seemed to lay squarely on the shoulders of the services’ inability to work together without service-specific parochial interests getting in the way.

The Goldwater-Nichols Act affirmed and strengthened the role of Secretary of Defense and greatly expanded the power of the Chairman of the Joint Chiefs of Staff, effectively removing the Service Chiefs and Secretaries from any role in the operational chain of command and from any advisory role to the President.
They were relegated to budget warriors – and the Navy was a ship not under command.

The Act also sought to increase the caliber of officers in joint positions and required that all officers serve in a joint tour as a prerequisite for promotion to flag or general rank.
As a result, the services realigned officer career paths to meet these new joint timelines.
Each service had to align to statutory promotion boards, which ultimately drove the career path of each officer, resulting in officers moving as quickly as possible from one milestone tour to another.
No longer could an officer afford to spend multiple tours on Navy staffs learning the craft of strategy.
Strategy was only for the Joint Staff—only for the Chairman.

The Chief of Naval Operations (CNO)—the only service chief with “Operations” in his title— had a unique role since the position’s establishment in 1915.
The official role of the CNO was codified in 1947 under General Order 5 as “(a) command[er] of the Operating Forces, (b) principal naval advisor to the President and the Secretary [of the Navy].” 

The ink had barely dried on the General Order, when forces in Congress and the White House set about to further the trends in unification of the armed forces.
Over the next 20 years in a series of laws, the role of the CNO in operational matters was fully removed and by the 1970s, then-CNO, Admiral Elmo Zumwalt, was convinced that the Navy “was confused about its justification for existence.”

Thomas Hone noted in his book, Power and Change, that “OPNAV [the CNO’s staff] is a loose confederation, not an operational organization.” It was, however, not until 1978, when CNO Admiral Thomas Hayward, fresh off a tour as Commander-in-Chief, U.S. Pacific Fleet, translated Zumwalt’s criticisms into real change.
Hayward was convinced the Navy needed to be revitalized, strategically and tactically – simply put, the Navy needed a strategy around which to plan and program.
As professor John Hattendorf of the Naval War College observed, “Hayward sought to change…from a budget battle to an analysis of the strategic issues of a global maritime power.”
In 1981, Navy Secretary John Lehman built on Hayward’s Sea Strike concept to establish the goal of a 600-ship Navy, which he very nearly reached before leaving office.

Then came Goldwater-Nichols.
One cannot deny that the Act has been successful in more fully integrating the services into a Joint Force, however, one cannot overlook the deleterious effects on strategy and procurement in the individual services that have resulted.
As I wrote in Look to the 1980s to Inform the Fleet of Today, the Navy does not have, and has not had, a maritime strategy for the past 30 years.
Moreover, the past 30 years have seen failures in ship class after ship class, resulting in a lost generation of shipbuilding.

As “budget warriors,” many CNOs since the late 1980s have attempted to leave their mark on the service, and some have—for better or worse.
However, it is precisely because the Navy has lacked a strategy that the success or failure of the Navy has relied solely on the strength of the CNO or Navy Secretary’s personality.
As I noted in my article, Secretary Lehman’s bullish approach: “first strategy, then requirements, then the POM, then budget,” stands in stark contrast to the budget-driven Navy leadership of subsequent decades.

What is, and is not, a Maritime Strategy?

A strategy is the military means to accomplish political ends – or as often quoted from Clausewitz, “a continuation of politics with other means.”

This year, like many others, military leaders reiterated in repeated testimony before the House Armed Services Committee that they are “prepared to compete globally and fight and win the nation’s wars…” However, when asked what “win” means, the same leaders seem befuddled.
The Chief of Staff of the Army recently testifiedthat “winning with China means not fighting China.” I happen to agree with him, except, that was not the question—which is precisely the problem.
We cannot define what “winning” means.
When one cannot define winning, one cannot write a strategy.

What does winning with China look like? Numerous naval strategists including Sir Julian Corbett have argued that war cannot be won by naval (or air) action alone.
Similarly, Chairman of the Joint Chiefs, General Mark Milley, recently testified that “decisive outcomes in war are ultimately achieved on land…” Does this mean that we cannot have a decisive outcome with China without a ground invasion of the mainland?

Today, the military rise of China threatens the balance of power globally and as Thucydides noted – the rise in power of one actor threatens all others.
This is not to say that China—or any other country—does not have the right to defend itself, but that a country that does not share the ideals of a free, democratic world is disrupting international norms.
As with the destabilizing actions of Russia, if not properly managed, China’s actions could be misinterpreted and lead to unintended conflict.

It is precisely this ambiguity that drives the Navy’s need for a new global maritime strategy – and a complementary national maritime strategy that includes the full range of commercial maritime activities, domestic shipbuilding and repair, and Maritime law enforcement activities.
The need is especially critical when defense resources are strained amid competing priorities from non-defense spending and among the services themselves.
This naval strategy should be developed by naval leaders, not by the Joint Staff nor the Office of the Secretary of Defense.

Since the end of World War II, the U.S. defense planning strategy has been a variation of a two-front war policy.
Today’s National Defense Strategy (NDS) calls for the Armed Forces to be capable of “defeating aggression by a major power; deterring opportunistic aggression elsewhere.”

By placing offense (defeating aggression) as the primary capability of our forces, it constrains thinking in the offense-defense balance of military strategy and has resulted in maintaining a large standing army and Cold War-era battle tactics as the preferred methods of training and equipping our forces.

Today’s “Maritime Strategy”

In the 1984 Maritime Strategy, “winning” meant keeping the conflict to a conventional war and supporting ground forces in driving the Soviets back to their own borders.
This is the “deny and punish” approach still employed today.
The Navy developed the strategy on the assumption, backed by intelligence, that any conflict with the Soviets would quickly engulf much of the globe.
This required the Navy to be present and ready in three key regions simultaneously, instead of the “swing strategy” preferred by the Joint Staff.

The Navy developed a maritime strategy based on a three-front conflict and centered it around the carrier battle group.
The strategy did not consider limitations in maintenance, training, or employment.
It was assumed every ship would be available in conflict and that the number needed was 600.

If the same construct were applied to our force today using the current NDS, the Navy could simply use the Indo-Pacific Command Commander’s most demanding contingency to determine the number and type of ships required for the whole Navy.
This resultant force structure would be well below the 355-ship requirement, even when accounting for “opportunistic aggression elsewhere,” and would likely fall below 250 total ships.

So, how did the Navy develop its current Battle Force 2045 plan that calls for somewhere between 382 to 446 manned ships and 143 to 242 large, unmanned vessels?

Instead of starting with a single contingency, or multiple contingencies, the Navy made assumptions about force development, force generation, and force employment to drive their final assessment.
The range of ships presented in Battle Force 2045 came about not from a global maritime strategy, but instead, three different studies were simply coalesced into a single force structure assessment, and the resulting force requirements present a range based on the final product of each study.

As a 2019 RAND Corporation study on defense planning noted, “different assumptions and types of guidance can produce very different results in the process.”

In other words, our assumptions greatly drive outcomes.
Combatant Commanders (CCDR) develop contingency plans to combat specific scenarios in their theater while the Chairman of the Joint Chiefs, through the Joint Staff, is tasked with global strategic planning.
The study concluded that “a common assumption is that the plans and programs of the defense planning process should be strategy-driven, but the final size and shape of the force are highly budget-influenced.
When operating in that realm, defense planners do not have a reliable way of estimating—or quantifying—risk” (emphasis added).

Former Undersecretary of Defense Michèle Flournoy testified before the Senate Armed Services Committee in 2015, that the Joint Staff force planning process, the process that translates strategy into the forces we need, is deeply flawed and guided much more by parochial interests vice national interest.
She goes on to say “the current process is antithetical to the kind of competing of ideas and innovation that the Department [of Defense] really needs…”

When a force structure assessment begins by using inputs like force generation and employment to counter specific scenarios, the output will always be dependent on current force employment constructs.
The Optimized Fleet Response Plan uses a 5:1 model, where five ships result in one deployed.
For example, if one wanted 100 ships deployed around the globe annually (the Navy’s traditional deployment rate), the force structure required would be 500 ships.
However, if the force generation model is changed to 4:1, the total force would require only 400 ships.
Further, if the force generation model was a forward deployed naval force (FDNF) model where ships are available two-thirds of the time (3:2), the force structure assessment addressing the same threat would only require 150 total ships.
These force generation models are critical assumptions that drive the force structures used in defense planning.

In a seminal article, “Cruising for a Bruising: Maritime Competition in an Anti-Access Age,” Naval War College Professors Jonathan D. Caverley and Peter Dombrowski, note “the most likely location for great-power friction is at sea.” Many scholars have written about the balance of power that affects competition on land, especially over the last 20 years, but much less has been written about maritime competition and the offense-defense balance on the oceans.
However, a truth remains, “when offense has the advantage, the security dilemma grows more acute, arms races grow more intense, and war grows more likely.”

Naval platforms are ideally suited to provide a flexible deterrent option, however, Barry R.
Posen
and Jack Snyder postulate that the U.S. military is offensively minded, and one can see this through public testimony and statements of our military leaders.
The defense side of “offense-defense” is often thought of as a natural output of a strong offense.
This was true in the 1980s Maritime Strategy that envisioned an exclusively offensive plan and is what Caverley and Dombrowski refer to as the “Cult of the Offensive…” They argue that even if the Navy could instantly develop the fleet of the future, the doctrine of power projection would still dominate the thinking.

In the 1984 Maritime Strategy, the deterrent role was ancillary from the demand-based wartime strategy that resulted in the 600-ship requirement.
In that strategy, deterrence was an output of force structure, and it articulated the requirement for a peacetime presence to fill deterrent roles, reduce response times, and provide policymakers with naval crisis-response options.
One-third of the ships needed for wartime missions in each theater would always notionally be forward deployed under the strategy.
However, by 1987, the 600-ship requirement was exclusively tied to a deterrent presence model.
Vice Admiral Hank Mustin testified that dropping below the 15-carrier requirement would necessitate a discussion of “what [region] do you want to give up?”

Deterrence as a Strategy

I agree with many of today’s military leaders that war is not inevitable, but to conclude that the only way to win in the face of malign or belligerent nations is not to go to war is naïve at best, and is not grounded in a strategy that uses deterrence as its first principle.

It would be better to acknowledge that we are not going to conduct a land campaign against China, so in conventional thinking, the U.S. cannot “win” a war, however, much as with nuclear war, deterrence should be considered “winning.” When military leaders use language like “fight and win,” it downplays the primary objective of deterrence and ultimately may shape force structure and force employment in the wrong direction.

A deterrence strategy should not be a byproduct of an offensive strategy.
According to a 2017 Center for Strategic and Budgetary Assessments (CSBA) study, in the decades after the fall of the Soviet Union, “the U.S. Navy pursued a deterrence posture that relied on modest levels of forward deployed forces that were smaller representations of the larger force.
To avoid instability caused by regional powers, deterrence was premised on the promise of punishment that would arrive with follow-on forces.” Bryan Clark, testifying about the study in 2017, affirmed “the emergence of great power competition is going to put the onus on us to deter conflict with those great powers.”

Each contingency plan has a phase of deterrence, or what the Navy terms “presence,” day-to-day requirements for ships at sea.
In the past 20 years, wars in Iraq and Afghanistan have dominated the Navy’s power projection requirements and structural cracks in our force generation and employment models have been revealed.
Many ships have deployed back-to-back with maintenance truncated, only to have future maintenance availabilities extended to double or more of their original length, requiring another ship to deploy in their place.
The Navy has tried to “reset” this cycle on several occasions, only to be told that they must surge again to meet emergent requirements.

Today, the combined CCDR day-to-day requirements for all theaters would require 150 more ships than are presently in the fleet.
Moreover, although the Navy can provide flexible strike options without the need for overflight consideration, the last two decades of war have shown that our Navy is not adequately sized using current force employment models to provide this enduring capability.

The inherent mobility of a navy provides a deterrent when present, but when removed it reminds enemies—and allies alike—of the unfixed nature of a mobile force, and could create the incorrect perception that an opening exists for aggression.
Case in point is the recent deployment of the forward-based carrier Ronald Reagan from Japan to the Middle East.
A ship can only be in one place at one time, therefore, political decisions or CCDR requests can also take away the deterrent that was present yesterday.

The same is not true for forward based ground troops.
During the past twenty years, the Army did not lower the troop levels in Korea or Germany to deploy them to Iraq and Afghanistan—but that is precisely what the Navy did with its own force posture commitments.
Naval forces that otherwise would have been present in the Mediterranean, Western Pacific, and North Atlantic have instead persistently been deployed to the Middle East, leaving a massive presence gap that China has exploited.

A New Maritime Strategy

The same 2017 CSBA study cited earlier provides a compelling model for developing a new maritime strategy.
This study proposes a revolution in naval strategy and presence.
This new “deterrent strategy” would organize forces into distinct Deterrence Forces and Maneuver Forces, with each having separate force structures and missions.
The study suggested that the Navy should “focus on sustaining an effective posture for conventional deterrence rather than an efficient presence to meet near-term operational needs.”

The Deterrence Forces

Much has been written over the past 70 years about the actual success of deterrent strategies, but many believe it is a strategy worth pursuing.
Deterrence cannot be measured in real time and although it is the cornerstone of our National Defense from nuclear to conventional conflict, there is no way to accurately measure its success or failure.
Only in retrospect can we know that our strategy of deterrence has worked – and it has clearly worked in nuclear conflict, but not always in conventional conflict.

In a deterrent strategy, the commitment of the defender, in this case the U.S., must be resolute and unwavering.
As Robert Jervis noted, “perceptions are the dominant variable in deterrence success or failure.” Bruce Russett concluded that deterrence fails “when the attacker decides that the defender’s threat is not likely to be fulfilled.”This does not mean that the U.S. must respond to every provocation, as it often did during the Cold War, but as Michael J. Mazarr noted, “successful deterrence typically involves…taking steps to demonstrate both the capability and determination to fulfill a threat.” It is this capability and determination that may have led Michèle Flournoy to state that if the U.S. had the capability to “credibly threaten to sink all of China’s military vessels, submarines, and merchant ships in the South China Sea within 72 hours, Chinese leaders might think twice before, say, launching a blockade or invasion of Taiwan…”

The Navy and Marine Corps by their inherent construct are uniquely positioned to provide both general (ongoing, persistent) and immediate (short-term, urgent) deterrent forces.
In a 2020 article, Erik Gartzke and Jon R. Lindsay stated that “One of the defining characteristics of a naval force is its special role in projecting power.
Navies enable countries to influence politics in more places, more decisively, farther from home.” The article provides an in-depth discussion of the role of naval power and identifies actions that demonstrate resolve and capability, and that make room for adversaries to reach bargains, rather than conflict.
This is precisely the reason the U.S. Navy should be persistently present on the high seas around the globe.
This deterrent presence cannot simply be the byproduct of the current Navy global presence construct.
It must be intentional, persistent, and tailored to the individual theater.

The CSBA study provides a detailed proposal of the composition and deployment locations of the deterrence force, and although I do not agree with the entirety of the force structure or locations outlined in the study, the overarching concept it defines is valid and should be considered as a foundation of a new maritime strategy.

In this construct, the Deterrence Force consists primarily of forward deployed naval forces, with a force generation model that produces a full year of deployed ship presence for every two ships, which is 2.5 times what we achieve today through purely rotational forces.
The study’s force construct provides for a mix of low- and high-end forces, including unmanned surface and sub-surface vehicles.
Carrier strike groups would not be part of Deterrence Forces.
The Maneuver Forces

While the Deterrence Force is the first line of defense preventing near-peer competitors from achieving a fait accompli, the Maneuver Force arrives to conduct sustained warfare, and will be augmented by the remainder of CONUS-based rotational forces when they arrive later.

In the CSBA study the Maneuver Forces are deployed on a more traditional, rotational model such as the Optimized Fleet Response Plan (OFRP) and are centered exclusively on carrier strike groups.
The study provides for two carrier strike groups deployed continuously, but independent from current global force management plans.
Instead, these forces “will need to be prepared for a wider range of possible operational environments, more potential adversaries, a larger number of alliance relationships, and a higher likelihood of being faced with high-intensity sustained combat.” In the study, the Maneuver Forces consist of multi-carrier task groups not assigned to a particular region, but free to move between theaters conducting major exercises, experimenting with tactics, and operating with allies.

Next Steps

The Navy should develop a maritime strategy and corresponding force structure based on the Deterrence and Maneuver Force construct outlined in the CSBA study, make changes to operating models as rapidly as possible, and make their intentions widely known.

The 2017 CSBA study makes a strong case for adoption of this new operating model and for making significant changes to future naval forces.
We simply cannot continue to use the same outdated approach to conventional deterrence and expect to successfully deter peer competitors.
The study concludes that:
“This [current] approach to conventional deterrence will likely not work against the potential great power aggressors of the 2030s, who are likely to seek the ability to achieve a quick, decisive victory over adversaries.
Efforts to reverse the results of aggression would require a much larger conflict and would likely have global consequences that would create international pressure to reach a quick settlement.
To be deterred in the 2030s, aggressors must be presented with the possibility that their goals will be denied or that the immediate costs to pursue them will be prohibitively high.”

The conundrum we face today is that there is no time to waste in developing this new strategy and method of operations.
The CSBA study calls for significant investment in new platforms and overseas basing that are both costly and time consuming.

Many of the force changes proposed in the study would take decades to achieve and proposals such as basing forces in Vietnam and the Philippines are unlikely to materialize.
However, force employment and generation can be changed quickly, and existing infrastructure and basing agreements can be rapidly leveraged to achieve the goals of this strategy.

In order to quickly establish the Deterrence Force, I differ somewhat from the CSBA study in the proposed locations for these units and believe that we must take advantage of locations where we currently conduct routine operations and have existing infrastructure.
These forces could be postured in a sweeping arc encircling China, from Djibouti to Diego Garcia to Singapore to Guam to Japan, very similar to the Akhromeyev Map.
This would include standing up the First Fleet in Singapore, as proposed by the former Navy Secretary Kenneth Braithwaite.
We should work with allies in the region on increasingly-coordinated operations and extend and strengthen our compacts with island nations, such the Federated States of Micronesia and Palau, who have expressed a willingness to work closely with the U.S. to reject Chinese influence.

In the Mediterranean and European theater, deterrent forces should be based in Souda Bay, Spain, and Norway to counter Russian malign efforts in the region, with additional forces stationed in Alaska.
This would also be a deterrent force poised to respond in the Arctic.

For the Maneuver Force, a slightly different approach than that discussed in the CSBA study is achievable today.
Operating these maneuver forces using a FDNF CONUS-based model would position one carrier strike group on each coast, with the remainder of the carriers operating in a rotational model (such as OFRP) until it is their turn to rotate into the FDNF model.
Additionally, the Japan-based FDNF carrier would remain on its current cycle.
The two FDNF CONUS carriers would then split the globe and operate as maneuver forces in a regional model vice specific allocation to a combatant commander.

Finally, I propose that by using existing platforms we can achieve most of the deterrent effect of this strategy in the next five years.
We should increase DDG procurement to four per year (two per yard per year), rapidly ramp-up and expand the FFG program to a second production yard, modify current platforms such as the MK VI patrol boat with missile launchers, field the Naval Strike Missile on LCS, and convert commercial vessels to large VLS magazines.
Additionally, while the Marine Corps fully develops its Expeditionary Advance Base Operations concept, they could begin testing the concept using the LCS and EPF platforms.
I postulate that this deterrence effect can be gained for as little as a 5% increase in the current Navy budget ($10B) per year.
Much as John Lehman wrote in discussing the development of the 1984 Maritime Strategy, 90 percent of the deterrent power of this buildup could be achieved in the first year.
This was done by publicly declaring and explaining the strategy, especially its naval component, and taking actions that left no doubt among friend and foe that it would be achieved.

Conclusion

The United States has a unique role in history.
Seth Cropsey and Bryan McGrath wrote in 2017, “the paradox of the American experience is that the U.S. is not simply a great power – it is an exceptional power, for which ideals count as much as strength.”
It is this exceptional power – and responsibility – that requires exceptional thinking by the political and military leaders of our nation.
This global maritime strategy can work, but the Navy will have to overcome substantial barriers to change in the Joint Staff, Combatant Commands, amongst the Services, and within the National Security Council and Congress.
However, one cannot argue with a good plan.
All we need is the plan and a few champions on Capitol Hill.

Links :

Thursday, November 4, 2021

Alcohol leading contributor in U.S. recreational boating accidents

It’s so important for a boater to always wear a life jacket and to make sure that it is serviceable, properly sized, and correctly worn.

From Maritime Executive 

The U.S. Coast Guard released its 2018 Recreational Boating Statistics Report on Tuesday, revealing that there were 633 boating fatalities nationwide in 2018, a 3.8 percent decrease from 2017.

From 2017 to 2018, overall recreational boating injuries also decreased 4.5 percent (2,629 to 2,511), and the total number of accidents decreased 3.4 percent (4,291 to 4,145).

Alcohol continued to be the leading known contributing factor in fatal boating accidents in 2018, accounting for 100 deaths (19 percent) of total fatalities.


“While these decreases are encouraging, there are still too many deaths and injuries that could be avoided through the use of life jackets and eliminating alcohol consumption while operating a boat,” said Captain Scott Johnson, chief of the Office of Auxiliary and Boating Safety at Coast Guard Headquarters.
“It is heartbreaking to realize that more than 100 people could still be alive today had alcohol use been curbed.”


Half of a boating party perished in Alabama in July 2018 when an inebriated passenger bumped into the operator, who had also been drinking, which caused the operator to swerve and crash into a bridge piling at about 25 mph.
Two people were killed, including one who was struck by the boat’s propeller.
The operator had a blood alcohol concentration level of 0.15, nearly twice the state’s legal limit of 0.08.

“This was just one tragedy that could have been prevented by removing alcohol from the day’s activities,” Johnson said.
“Anyone who’s spent long periods of time out on the water knows that alcohol consumption, when combined with fatigue from sun and wind exposure, will severely hinder a person’s ability to make good decisions and maintain awareness of their surroundings.”

The report also shows that in 2018:
  • The fatality rate was 5.3 deaths per 100,000 registered recreational vessels, which tied as the third lowest rate in the program’s history. This rate represents a 3.6 percent decrease from last year’s fatality rate of 5.5 deaths per 100,000 registered recreational vessels.
  • Property damage totaled about $46 million.
  • Operator inattention, improper lookout, operator inexperience, machinery failure, and excessive speed ranked as the top five primary contributing factors in accidents.

Where the cause of death was known, 77 percent of fatal boating accident victims drowned. Of those drowning victims with reported life jacket usage, 84 percent were not wearing a life jacket.
A number of deaths involved inflatable life jackets that had expired cartridges or life jackets that were not buckled, thus making them ineffective as lifesaving devices.

Where boating instruction was known, 74 percent of deaths occurred on vessels where the operator had not received boating safety instruction.

The most common vessel types involved in reported accidents were open motorboats, personal watercraft and cabin motorboats.
Where vessel type was known, the vessel types with the highest percentage of deaths were open motorboats (50 percent), kayaks (13.5 percent) and canoes (seven percent).

Links :

Wednesday, November 3, 2021

U.S. vs. Canada: five modern-day territorial disputes

Five conflicts with history – and a future.
Credit: TUBS, CC BY-SA 3.0 / image processed by Ruland Kolen

From BigThink by Frank Jacobs

All of these conflicts have a long history.
They may also have a long future.
  • U.S.-Canada relations are mostly friendly, but both countries do not agree on everything.
  • In these five places, they even argue about where the border between them should be.
  • Those conflicts have been around for a long time, but that does not mean they cannot get worse.
It is often called the longest undefended and peaceful border in the world, and for its 5,525 miles (8,891 km) over land, the U.S.-Canada border is just that.
At sea, it is a different story.
There are five maritime locations where Canada and the U.S. have very different opinions over who owns what.
If ever the friendly relations between both countries turn frosty, it could very well be over one or more of these disputed areas.
The Strait of Juan de Fuca: a three-way fight over equidistance
 
 
Two small slivers adding up to no more than 15 square nautical miles.
Credit: David H. Gray, “Canada’s Unresolved Maritime Borders” (via IBRUat Durham University).


Ioannis Phokas was born in Greece but served the Spanish king, under a name more suitable to the Spanish palate: Juan de Fuca.
In 1592, he claimed to have found the fabled Strait of Anian.
Legend held that this channel connected the Pacific and Atlantic oceans.

Like many other legends animating discoverers and explorers across the Americas, this one too mistook wishes for reality.
De Fuca’s name would have melted back into obscurity if English sea captain Charles Barkley, exploring the Pacific Northwest in 1787, had not spotted some similarities with descriptions from de Fuca’s expedition.

Today, his name resonates across the region.
There is a strait named after Juan de Fuca, and derived from that a tectonic plate and an undersea ridge, as well as a park on Vancouver Island, and… a territorial dispute.

The Strait of Juan de Fuca separates Vancouver Island in British Columbia (Canada) from the Olympic Peninsula in Washington State (U.S.).
The border between both countries runs straight down the middle of the strait.
No problem here: it is the bit out to sea that is under dispute.

The disagreement between the U.S. and Canada is not about principle.
Both countries agree the border here should be equidistant between them.
The problem is: equidistant from where?
Each side uses slightly different base points, resulting in small differences in the borderline.

To complicate matters, the provincial government of British Columbia has rejected both the Canadian and American borderlines and the entire principle of equidistance.
It argues for the principle of natural prolongation, claiming that the appropriate boundary is the submarine canyon (also named Juan de Fuca).
Although that would mean a better border for British Columbia, the Canadian government is loath to give up the principle of equidistance, which could cost it dearly in other areas.

The Dixon Entrance: where the U.S. is north and Canada south
 
 
The largest patch of the three shown here measures 806 square nautical miles.
Credit: David H. Gray, “Canada’s Unresolved Maritime Borders” (via IBRUat Durham University).


Canada is north of the United States, right? At the Dixon Entrance, it is the other way around.
North of this body of water lies Prince of Wales Island.
Despite its royal name, the island is part of the United States.
It is also the southernmost point of Alaska’s panhandle.

To the south of the Dixon Entrance lies Canada’s Haida Gwaii archipelago, known as the Queen Charlotte Islands until 2010.
The archipelago’s northernmost island is still referred to as Graham Island, perhaps because its Haida name is a bit of a mouthful: X_aaydag_a Gwaay.yaay linag_waay in X_aayda Kil.

The waters in between are rich with fish, attracting orcas, albatrosses, and humans.
In pre-contact times, local tribes feuded over access to these marine resources.
The neighbors are still in disagreement, but their names now are the U.S.
and Canada.
The present conflict has its roots with yet another set of rivals: Russia and Britain.

Squint, and you can spot today’s border between Alaska and Canada in the map annexes to the 1825 Treaty of St Petersburg.
Signed halfway across the world, that agreement between Russia and Britain drew a line between their interests in the northwest of North America.

It set 54° 40’ north as the southern limit of Russian America’s panhandle.
(The treaty later gave rise to former President James K. Polk’s campaign slogan, “Fifty-four forty or fight!” but that’s another story).
But because much of the panhandle’s rugged terrain was still unsurveyed, the actual course of the border remained vague.

The Brits imagined a very thin panhandle, the Russians a very fat one.
When the Americans purchased Alaska from the Russians in 1867, they inherited that simmering conflict — which became serious enough to acquire capital letters: the Alaska Boundary Dispute.

The ABD was settled by international arbitration in 1903.
The panhandle’s current land border is 35 miles (56 km) east of where the ocean touches the coast, somewhere in the middle between both extreme claims.

The Canadians, however, were still unhappy.
If the border had been a bit more in their favor, they would have had direct sea access to the Yukon goldfields.
They blamed the British, who had negotiated the deal on their behalf, but favored better relations with the U.S. over a better deal for Canada.

The arbitration also specified Alaska’s maritime border with Canada.
The so-called A-B Line ran from Cape Muzon — the southernmost point on Dall Island, Alaska’s southernmost island — east toward the mainland.
This left most of the Dixon Entrance on the Canadian side of the line.

But that was not how the Americans saw it.
As far as they were concerned, the A-B Line was relevant for the land border; the sea border ran well south of the line, as per maritime law.
This cuts the Dixon Entrance in two, the north going to the U.S., the south to Canada.

Those are the claims that both governments are still sticking to today.
One of the reasons the matter is so hard to resolve is the area’s Pacific salmon.
Each year, several species squeeze through the narrow Dixon Entrance to return to the rivers of the mainland to spawn.

To catch them, fishermen from each side follow the laws of their own country.
As recently as the 1990s, competition between Canadian and American fishermen in the grey zone boiled over into so-called “salmon wars,” both sides occasionally arresting each others’ crews.
In 1997, things came to a head when Canadian fishermen blockaded an Alaskan ferry, effectively holding its passengers hostage for three days.

Things are less tense now.
There’s even a telephone hotline where crews can report violations of standing agreements.
But the core issue has not been resolved.

As the map shows, the gray area is divided into three contiguous zones on either side of the Canadian claim line.
The triangle-shaped one in the middle is interesting because it is not part of the Canadian claim or the American one.
That means it constitutes an area of negative sovereignty, similar to the Bir Tawil triangle between Egypt and Sudan (see also Strange Maps #396).
It is unclear whether this area is expressly “ungoverned” or not.

The Beaufort Sea: two bald men fighting over a toupee
 
 
The Beaufort Sea wedge measures 6,250 square nautical miles.
Credit: David H.Gray, “Canada’s Unresolved Maritime Borders” (via IBRUat Durham University).


The Beaufort Sea was named after the Royal Navy admiral who invented the scale to measure wind force that also carries his name.
As many geographic features in Canada, it comes with an automatic translation into French: Mer de Beaufort.

That sounds very vacation-y, but do not be fooled.
This is about as cold, windswept, featureless, and uninhabited a part of the world as you may dread to find.
The sea ices over for most of the year, although recently climate change has enlarged the ice-free zone that appears in late summer.
A territorial dispute over a slice of this desolate sea recalls the old saying used by José Luis Borges to describe the Falklands War: 
“Two bald men fighting over a comb.”

The dispute is about a wedge-shaped area north of where the border between Alaska and the Yukon territory reaches the sea.
That land border follows the 141st meridian west, as agreed in the 1825 Treaty of St. Petersburg between Russia and Britain.

Fine, proposes Canada: just follow that line 200 nautical miles (230 miles, 370 km) north into the sea, and that is your sea border.
Not so fast, says the U.S., arguing that the marine border should be perpendicular to the coastline as it goes out to sea.
The difference is an area of about 8,100 sq mi (21,000 sq km).

The U.S. and Canada both agree that the sea border should be “equitable,” but they differ on what “equitable” means, in these particular circumstances.

The dispute is inflamed by the important reserves of oil and gas hidden beneath the ice, water, and rock.
According to Canada’s National Energy Board, the wedge could contain as much as 1.7 billion cubic meters of gas and 1 billion cubic meters of oil — enough to satisfy the country’s energy needs many years over.
And in a few years’ time, those reserves could become more accessible, as ice retreats due to climate change.
There is a rather dark irony hiding somewhere in that prospect.

So forget the comb.
A more appropriate simile is not about fighting over something useless, but over something that is improper and outdated.
Like two men fighting over a toupee.

Northwest Passage: as ice recedes, potential for conflict heats up
 
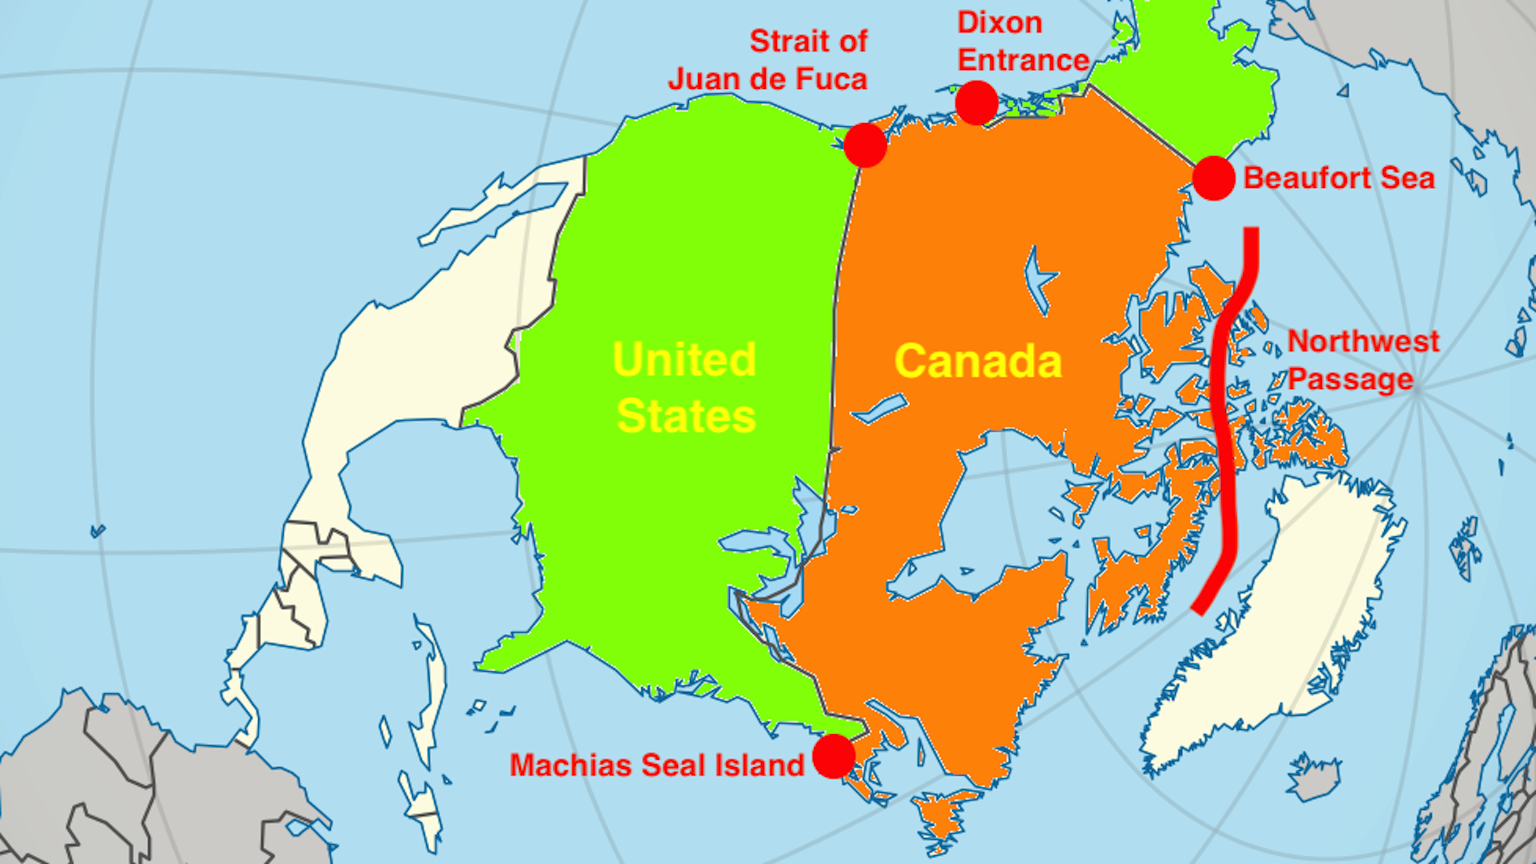
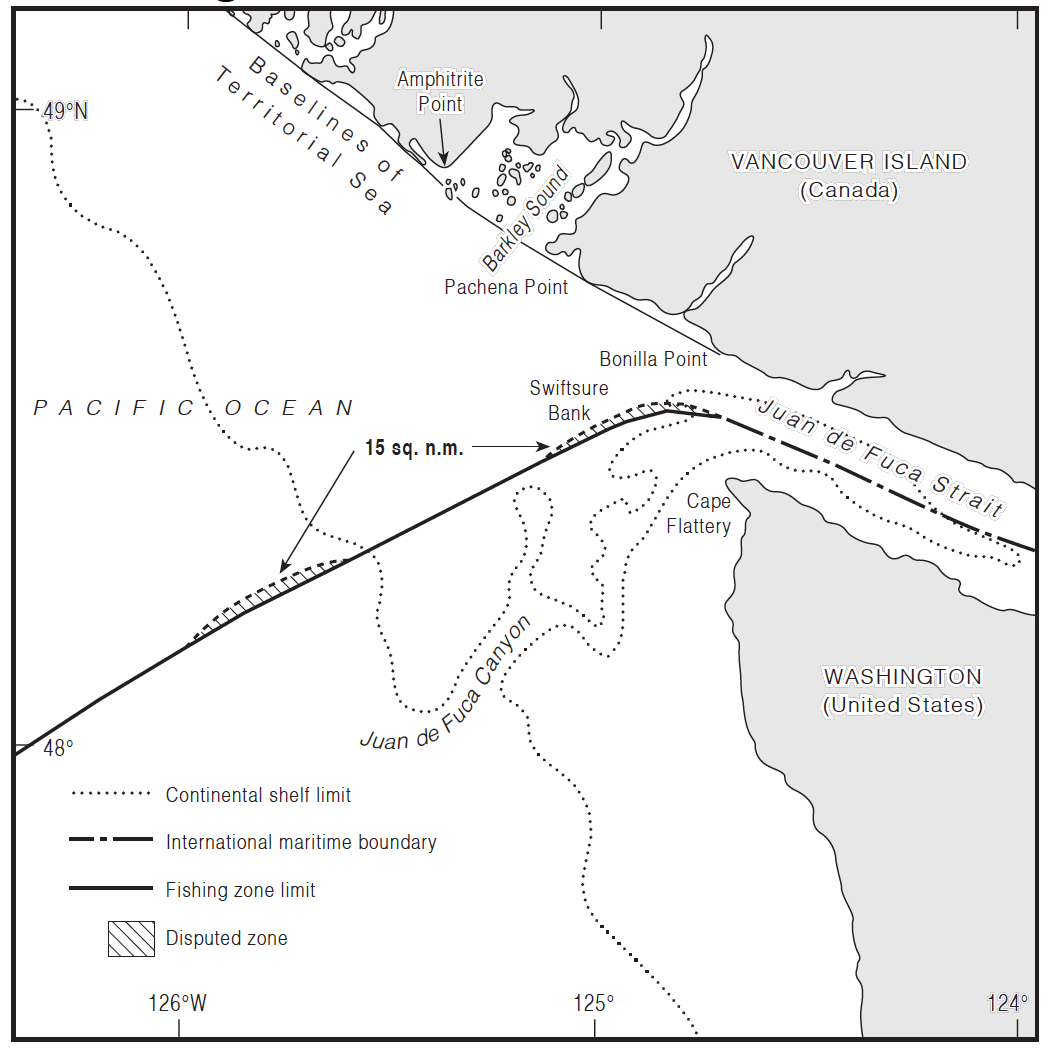
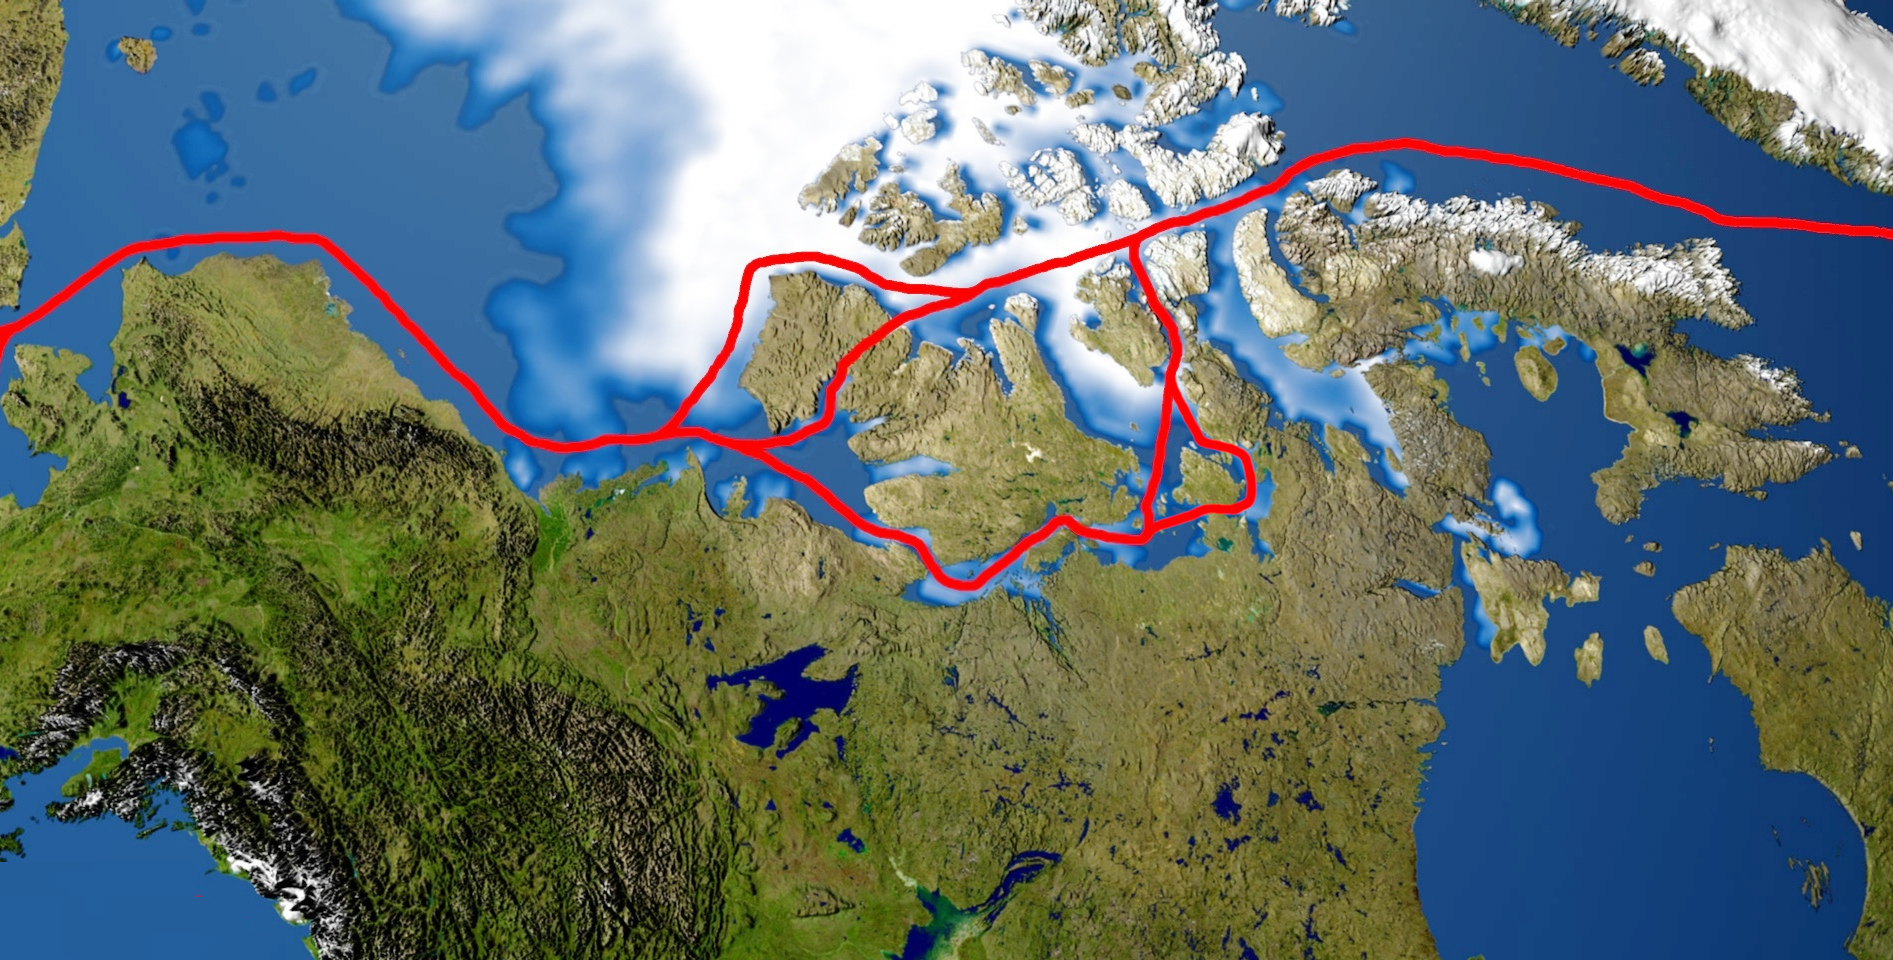
Some of the route options for the Northwest Passage.
Credit: Public domain


Funny, here is the Northwest Passage again (see also Strange Maps #1106).
The search for this drastic shortcut to sea voyages between Europe and East Asia was a motif for many of the earliest European expeditions into North America.

Such a route, through various channels across Canada’s vast northern archipelago, is theoretically possible, if not for the sea ice.
Many expeditions saw their progress blocked by ice or became trapped by it, with the most horrific example being the doomed Franklin Expedition of 1845.
Two ships and 129 men disappeared, their frozen remains discovered more than a century later.

The first to complete a passage this way was the Norwegian Arctic explorer Roald Amundsen, who took three years in the Gjøa, a sloop with a crew of six, to finish the journey in 1906.

In the last few decades, climate change and the resulting decline in sea ice have made Canada’s northern channels more easily navigable.
In 2007, a commercial vessel completed the trip without the assistance of an icebreaker, the first time that has ever happened.

Some of the more navigable channels of the Northwest Passage are very shallow, but there are several other options yet to be fully explored or deiced.
If the northern route could accommodate supertankers and other ships too large for the Panama Canal, it would shave off a big stretch of their only current option: a trip around Cape Horn, on the southern tip of South America.

As global temperatures continue to rise, the Northwest Passage will become increasingly viable for marine traffic, even if only in summer.
That means the territorial dispute over the Northwest Passage is likely to heat up soon as well.

For Canada, the issue is clear and simple: any potential waterway opening up for international shipping will pass through Canadian waters, over which the country exercises full sovereignty, meaning that Canada may grant access or levy tolls as it pleases.

However, the United States and several other countries claim that a viable Northwest Passage would de iure be an international strait, open for transit passage without restriction or compensation, broadly similar to the Bosporus that runs straight through Istanbul (see Strange Maps #1047).

In 1969, U.S. oil tanker SS Manhattan completed the passage without asking prior permission from the Canadians, and to drive the point home, the U.S. Coast Guard icebreaker Polar Sea did the same in 1985.
Even though the latter ship allowed inspection by the Canadian Coast Guard, public opinion in Canada was furious and the trip turned into a diplomatic incident.

In 1986, Canada reaffirmed its sovereignty over the Northwest Passage, a claim the U.S. refused to recognize.
To defuse the situation, both countries in 1988 signed an Arctic Cooperation agreement, which did not touch the sovereignty issue as such, but clarified some practical matters.
Under the Law of the Sea, ships in transit passage do not need permission to pass but may not engage in research while they do.
The agreement proposed that U.S. Coast Guard and U.S. Navy vessels would always be considered to be doing research, so would always need to ask permission to transit.

The treaty held for about a decade.
At the end of 2005, pictures were published of the USS Charlotte at the North Pole.
Canada strongly suspected the submarine had traversed its waters.
It certainly had not asked for permission to do so.
Canada’s tit for America’s tat was that it decided no longer to use the term “Northwest Passage” but designated the area as “Canadian Internal Waters.”

But it was to no avail: the U.S. sticks to its interpretation of international law and reserves the right to treat Canada’s Internal Waters as international waters instead.
Which side will prevail?
At the rate that polar ice is retreating, we will know in a couple of years.

Machias Seal Island: lighthouse keepers without a light to keep
 
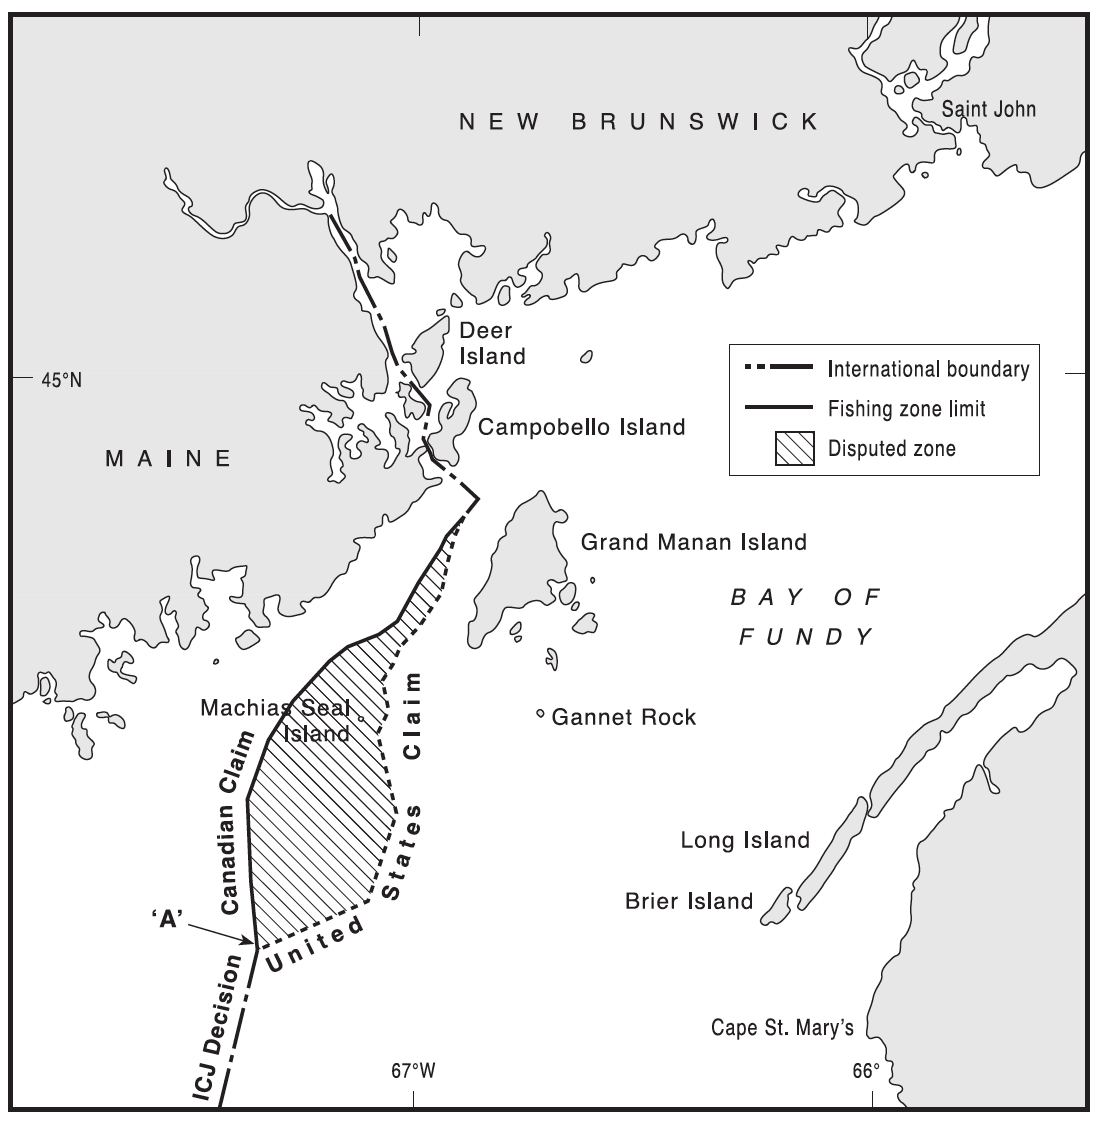
Machias Seal Island is the only actual dry land that is disputed between the U.S.
and Canada.
Credit: David H.
Gray, “Canada’s Unresolved Maritime Borders” (via IBRUat Durham University).


In 1865, a 7-foot-tall American sailor named Barna Beal landed on Machias Seal Island off the coast of Maine.
Beal, inevitably nicknamed “Tall Barney,” claimed the 20-acre uninhabited island for the United States and single-handedly chased off the British patrol sent to eject him from it.
In his will, he left the island to the first of his descendants to be named Barna.

How much of that is true is debatable.
But in the second half of the 20th century, Barna Norton, Beal’s great-grandson, took up the claim.
He was generous about it though, saying, “The island belongs to me, but everyone is welcome.”

For decades, Norton would bring over groups of tourists to the island on his boat in summer to see the island’s thriving puffin and tern colonies.
Every few years, the Canadian government sent him a cease and desist note, which he duly ignored.
After all, a letter from the U.S.
State Department said he had the right to do so.

Things came to a head every Fourth of July when Norton would parade around the island with an American flag and ask the Canadian lighthouse keepers for rent.
Canada’s counteroffensive would be led by Tony Diamond, a puffin watcher from New Brunswick.
Diamond would stick dozens of small Canadian flags in bird s’ nests around the island.

Norton died in 2004, and it seems there is no new Barna yet to reignite the pantomime war with Canada.
The origins of that war and the geopolitical gray zone that surrounds the island go back to a 1621 land grant that deeded Nova Scotia to a Sir William Alexander.
The Canadians say the grant included the island.
The Americans say the wording is too vague.

That became relevant in 1783 when the British and the Americans signed their divorce papers, a.k.a.
the Treaty of Paris.
Under the generous terms of that treaty, the newly independent U.S.
was granted sovereignty over all islands within 20 leagues (69 miles, 111 km) of its shores, unless they were previously part of Nova Scotia.

Machias Seal Island is fewer than 10 miles off the coast of Maine.
“American,” say the Americans.
But there is that ambiguously worded grant from 1621.
“Canadian,” say the Canadians.

The result was not a Mexican standoff but a Canadian one.
The Canadians had the upper hand but at considerable effort.
Canada sent a steady stream of keepers to the island’s lighthouse, not to operate the light — it had been automated years ago — but solely “for sovereignty reasons.”

In fact, the U.S.
and Canada did have a few other territorial issues in the Gulf of Maine, but those were resolved by the International Court of Justice in The Hague in 1984.
But Machias Seal Island was excluded from that deal.
Both sides seemed willing to let the current standoff continue, as long as its ingredients included nothing more harmful or costly than a steady stream of lighthouse keepers and the occasional barnacle-encrusted local “claimant” to the island.
Meanwhile, tour boats from both the U.S.
and Canada bring birdwatchers to the island.

But Machias Seal Island comes with fishing grounds, which are as disputed as the island, and much more valuable.
In 2002, Canada allowed its lobstermen to fish in the gray zone in summer, bringing them in direct conflict with their colleagues from Maine.

Sometimes, things got physical.
In 2007, a Mainer had his thumb ripped off in the gray zone while jostling with a Canadian for space.
Today, an increasing scarcity of lobsters — a consequence of global warming — is not helping matters.
 
Links :

■ For a slightly more spectacular border dispute in the part of the world named after Juan de Fuca, see this entry in Canada’s Historyabout the Pig War of 1859 — casualties: one Canadian pig, killed by an American settler.
■ For more on the Dixon Entrance, see this article on BBC Travel.
■ More background on the Beaufort Sea dispute in this article (or is that arcticle?) at the Arctic Institute.
■ And here’s another one from the same source on the Northwest Passage (and Arctic shipping in general).
■ Additional info on Machias Seal Island here on Boston.com.
Most images taken from the article “Canada’s Unresolved Maritime Boundaries” by David H. Gray, published in the Autumn 1997 edition of the IBRU Boundary and Security Bulletin, a publication by the International Boundaries Research Unit (IBRU) at Durham University (UK).