
Deciphering global heat patterns
Globally, surface air and ocean temperatures have warmed by about 1°C since 1900.
More than 90% of the additional heat contained in the climate system (atmosphere, ocean, land) due to global warming is stored in the ocean, so what do these increased ocean temperatures mean for our weather?
The ocean stores significantly more heat than the atmosphere: the top few metres of the ocean contain more thermal energy than the entire atmosphere.
There is a continuous exchange of heat between the ocean and atmosphere and the weather we experience is intrinsically linked to the heat contained in the ocean.
As atmospheric winds flow over the ocean, they typically pick up moisture and either gain or release heat.
At mid-latitudes, and depending on the season, maritime air masses are usually either comparatively mild and humid (winter) or cool and humid (summer).
Regions such as western Europe or the north-western US and western Canada experience maritime climates.
These are characterized by reduced seasonal temperature extremes compared to locations at similar latitudes in the interior and along the east coasts of the continents as the prevalent westerly winds either come from the ocean (west coasts) or the interior of the continents (east coasts).
Oceans are heating up
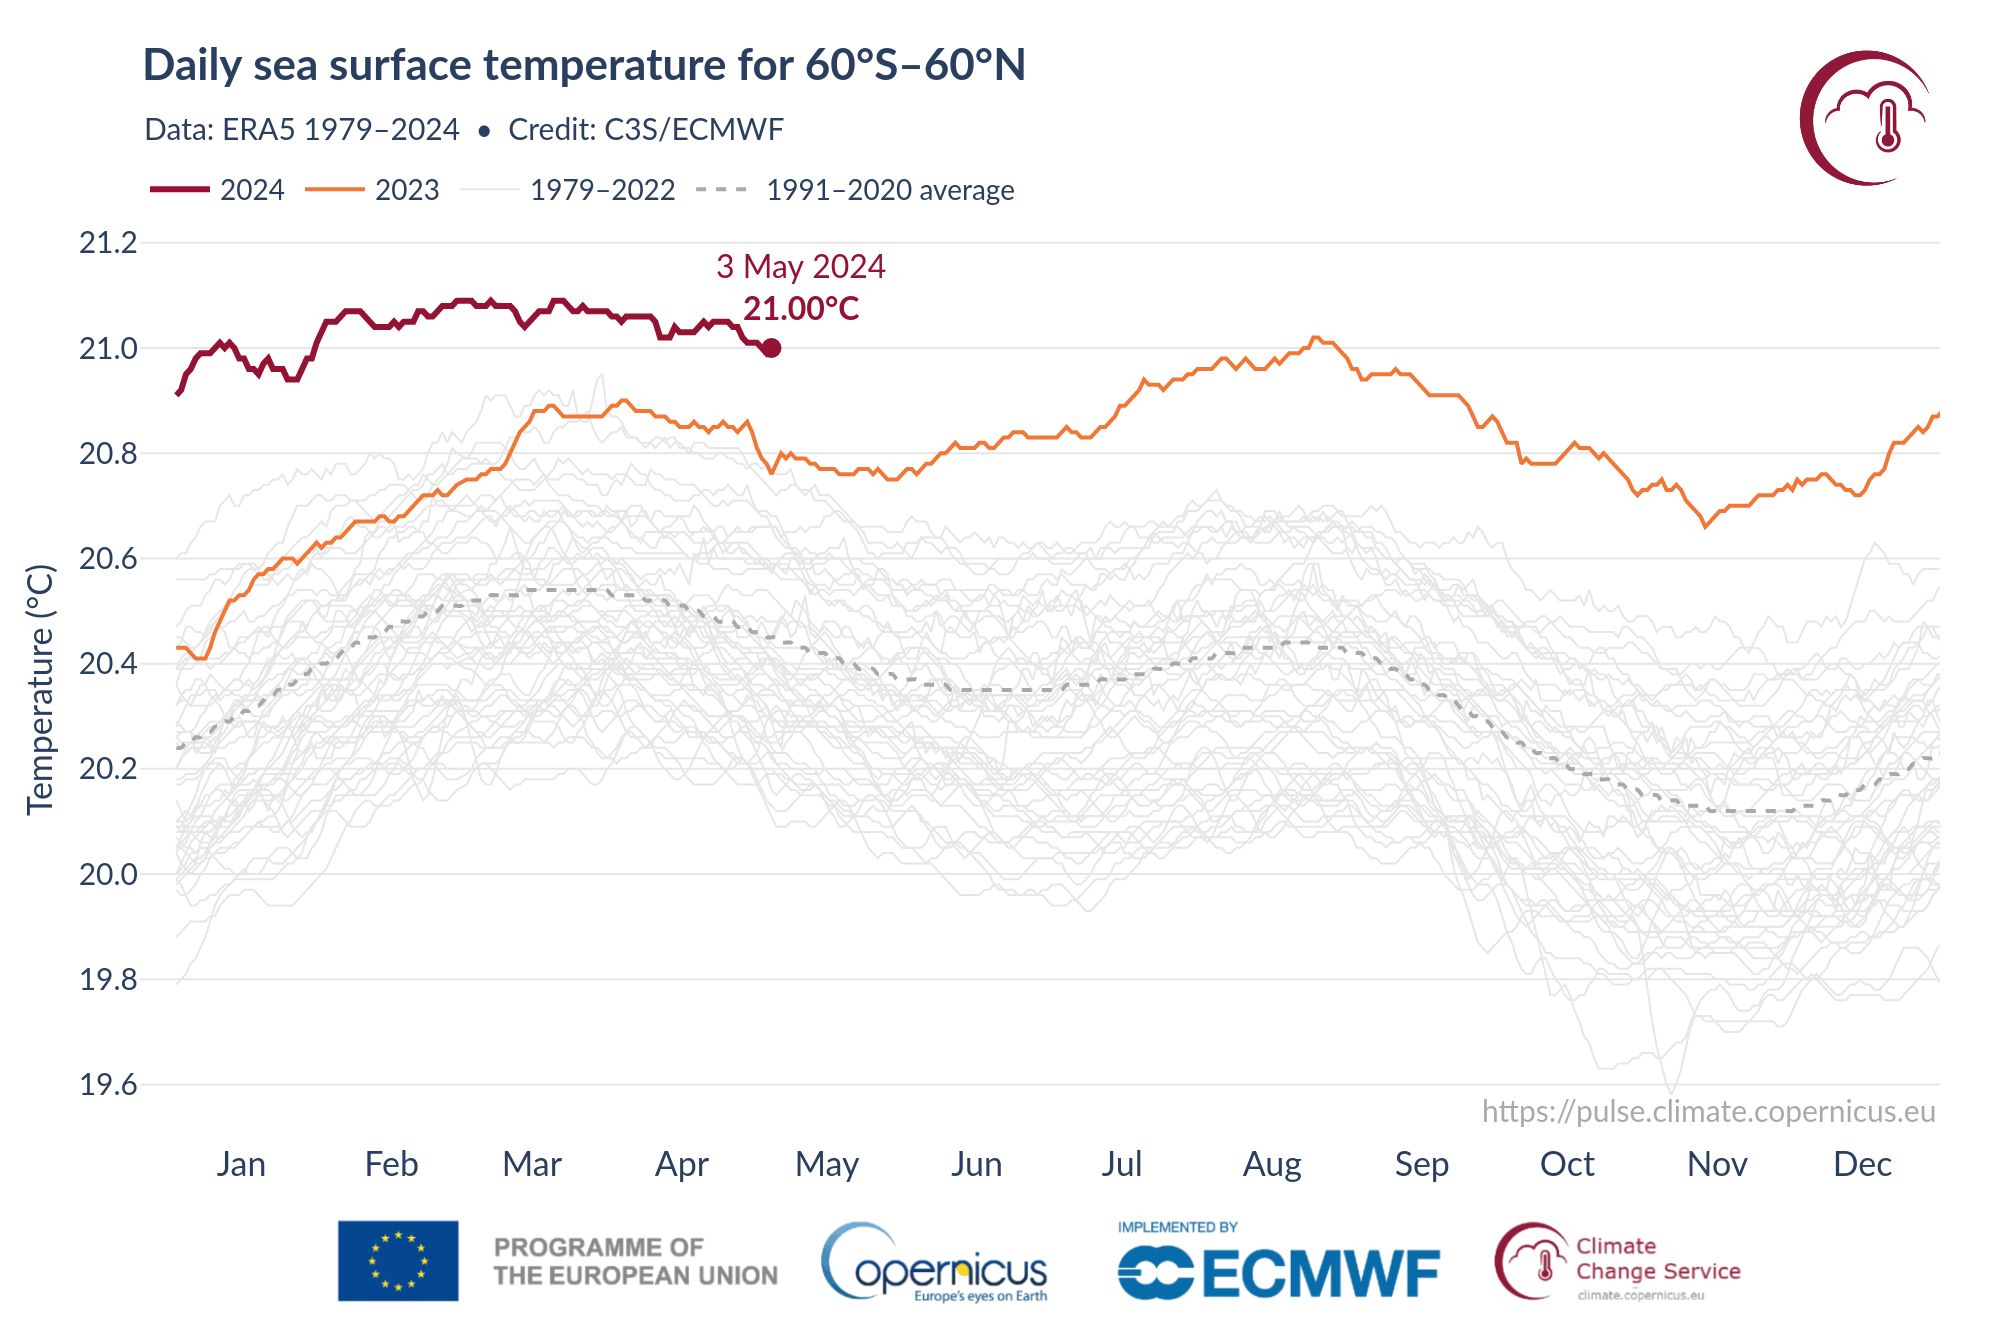
Global sea surface temperatures (SSTs) reached their highest level on record in 2023.
These temperatures made headlines in July and August, when average SSTs reached almost 21°C.
A remarkable feature is that these temperatures were observed in early August, whereas records set in previous years occurred in March, when average SSTs normally reach their highest.
From May 2023 onwards, global SSTs moved into unchartered territory and, compared to 2016 when the last SST record was set, SST values have consistently exceeded anything we previously observed.
Currently, global SSTs continue to be the highest ever recorded for the time of year and are on track for new record highs in February and March 2024.
A defining ocean feature of 2023 was the development of a marked El Niño event as well as a series of ‘marine heatwaves’.
In the North Atlantic, unusually high ocean temperatures developed from April onwards, culminating in the first marine heatwave around the UK and Ireland in June.
Later in the summer, exceptionally warm temperatures occurred in the Mediterranean Sea as well as off Newfoundland off the east coast of Canada.
We also saw abnormally high ocean temperatures developing in the north-west Pacific.
From May/June onwards, El Niño became the dominant feature with a warm SST anomaly developing in the equatorial Pacific.
El Niño events push the global surface ocean temperature and surface atmosphere temperatures (SATs) higher.
For example, this happened in previous El Niño years in 2016 and 1998, which both held the record for highest global SSTs and SATs.
The record temperatures observed in 2023 and now in 2024 should not come as a surprise, in particular on the back of the rapidly warming climate we are witnessing.
Sea surface temperature anomalies in degrees Celsius for 2023.
The anomalies are with respect to the 1991 to 2020 period.
(Credit: Huang, B., C. Liu, V. Banzon, E. Freeman, G. Graham, B. Hankins, T. Smith, and H.-M.
Zhang, 2020: Improvements of the Daily Optimum Interpolation Sea Surface Temperature (DOISST) Version 2.1, Journal of Climate, 34, 2923-2939.
doi: 10.1175/JCLI-D-20-0166.1)
Tropics and subtropics
The link between ocean temperatures and weather systems is perhaps most clearly seen in tropical cyclones (TCs).
TCs can develop into the most powerful storms, reaching wind speeds in excess of 300km/h (186mph).
TCs with wind speeds of more than 119km/h (74mph) are called hurricanes, typhoons and cyclones.
TCs are the costliest weather-related disasters.
Since 1980, global TC damage has exceeded one trillion US$.
Damage linked to single storms regularly exceeds US$100bn (£78.6bn) in cost.
A key criterion for TCs to develop into powerful storms is for SSTs to reach at least 26.5°C.
In the global oceans, this temperature threshold is exceeded throughout the year in the equatorial western Pacific, around Indonesia and in the eastern Indian Ocean.
In the Atlantic and eastern Pacific, SSTs of 26.5°C or more are reached or exceeded during parts of the year, from June to October in the northern hemisphere and from December to April in the southern hemisphere.
It is the regions where 26.5°C is only reached during part of the year and/or at new locations where historically this threshold was not reached at all that we expect the largest changes in TC activity in a warming climate.
Higher SSTs could increase the length of the TC season and TCs may start occurring in regions where they usually do not form.
In the north Atlantic, several TCs have been observed in November and December in recent years.
Regions that are not normally prone to major TC damage have increasingly experienced favourable TC conditions south of the equator in the Atlantic and Indian Oceans.
This has led to several damaging TCs affecting south-east African nations such as Madagascar and Mozambique in recent years.
Predicting how rising ocean temperatures will affect TCs globally as the climate continues to warm is complex.
The combined changes in the ocean and atmospheric circulation in a warmer climate could be both favourable and unfavourable to the formation of either a higher number of or more powerful TCs.
Very warm SSTs are favourable for TCs, but a windy background in the atmospheric disrupts their formation.
This is especially true when wind speed and direction vary with height in the atmosphere in the TC formation regions.
In a warming climate, higher SSTs are a certainty in most regions; however, our understanding of how atmospheric winds and their vertical shear will change in the future is harder to predict.
The current consensus is that the number of TCs in the west Pacific, the most prolific TC region, will not increase.
An increase in TCs activity is expected in the Atlantic – something which has been observed in recent decades.
It is too early to say whether the increase we observe in the Atlantic is part of a long-term trend or of a longer-term cycle.
However, indications are that a larger fraction of TCs could turn into powerful, destructive storms with increased rainfall intensity as warmer air can hold more humidity than colder air.
Observations also show that, for the Atlantic region, the intensity of TC rainfall has been increasing – most clearly after TCs have made landfall.
 Hurricane Idalia approaching the western coast of Florida while Hurricane Franklin churned in the Atlantic Ocean at 5:01 p.m.
EDT on August 29, 2023.
(Credit: NOAA Satellites)
(Credit: NOAA Satellites)
Subtropics to mid-latitudes
The rising ocean temperatures of recent years coincide with TC-like storms developing outside the tropics.
For example, SSTs in the Mediterranean Sea were exceptionally high in 2023, and in the autumn we saw the development of powerful storms referred to as ‘Medicanes’.
In September 2023, Medicane Daniel dumped many inches of rain (locally up to 39 inches) over parts of Greece and then later on over Libya – leading to the catastrophic dam collapse and the tragic consequences of the resulting flood.
At the time when storm Daniel formed, the surface waters of the Mediterranean Sea exceeded 26.5°C and Daniel fed on these high ocean temperatures, gaining power as it moved from Greece to Libya.
How warmer ocean temperatures impact weather systems at mid- to high latitudes is a topic of ongoing research.
As for TCs, a warmer ocean means that there is more energy available for weather systems, with the potential for stronger winds and increased rainfall intensity.
The spatial patterns of SST change are key to understanding how weather responds to a warmer ocean.
In the northern hemisphere, SSTs have increased at most locations – from the tropics to high latitudes.
A notable exception is found in the north-east Atlantic, where a region between Ireland and Greenland has warmed more slowly than the surrounding areas.
Studies have suggested that this ‘warming hole’ in the north Atlantic affects atmospheric circulation patterns over the north Atlantic region, potentially impacting the atmospheric jet stream which is the key driver for mid-latitude weather systems.
Extreme weather events such as mid-latitude heatwaves, cold spells and floods are directly linked to the jet stream, a ribbon of fast-flowing air (up to 300 km/h) at an altitude of about 10km in the atmosphere.
The jet stream is typically not a coherent ‘river’ that circumnavigates the globe, but breaks into a series of seemingly disconnected meanders.
These meanders are associated with high- and low-pressure areas.
Sometimes the jet stream can be ‘stuck’ in a given position for days or weeks.
It is then that some of the most extreme weather events occur as the standing atmospheric wave means that high- or low-pressure areas are locked over the same areas for prolonged periods.
This is conducive to the build-up of extreme temperatures and was often the cause of the heatwaves we have experienced in recent years.
A standing atmospheric wave can also continuously steer moisture-laden air towards a particular region, resulting in extreme rainfall and flooding.
Understanding what causes the jet stream to become stuck and how the frequency of such blocking events could change in the coming decades as our climate warms further can only be understood when considering the complex interplay between ocean and atmosphere, while SSTs are central to the communication between the two systems.
Mid- to high latitudes
At high latitudes, warming SSTs go hand in hand with the observed reduction in sea-ice cover.
Arctic sea-ice reduction is probably the most dramatic manifestation of climate change.
The high latitudes are where the effects of global warming are most clearly seen and the warming signal in the Arctic is larger than anywhere else on the planet.
Vast areas that used to be covered by sea-ice for most of the year have now become largely ice-free.
During the winter season, this means that the atmosphere is in contact with open water more often, resulting in a vigorous exchange of heat and moisture.
In winter, over the regions where open water replaced sea-ice, we have observed the strongest warming signals and increases in surface air temperature: as much as 10°C–20°C during the winter months.
Advanced sensor and computer technology
How the frequency and strength of extreme weather events will change in response to global warming can only be understood by improving our knowledge about how the components of the climate system such as the atmosphere, the ocean, ice sheets, glaciers and sea-ice and land interact.
The ocean covers 70% of the globe and its surface is by far the largest interface between these systems.
The last few decades saw enormous strides towards simulating the complexity of the climate system on supercomputers.
Climate models are powerful and versatile tools to study climate, climate change and its impacts and to test possible mitigation strategies.
However, despite this progress, key processes are still missing.
Observational data against which models can be benchmarked becomes increasingly sparse as soon as one moves beneath the ocean surface.
This limits our knowledge of the workings of one of the main communication channels – the ocean-atmosphere, within the climate system.
In the rapidly changing environment we are in, it is more important than ever to observe our world and to accurately document its changes in as close to real time as possible.
New sensors, automated observing platforms and other emerging technologies offer the prospect of having a 3D view of the ocean in almost real time.
Advanced computer modelling techniques, machine learning and increasing computing power will provide us with the ability to monitor our oceans, detect early warning signals for major changes, inform solutions and ultimately contribute towards keeping our seas healthy for the benefit of us all.
 When observed from space, as exemplified by this view from the Moon, the Earth appears predominantly blue.
This enduring azure coloration, consistent for over 4 billion years, is attributable to the vast expanses of liquid
Conclusion
The escalating warmth of our oceans, housing the majority of additional heat within our climate system, signifies a profound shift in environmental dynamics.
This surge in thermal energy amplifies the intensity and frequency of extreme weather events, from the formidable strengthening of tropical cyclones to the unexpected genesis of potent mid-latitude storms.
As we confront the accelerating pace of climate change, understanding the intricate interplay between oceanic heat and atmospheric dynamics becomes paramount.
Leveraging advanced technologies, such as automated observing platforms and cutting-edge computer modelling, offers a beacon of hope in our quest to monitor, predict and mitigate the impacts of these changes, safeguarding the resilience of our planet for generations to come.
No comments:
Post a Comment