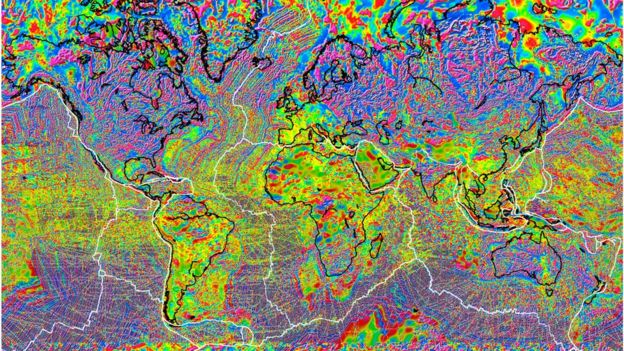
After three years of collecting data, the highest resolution map of Earth’s lithospheric magnetic field from space to date has been released.
The dataset combines measurements from ESA’s Swarm satellites with historical data from the German CHAMP satellite using a new modelling technique that allowed scientists to extract tiny magnetic signals from Earth’s outer layer.
Red represents areas where the lithospheric magnetic field is positive, while blues show areas where it is negative.
From BBC by Jonathan Amos
It is the best depiction yet of the magnetism retained in Earth's rocks, as viewed from space.
The
map was constructed using data from Europe’s current Swarm mission,
combined with legacy information from a forerunner satellite called
Champ.Variations as small as 250km across are detectable.
Clearly seen are the "stripes" of magnetism moving away from mid-ocean ridges - the places on the planet where new crust is constantly produced.
This pattern - the consequence of periodic changes in Earth's polarity being locked into the minerals of cooling volcanic rock - was one of the key pieces of evidence for the theory of plate tectonics.
On land, the signal tends to reflect the composition and thickness of the different rock layers that make up the continents.
Generally speaking, younger crust will be thinner and have a low content in magnetic minerals. Whereas, the old cratons, those stable interior sections of continents, will tend to be thicker and have a higher magnetic mineral content.
Detecting any of this from orbit is a challenge because the signals are dwarfed by that part of the global magnetic field coming from the dynamo - the movement of liquid iron in the Earth's outer core.
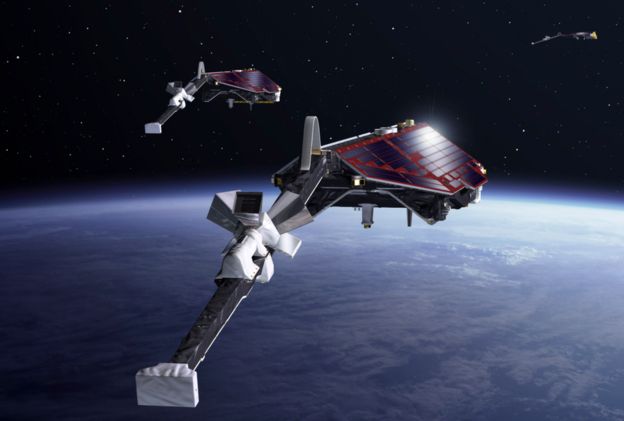
Artwork: The Swarm mission flies a trio of satellites above the Earth
(ESA)
"Again it depends where you are but the lithospheric signal is well below 100nT, even 50nT, on average," explained Nils Olsen from the Technical University of Denmark and one of the scientists who created the new space map.
"But we have certain regions where it can reach up to 2,000nT, and one of these regions is the Bangui anomaly in western Africa," he told BBC News.
This sharp signal in the Central African Republic is the possible impact site of a large iron asteroid more than 500 million years ago.

The Bangui anomaly in western Africa may trace an asteroid impact 540 million years ago
(ESA/DTU Space/DLR)
Another high intensity region in the crust is the famous Kursk anomaly in central Russia where substantial reserves of iron ore have been mined.
The German Champ spacecraft measured Earth's magnetic field from orbit between 2000 and 2010.
It was succeeded in 2013 by the Swarm trio of satellites operated by the European Space Agency (Esa).
Champ was lower in the sky than Swarm is currently, and so found it easier to detect the lithospheric magnetism. However, the sophistication of the new mission and the subtle differences the newer satellites can sense in side-by-side observations mean further detail still can be extracted from the data.
Champ alone was getting a resolution of 300-330km, so the combined model is a big step forward.
The new space information will be fed into future versions of the WDMAM
(J.KORHONEN ET AL)
But the WDMAM would be very patchy if it did not also include space data, said Mike Purucker from the US space agency.
"The World Digital Magnetic Anomaly Map is a 5km grid at 5km altitude around the world. The longwave component is provided by satellite observations and the shorter wavelengths by aero and marine surveys.
"[The satellite data] defines better the magnetic field under the auroral ovals where it has been very difficult to separate internal from external fields," he told the BBC.
Future versions of the WDMAM will now make use of the updated Champ/Swarm view.
Having maps of crustal magnetism is important for investigating the geological history of Earth and for understanding the distribution of commercially important mineral resources, says Kathy Whaler from Edinburgh University, UK.
"[The new Swarm/Champ] model should mean estimates to the depth at which magnetisation is lost are better.
"Our assumption is this is where the temperature reaches the Curie point. There has previously been a suggestion that this is deeper in some subduction regions, as well as possibly over old, thick, stable cratons, for example.
"We should be able to estimate these depths as a function of position on the surface more accurately, and thereby understand some of the large-scale tectonics better."
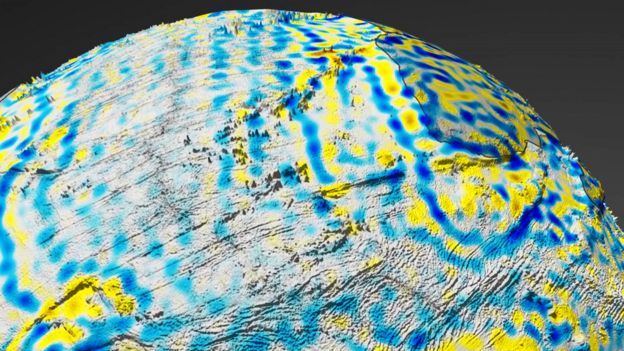
The magnetic stripes associated with seafloor spreading underpin plate tectonics theory
(Image copyright ESA/DTU Space/DLR Image caption)
Swarm itself is trying to provide greater insights on all of the different contributors to the global magnetic field.
As well as the rocks and that dominant signal coming from the swirling convection of molten iron in the core, there are other inputs pulling on the needle of every compass.
These include the magnetism generated by electric fields high above the Earth, and even a very subtle effect derived from the movement of salt water ocean currents.
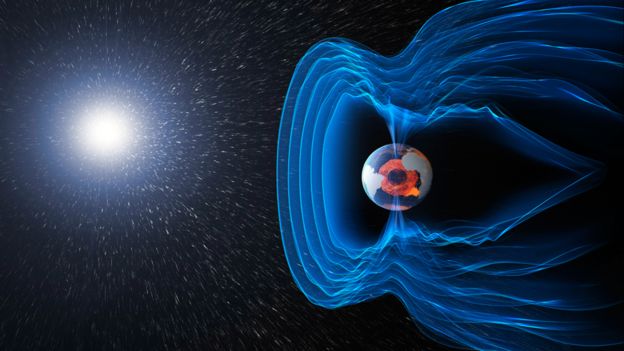
Image caption Earth's magnetic field acts as shield to deflect potentially damaging particles coming from the Sun
(Image copyright SPL)
Long-term observations will tease apart the size of each contribution and how it varies through time.
"The Bravo satellite is still at slightly above 500km and the Alpha and Charlie satellites are at 443km, roughly. So we are still at a good altitude,” said Esa's Swarm mission manager, Rune Floberghagen.
“Considering the fuel situation, we are set for a very, very long mission - far beyond the upcoming solar minimum and following solar maximum, and perhaps even up to the solar minimum after that."
This would mean at least one Swarm satellite still working in 2031.
It
is a fascinating prospect because one key to understanding Earth's
magnetic field is seeing how it interacts with the magnetic fields and
particle matter emanating from the Sun over its 11-year cycle of
activity.
"The Bravo satellite is still at slightly above 500km and the Alpha and Charlie satellites are at 443km, roughly. So we are still at a good altitude,” said Esa's Swarm mission manager, Rune Floberghagen.
“Considering the fuel situation, we are set for a very, very long mission - far beyond the upcoming solar minimum and following solar maximum, and perhaps even up to the solar minimum after that."
This would mean at least one Swarm satellite still working in 2031.
This animation shows changes in Earth's magnetic field from January to June 2014
as measured by ESA's Swarm trio of satellites.
The new lithospheric magnetic field map was presented on Tuesday at an Esa Swarm science meeting in Banff, Canada.
Links :
- GeoGarage blog : Magnetic oceans and electric Earth / Magnetic anomalies of the world's largest volcano / Earth's magnetic declination / Earth's magnetic field : lesson from ESA / World Magnetic Model updated / Dynamic Earth / Earth's magnetic field shifts / Earth's core, magnetic field changing fast, study says
No comments:
Post a Comment