What would the Earth look like if we could drain the oceans?
Accessing two previously untapped streams of satellite data, scientists at Scripps Institution of Oceanography at UC San Diego and their colleagues have created a new map of the world’s seafloor, creating a much more vivid picture of the structures that make up the deepest, least-explored parts of the ocean.
Thousands of previously uncharted mountains rising from the seafloor and new clues about the formation of the continents have emerged through the new map, which is twice as accurate as the previous version produced nearly 20 years ago
From Scripps by Mario Aguilera
Mysteries of the deep come alive as satellite data bring thousands of uncharted sea mountains and new clues about deep ocean structures into focus
Accessing two
previously untapped streams of satellite data, scientists at Scripps
Institution of Oceanography at UC San Diego and their colleagues have
created a new map of the world’s seafloor,
creating a much more vivid picture of the structures that make up the
deepest, least-explored parts of the ocean.
Thousands of previously uncharted mountains rising from the seafloor and new clues about the formation of the continents have emerged through the new map, which is twice as accurate as the previous version produced nearly 20 years ago.
Developed using a scientific model that captures gravity measurements
of the ocean seafloor, the new map extracts data from the European
Space Agency’s (ESA) CryoSat-2 satellite, which primarily captures polar
ice data but also operates continuously over the oceans, and Jason-1,
NASA’s satellite that was redirected to map the gravity field during the
last year of its 12-year mission.


Combined with existing data and drastically improved remote sensing instruments, the new map, described in the journal Science, has revealed details of thousands of undersea mountains, or seamounts, extending a kilometer or more from the ocean bottom.
The new map also gives geophysicists new tools to investigate ocean spreading centers and little-studied remote ocean basins.
“The kinds of things you can see very clearly now are abyssal hills, which are the most common land form on the planet,” said David Sandwell, lead scientist of the paper and a geophysics professor in the Cecil H. and Ida M. Green Institute of Geophysics and Planetary Physics (IGPP) at Scripps.


The authors of the study say the map provides a new window into the tectonics of the deep oceans. Previously unseen features in the map include newly exposed continental connections across South America and Africa, and new evidence for seafloor spreading ridges at the Gulf of Mexico that were active 150 million years ago and are now buried by mile-thick layers of sediment.

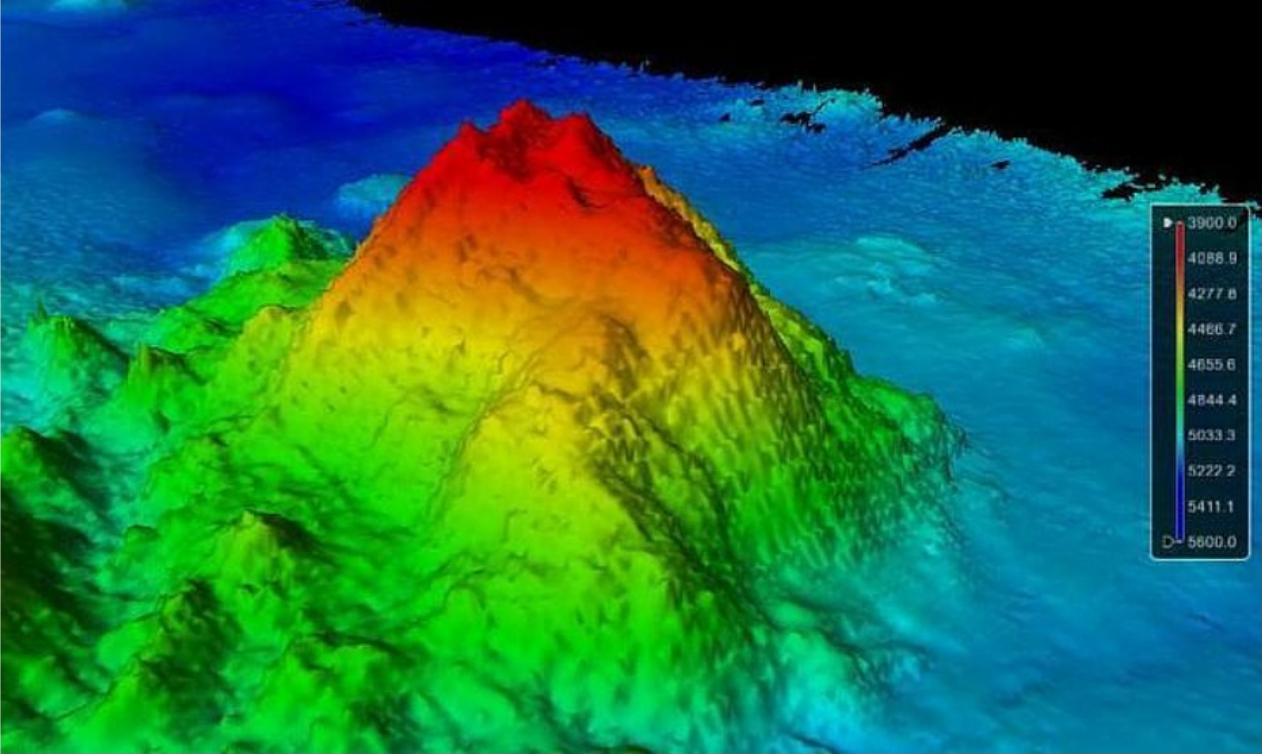
The high-resolution multibeam sonar bathymetry data show that the newly charted seamount is not very prominent and rises just over 600 m from its base.
The summit of the seamount rises 1,100 meters from the 5,100-meter-deep ocean floor.
(3D view of the SouthWest side of the seamount with 23° slopes)
“One of the most important uses of this new marine gravity field will be to improve the estimates of seafloor depth in the 80 percent of the oceans that remains uncharted or is buried beneath thick sediment,” the authors say in the report.
“Although CryoSat-2’s primary mission is in the cryosphere, we knew as soon as we selected its orbit that it would be invaluable for marine geodesy, and this work proves the point,” said Richard Francis, a coauthor of the paper and project manager for the development of CryoSat-2 at the European Space Agency, and honorary professor in the Department of Earth Sciences at University College London.

The new map also provides the foundation for the upcoming new version of Google’s ocean maps to fill large voids between shipboard depth profiles.
“The team has developed and proved a powerful new tool for high-resolution exploration of regional seafloor structure and geophysical processes,” says Don Rice, program director in the National Science Foundation’s (NSF) Division of Ocean Sciences.
“This capability will allow us to revisit unsolved questions and to pinpoint where to focus future exploratory work.”
“The use of satellite altimeter data and Sandwell’s improved data processing technique provides improved estimates of marine gravity and bathymetry world-wide, including in remote areas,” said Joan Cleveland, Office of Naval Research (ONR) deputy director, Ocean Sensing and Systems Division. “Accurate bathymetry and identifying the location of seamounts are important to safe navigation for the U.S. Navy.”

In addition to Sandwell and Francis, coauthors of the paper include R. Dietmar Muller of the University of Sydney, Walter Smith of the NOAA Laboratory for Satellite Altimetry, and Emmanuel Garcia of Scripps.
The study was supported by NSF, ONR, the National Geospatial-Intelligence Agency, and ConocoPhillips.
Links :
Thousands of previously uncharted mountains rising from the seafloor and new clues about the formation of the continents have emerged through the new map, which is twice as accurate as the previous version produced nearly 20 years ago.
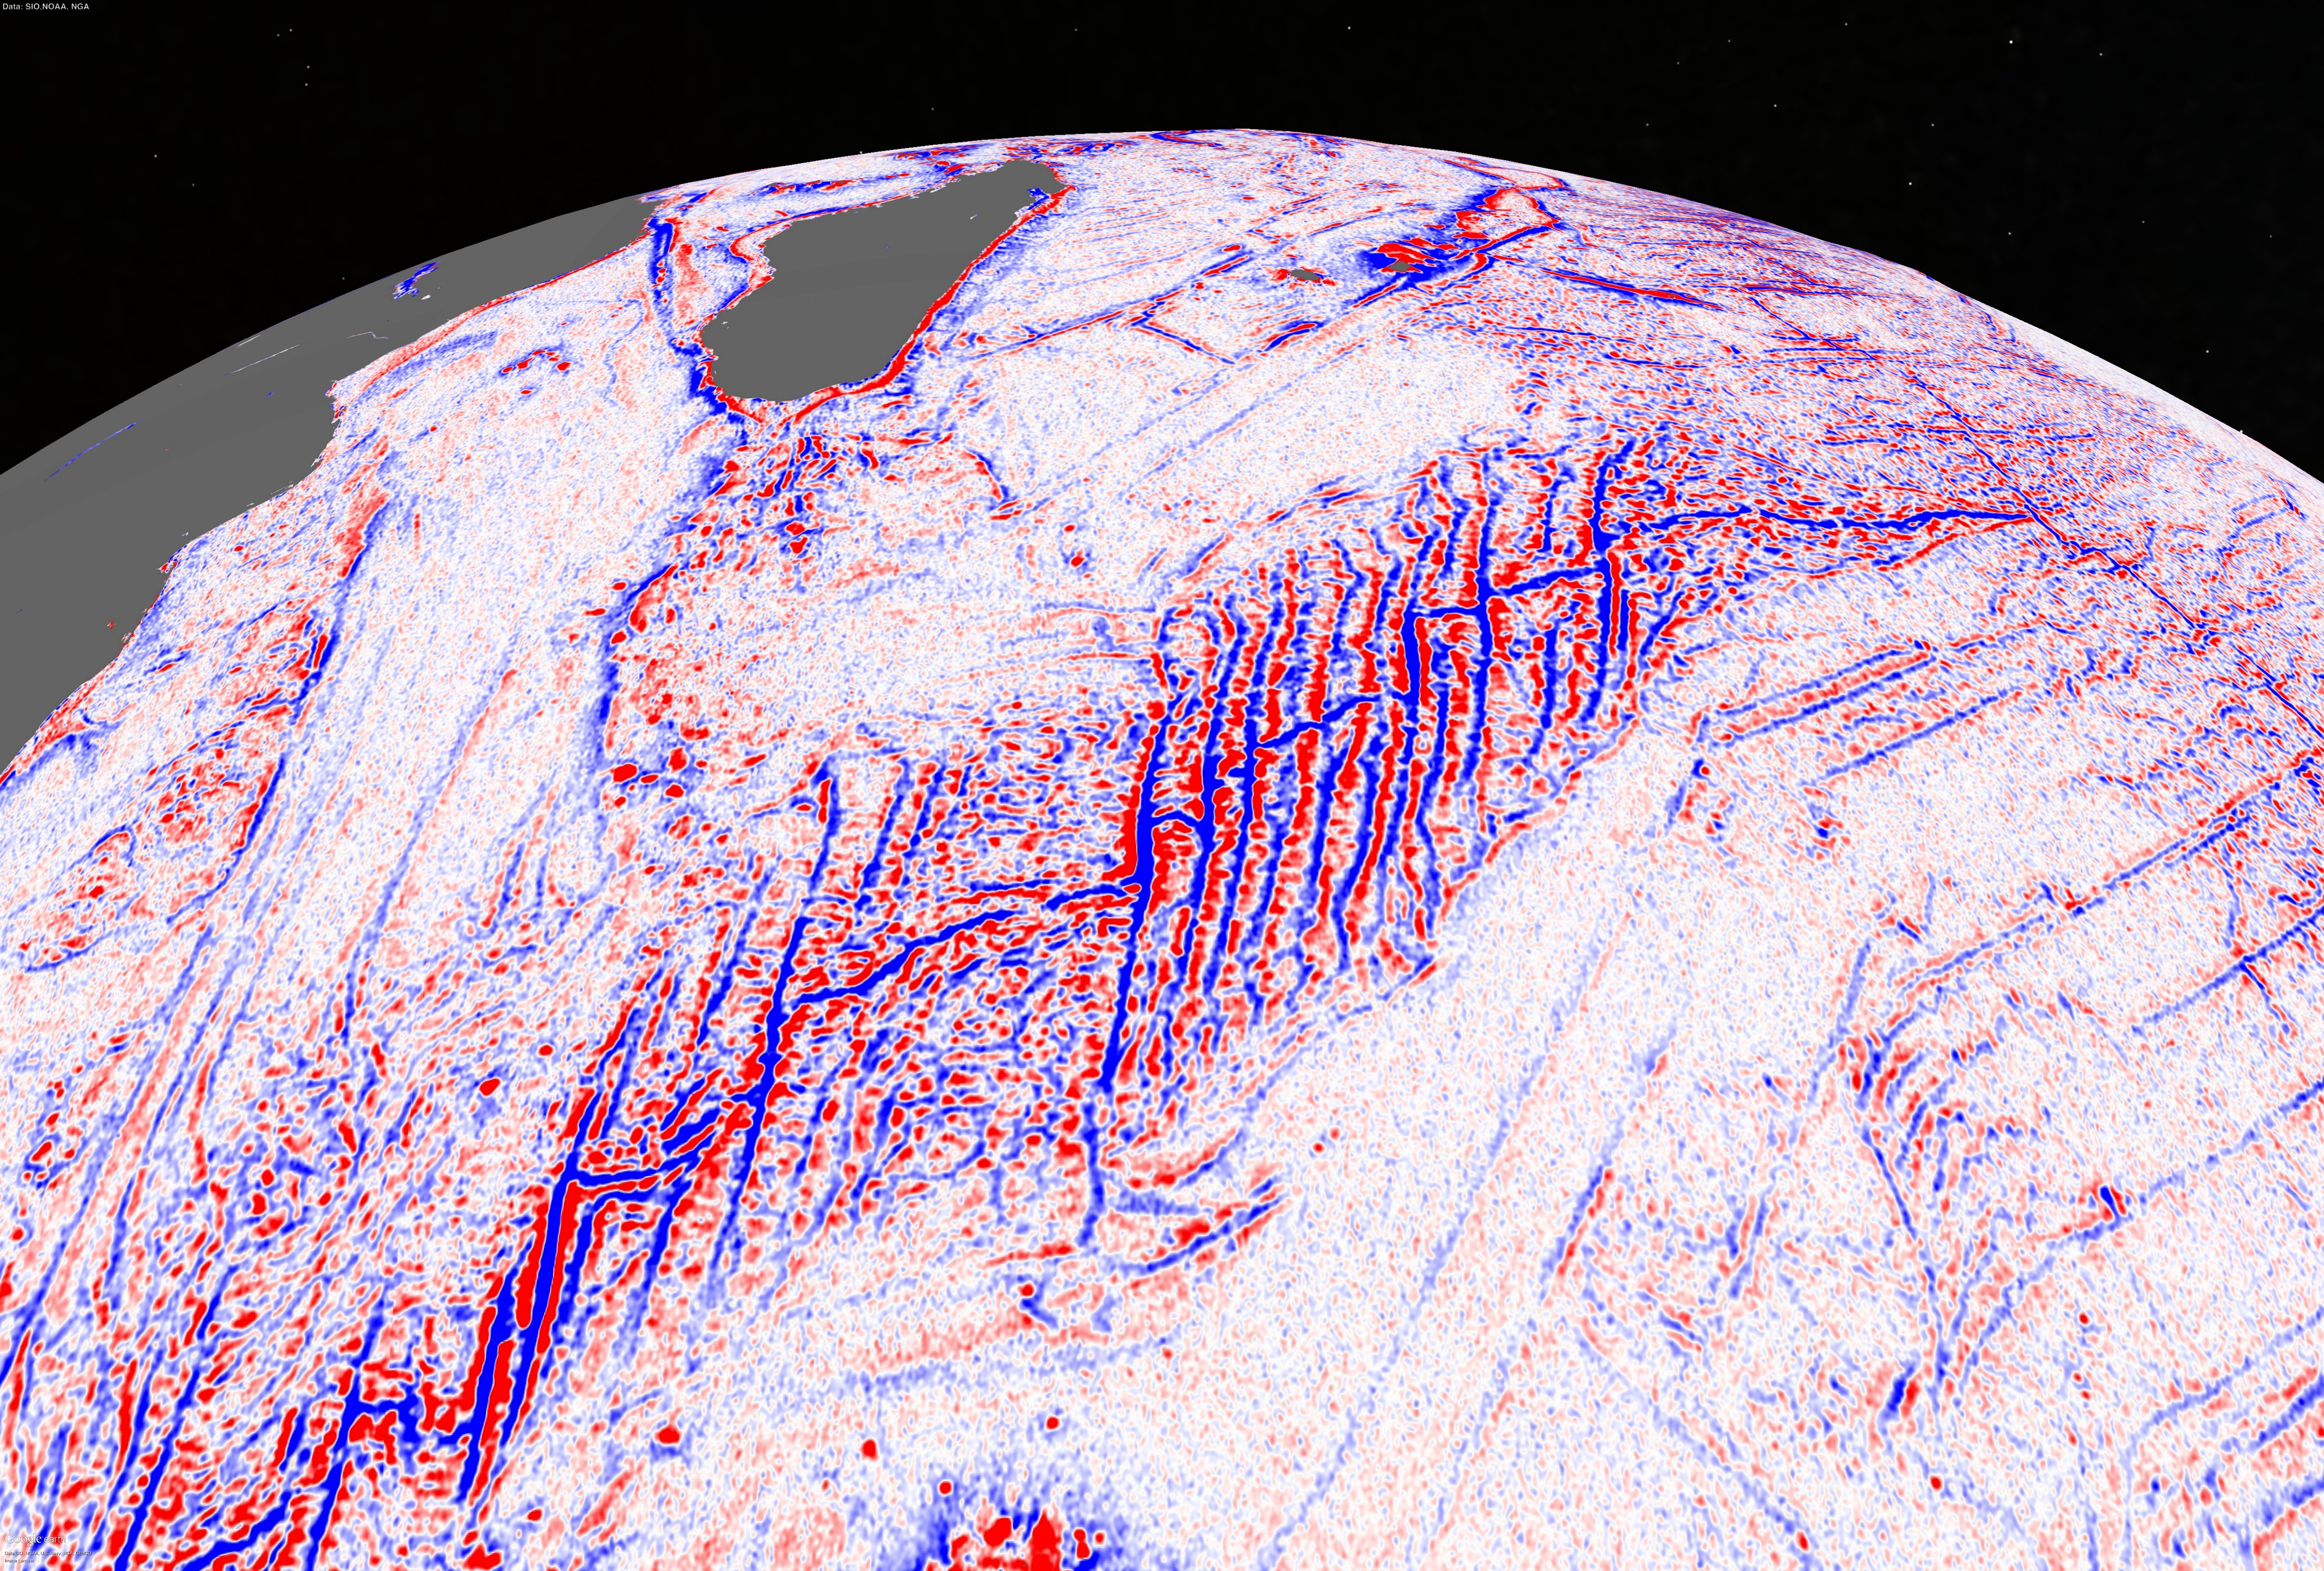
Global map of marine gravity
(image: David Sandwell)
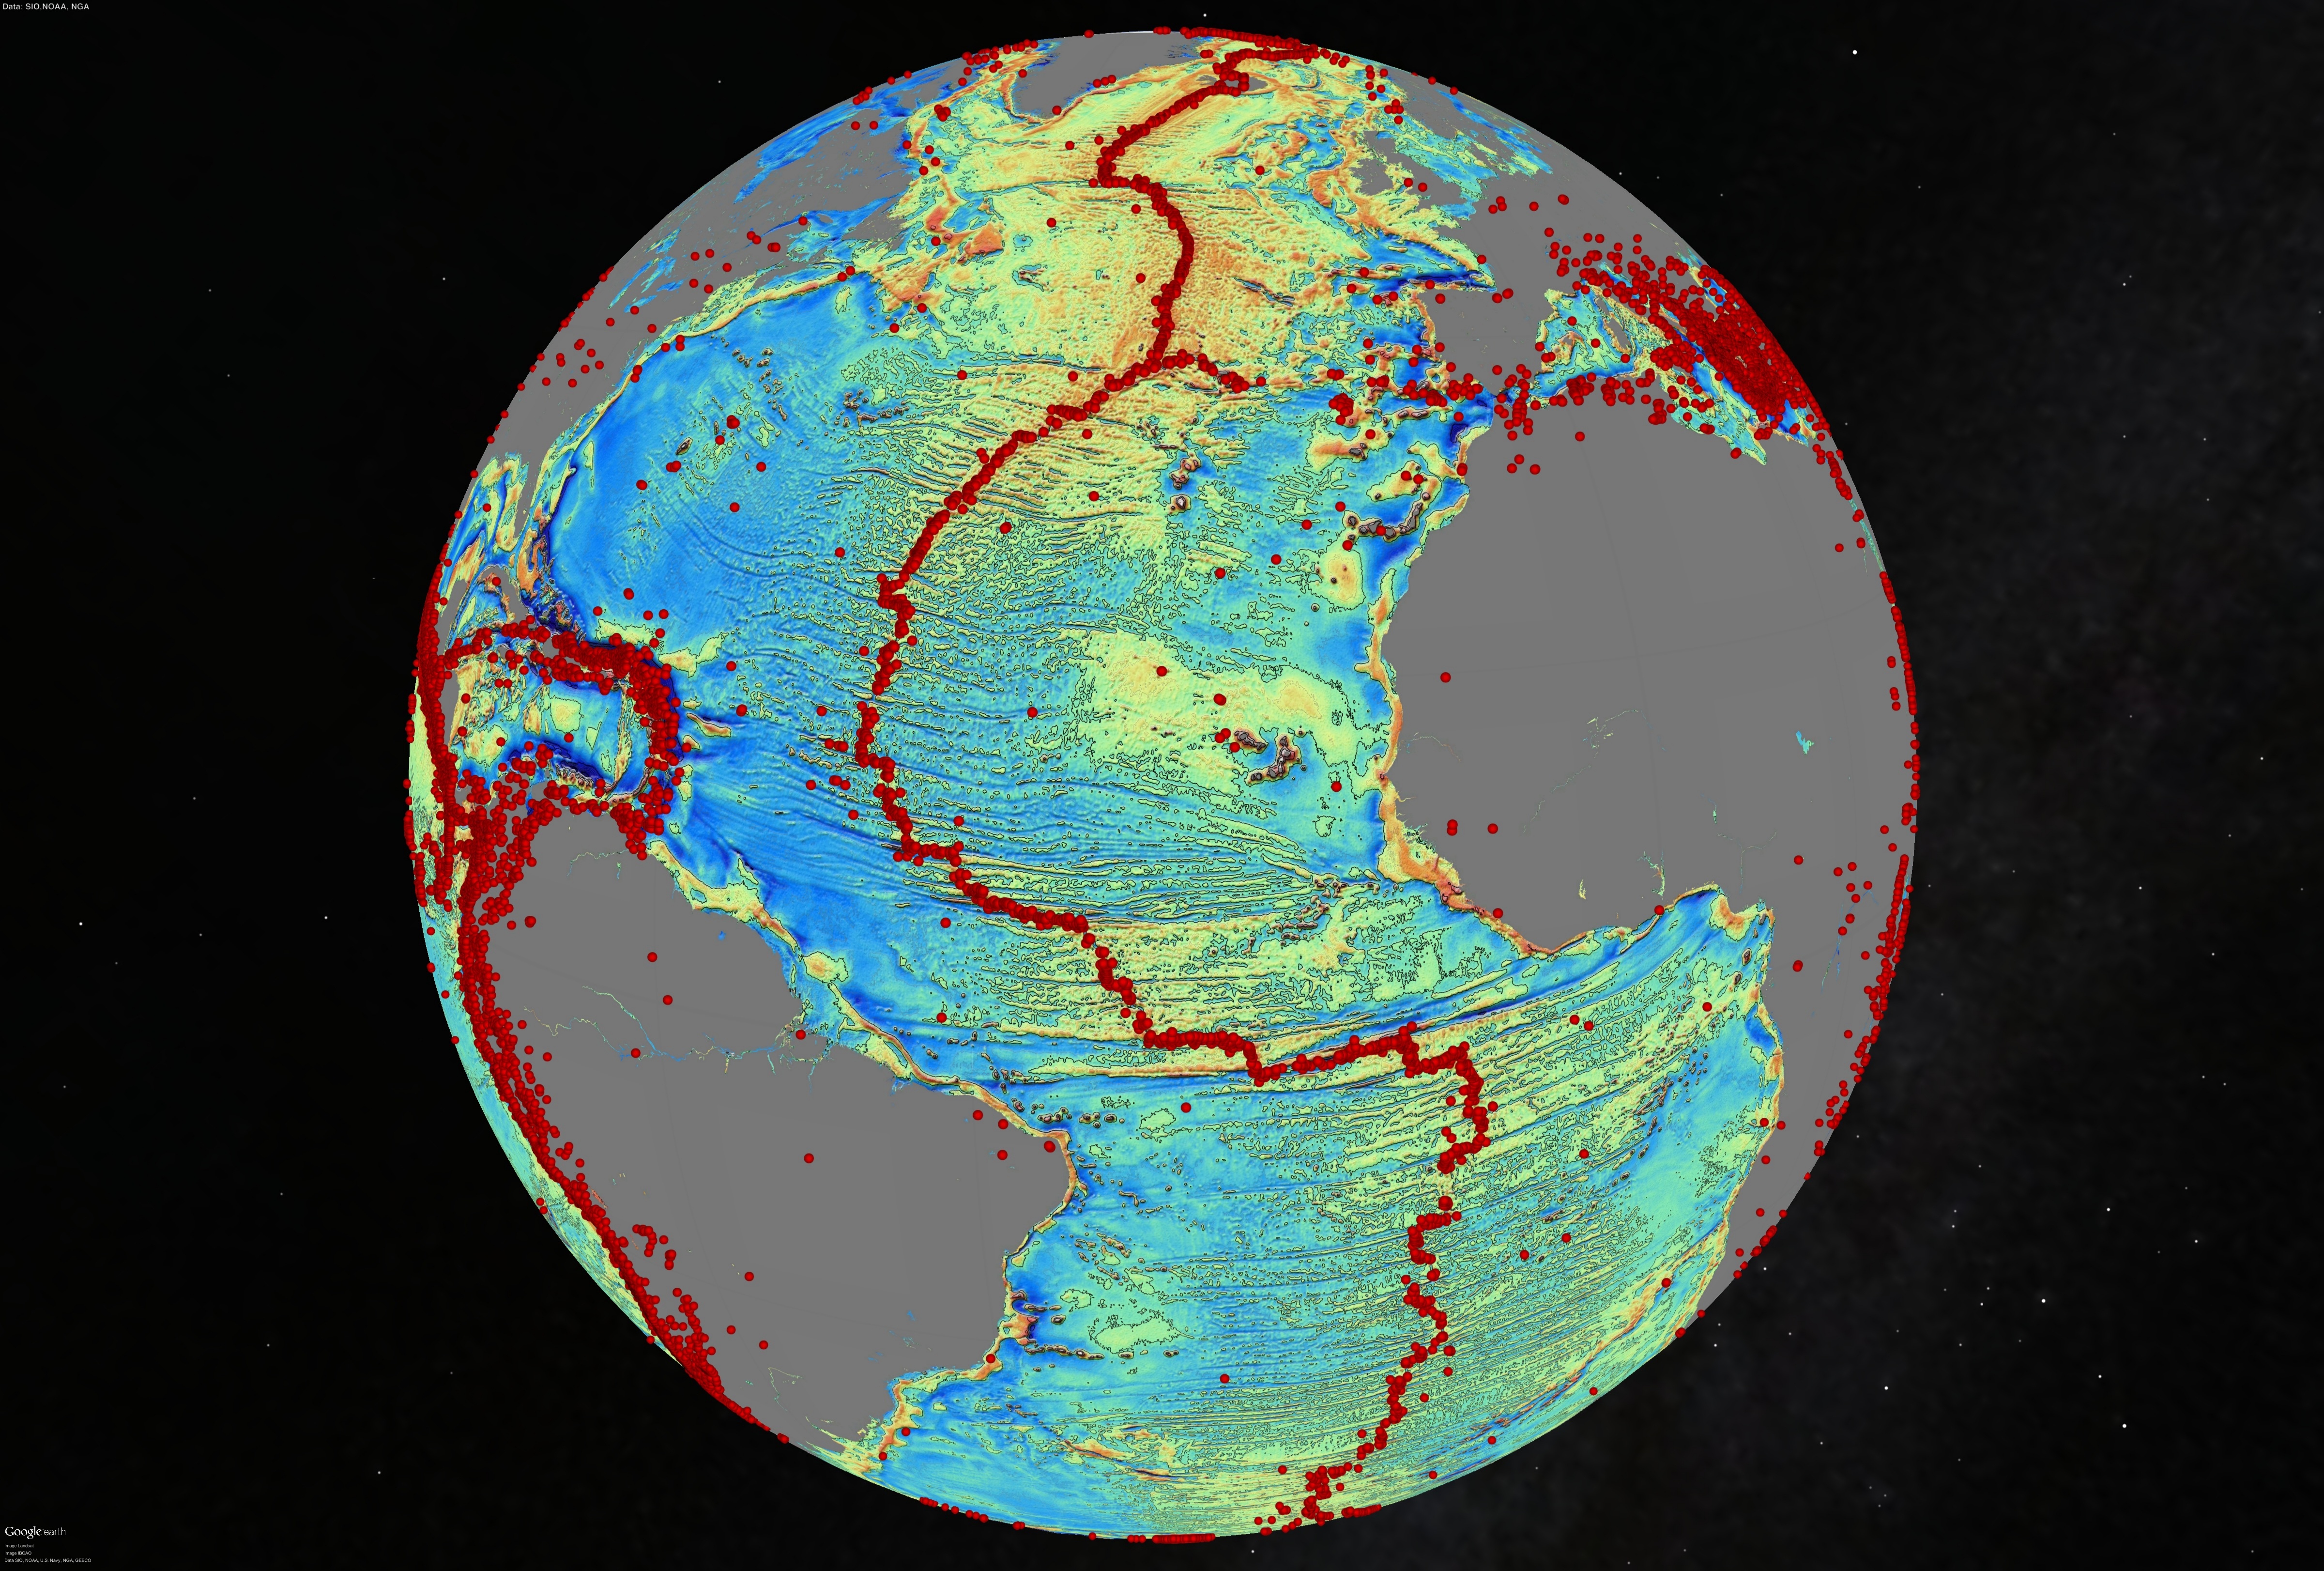
Marine gravity model of the North Atlantic (10 mGal contours).
Red dots show locations of earthquakes with magnitude > 5.5 and they highlight the present-day location of the seafloor spreading ridges and transform faults.
This gravity information shows the details of the plate tectonic history of the rifting of these continents including the subtle signatures of fracture zones that are currently buried by sediment.
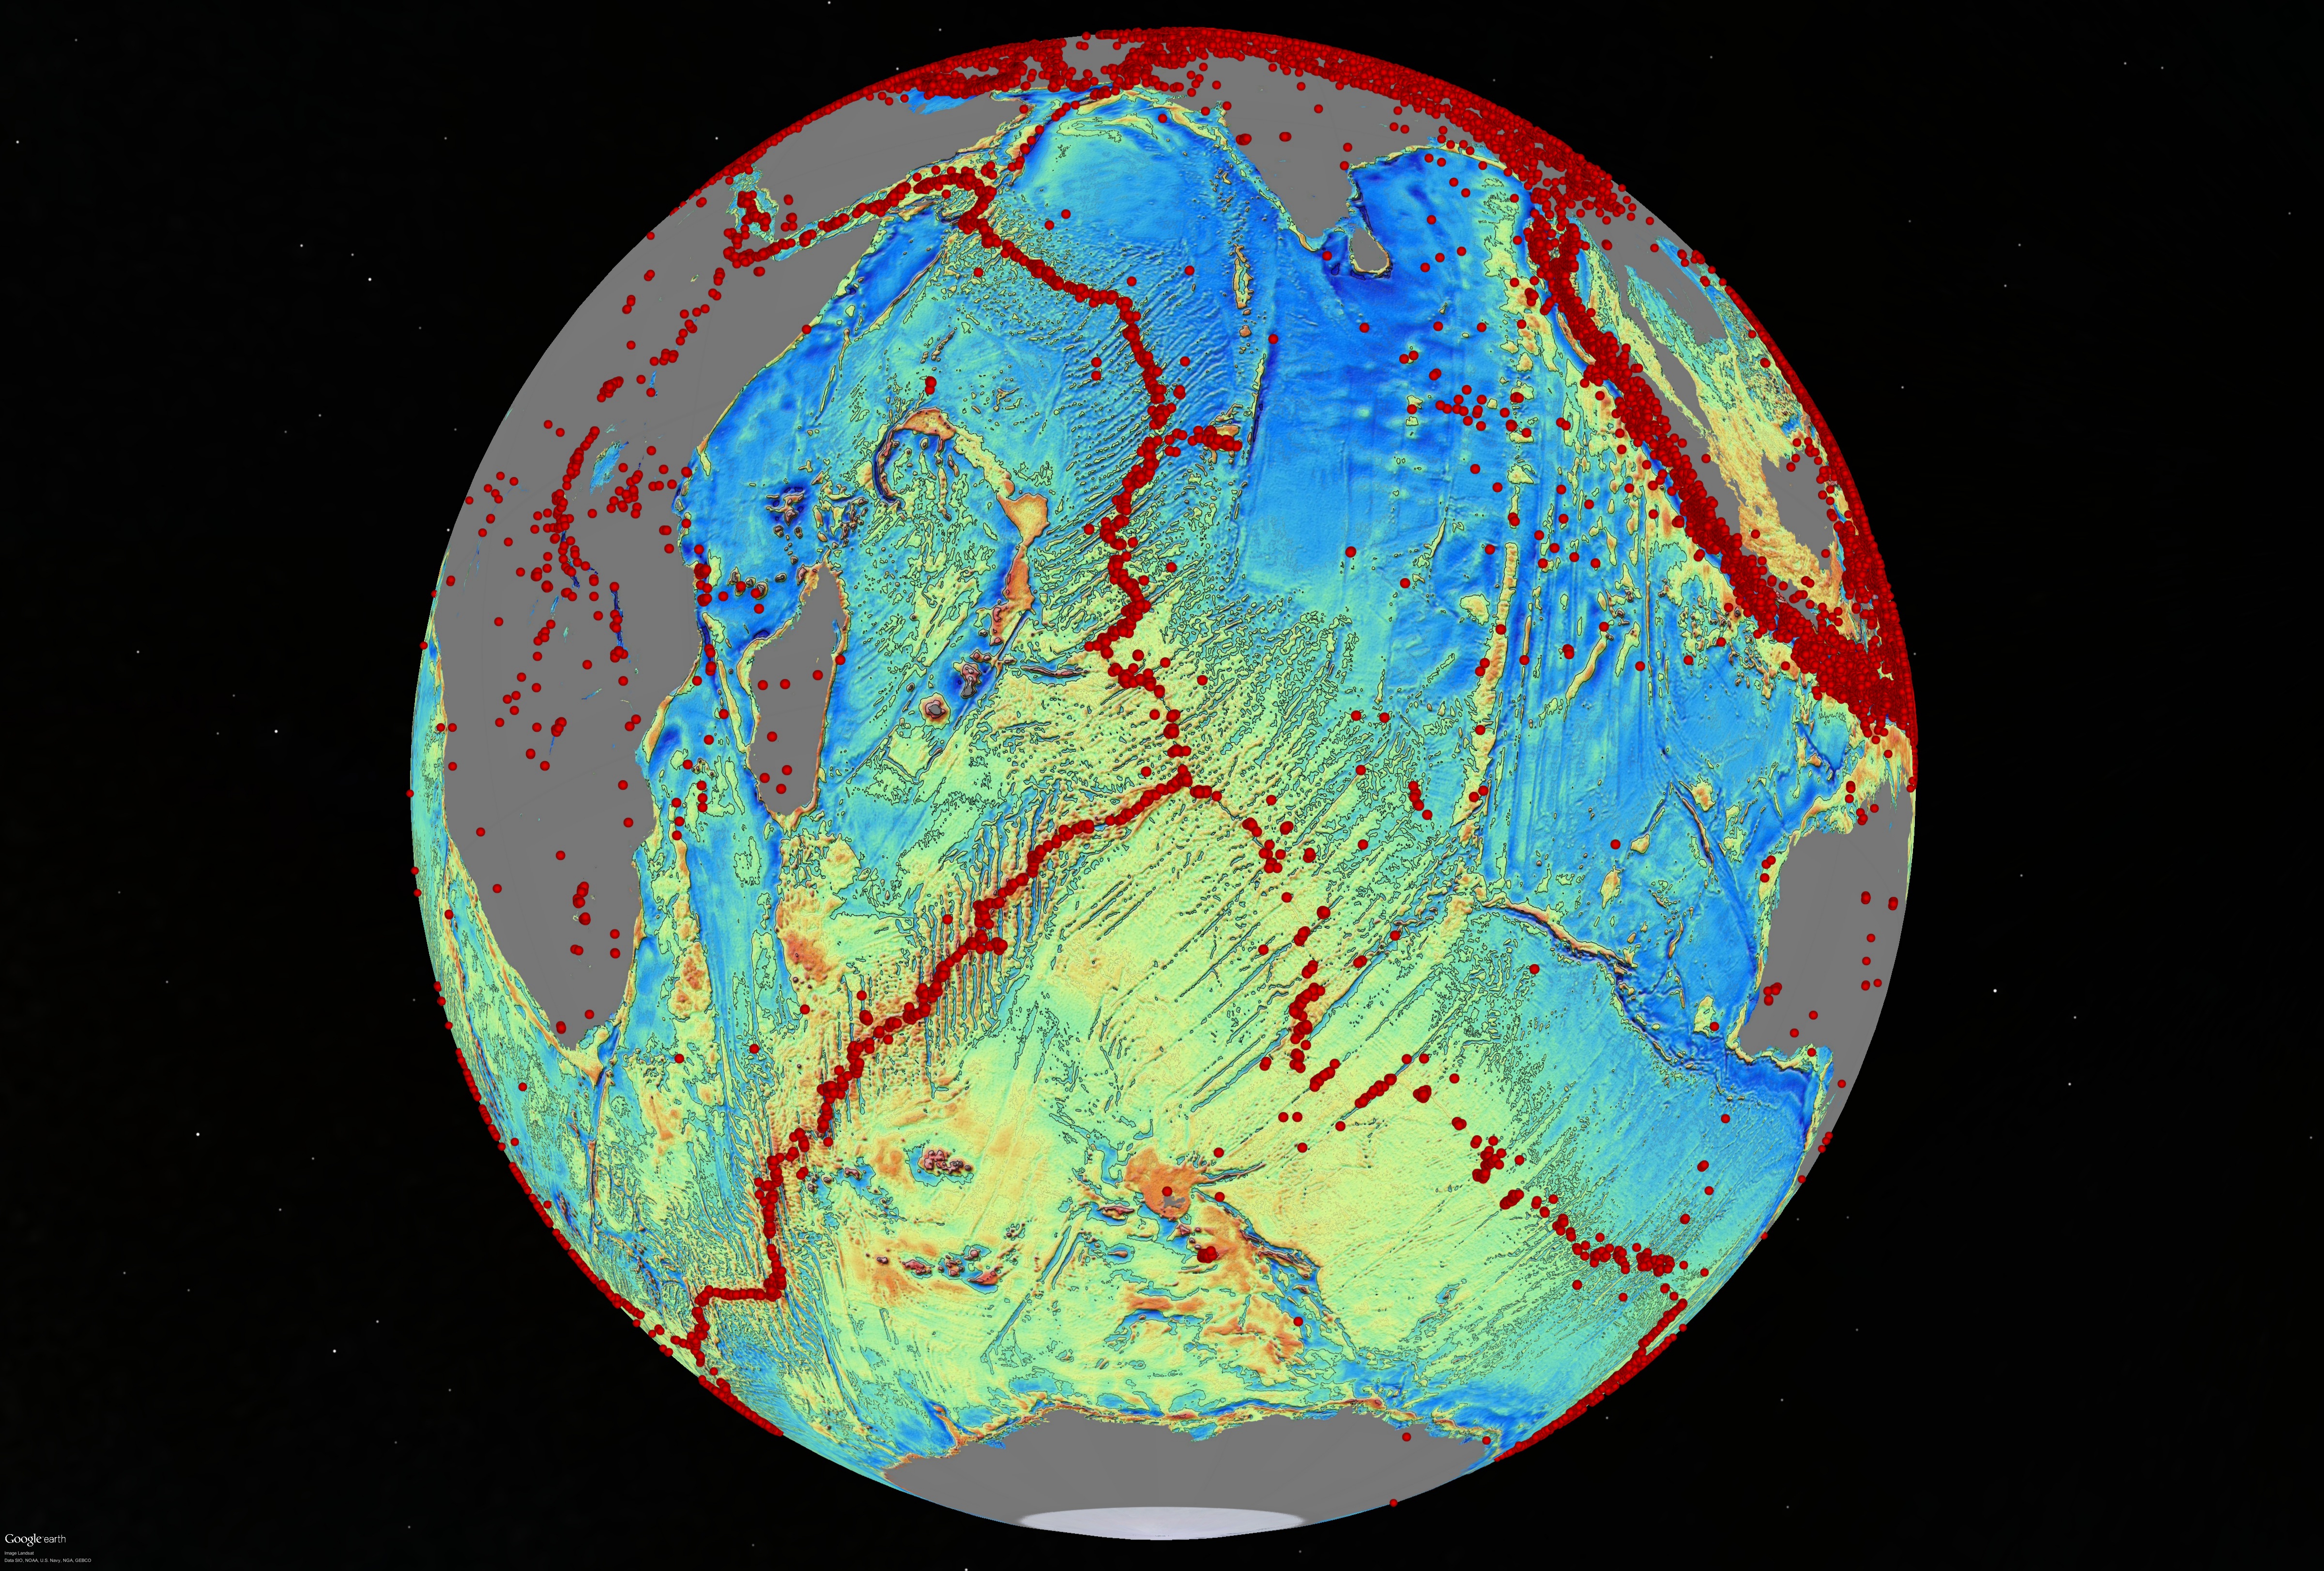
Marine gravity model of the Central Indian Ocean (10 mGal contours). Red dots show locations of earthquakes with magnitude > 5.5 and they highlight the present-day location of the seafloor spreading ridges and transform faults.
The image is centered at the Indian Ocean Triple Junction where three major tectonic plates meet (African plate – left; Indo-Australian plate – right; Antarctic plate bottom.
This region of the Indian Ocean is very poorly charted and includes the search area for the Malaysian flight MH370 that was lost March 8, 2014.
Combined with existing data and drastically improved remote sensing instruments, the new map, described in the journal Science, has revealed details of thousands of undersea mountains, or seamounts, extending a kilometer or more from the ocean bottom.
The new map also gives geophysicists new tools to investigate ocean spreading centers and little-studied remote ocean basins.
“The kinds of things you can see very clearly now are abyssal hills, which are the most common land form on the planet,” said David Sandwell, lead scientist of the paper and a geophysics professor in the Cecil H. and Ida M. Green Institute of Geophysics and Planetary Physics (IGPP) at Scripps.
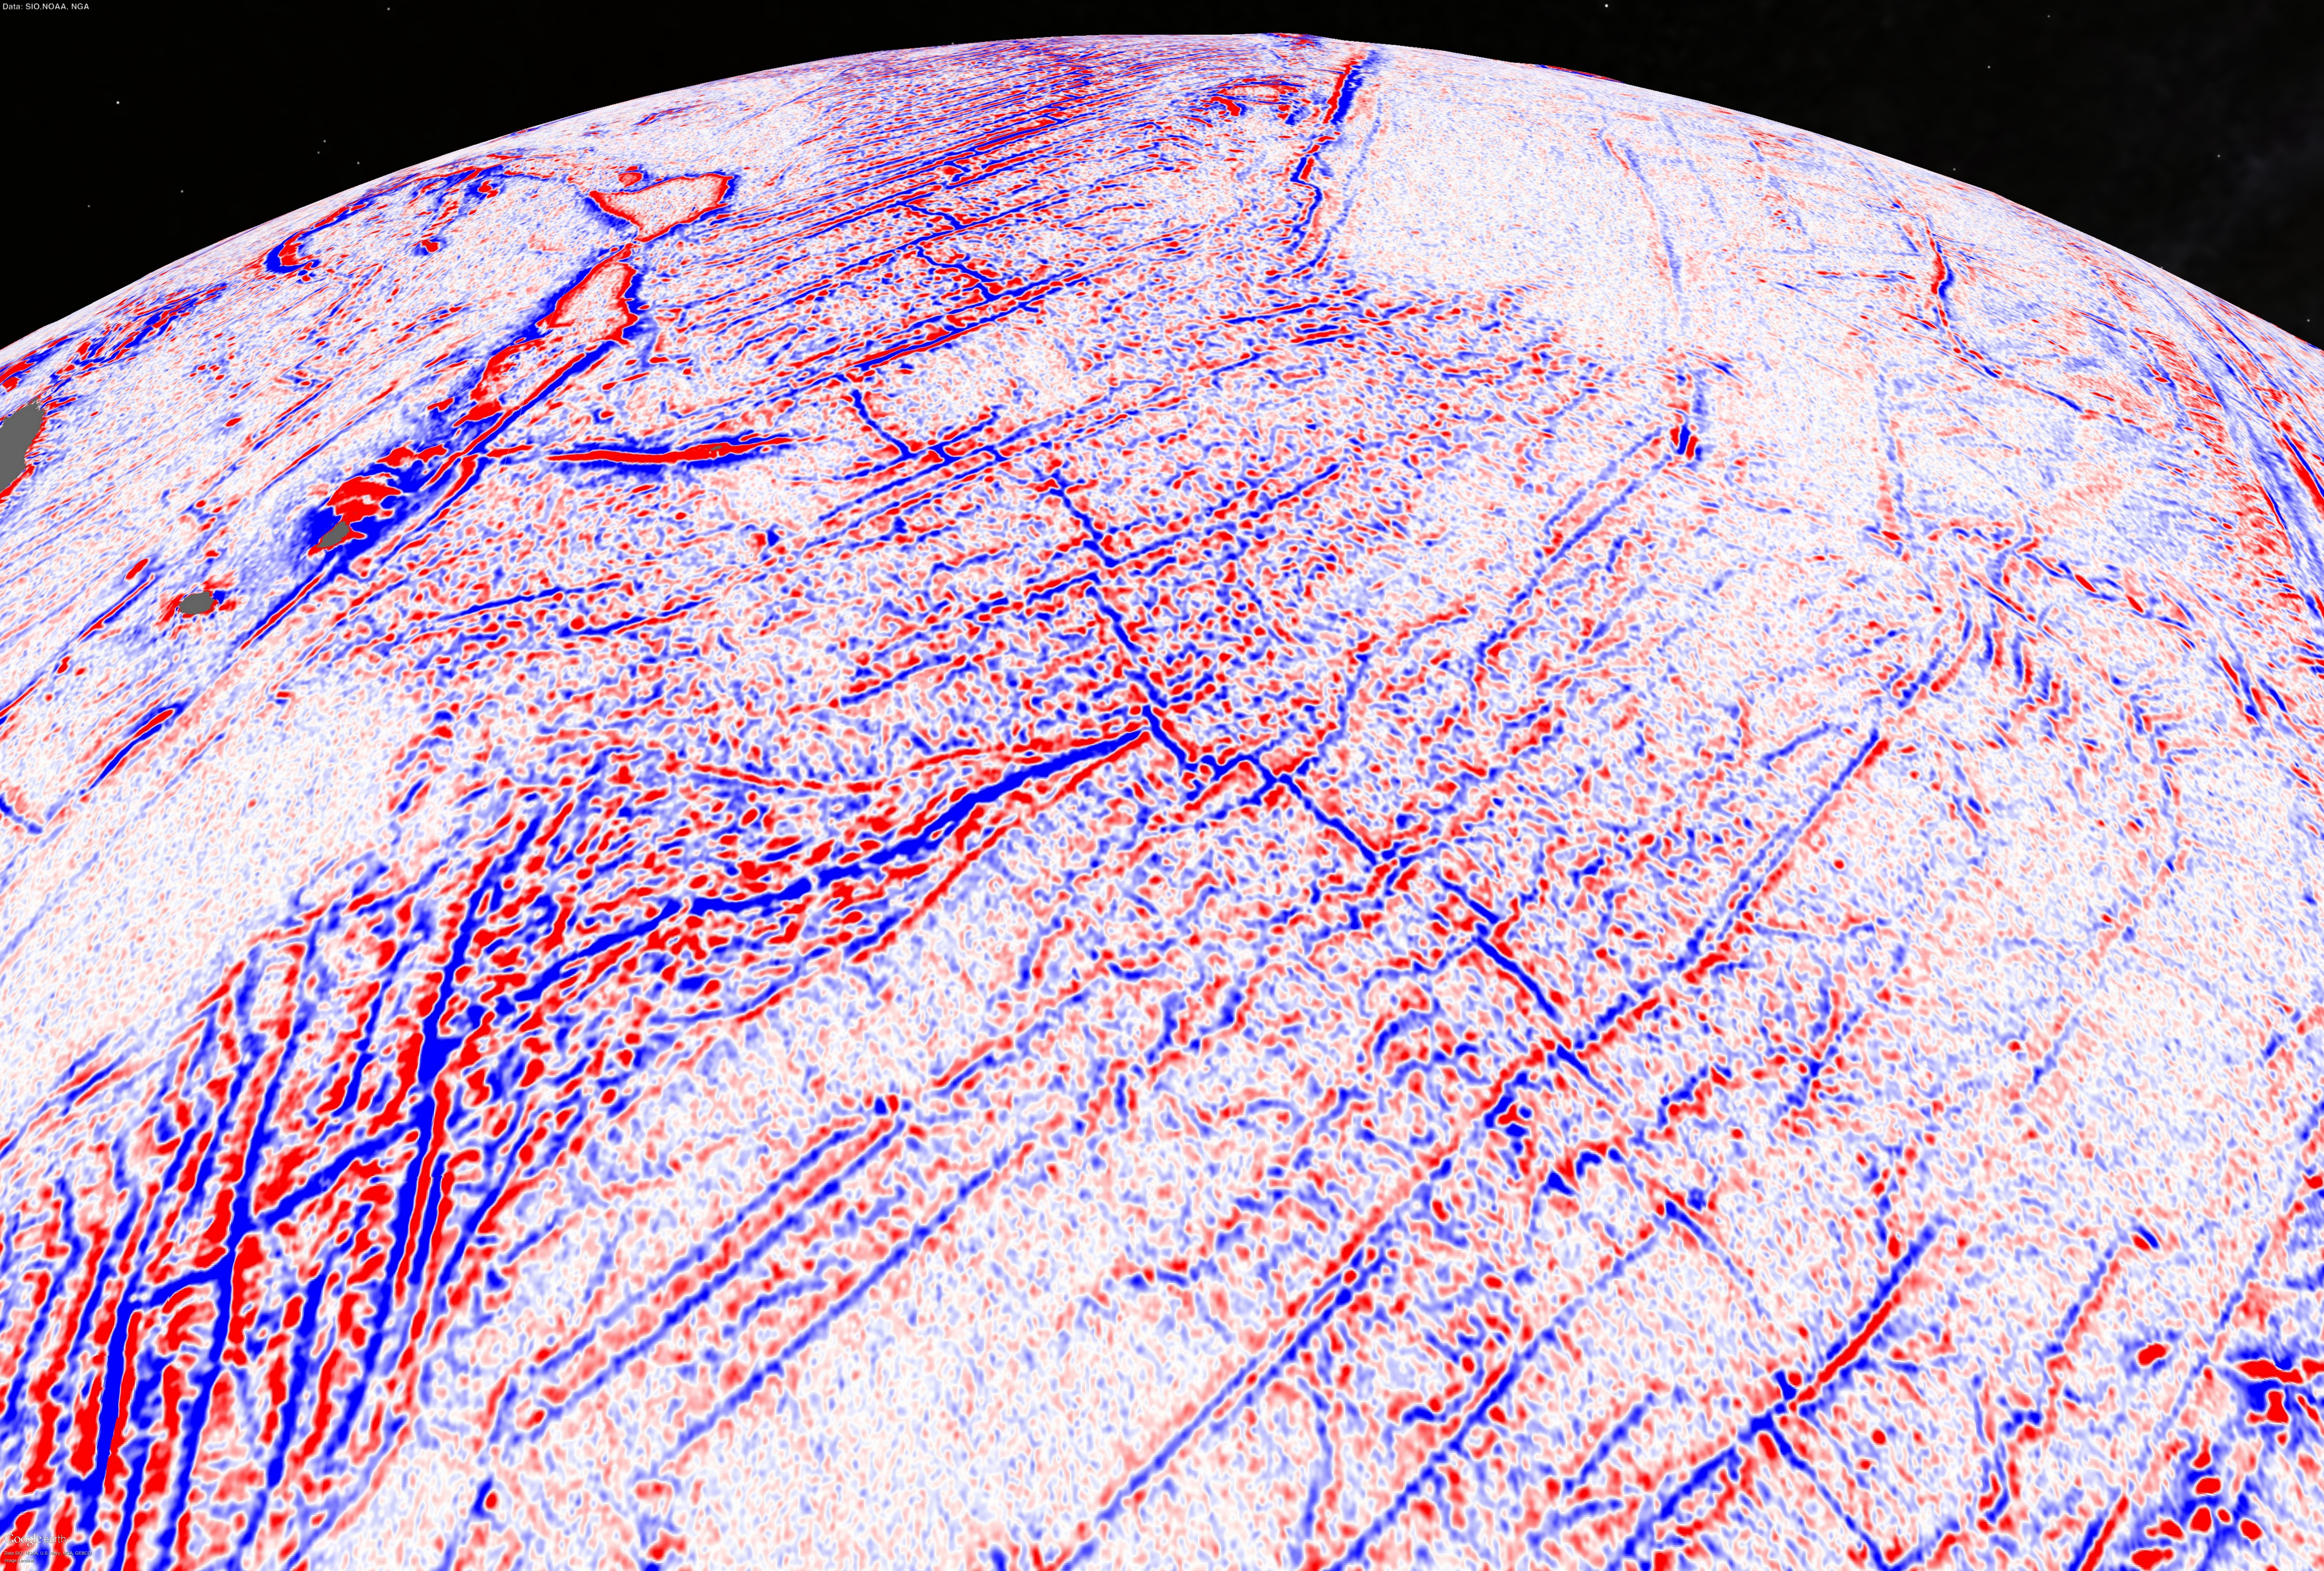
Vertical gravity gradient (VGG) model of the Indian Ocean Triple Junction.
The image is centered at the Indian Ocean Triple Junction where three major tectonic plates meet (African plate – left; Indo-Australian plate – right; Antarctic plate bottom.
Vertical gravity gradient (VGG) model of the Southwest Indian Ridge.
This is the slowest spreading ridge on the Earth and has large fracture zone signatures that record the rifting and spreading between Africa and Antarctica.
The authors of the study say the map provides a new window into the tectonics of the deep oceans. Previously unseen features in the map include newly exposed continental connections across South America and Africa, and new evidence for seafloor spreading ridges at the Gulf of Mexico that were active 150 million years ago and are now buried by mile-thick layers of sediment.
The high-resolution multibeam sonar bathymetry data show that the newly charted seamount is not very prominent and rises just over 600 m from its base.
The summit of the seamount rises 1,100 meters from the 5,100-meter-deep ocean floor.
(3D view of the SouthWest side of the seamount with 23° slopes)
However, it's wide enough to be detected in the gravity signal.
- courtesy of Larry Mayer, University New Hampshire -
“One of the most important uses of this new marine gravity field will be to improve the estimates of seafloor depth in the 80 percent of the oceans that remains uncharted or is buried beneath thick sediment,” the authors say in the report.
“Although CryoSat-2’s primary mission is in the cryosphere, we knew as soon as we selected its orbit that it would be invaluable for marine geodesy, and this work proves the point,” said Richard Francis, a coauthor of the paper and project manager for the development of CryoSat-2 at the European Space Agency, and honorary professor in the Department of Earth Sciences at University College London.

Interpolation of ocean-floor shape by satellite
- Most ocean maps are derived from satellite altimeter measurements
- Satellites infer ocean-floor features from the shape of the sea surface
- They detect surface height anomalies driven by variations in local gravity
- The gravity from the extra mass of mountains makes the water pile up
- In lower-mass regions, such as over trenches, the sea-surface will dip
- Limited high-resolution ship data has calibrated the satellites' maps
The new map also provides the foundation for the upcoming new version of Google’s ocean maps to fill large voids between shipboard depth profiles.
“The team has developed and proved a powerful new tool for high-resolution exploration of regional seafloor structure and geophysical processes,” says Don Rice, program director in the National Science Foundation’s (NSF) Division of Ocean Sciences.
“This capability will allow us to revisit unsolved questions and to pinpoint where to focus future exploratory work.”
“The use of satellite altimeter data and Sandwell’s improved data processing technique provides improved estimates of marine gravity and bathymetry world-wide, including in remote areas,” said Joan Cleveland, Office of Naval Research (ONR) deputy director, Ocean Sensing and Systems Division. “Accurate bathymetry and identifying the location of seamounts are important to safe navigation for the U.S. Navy.”
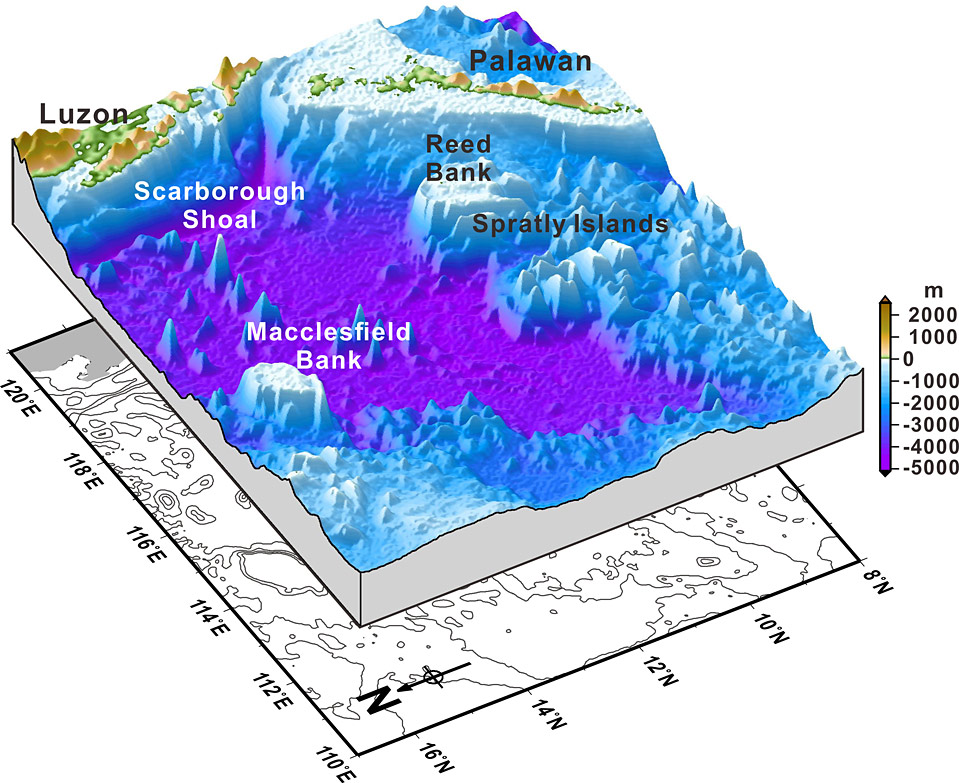
Depths over seamounts, including Reed Bank and Palawan, in the South China Sea are pictured
In addition to Sandwell and Francis, coauthors of the paper include R. Dietmar Muller of the University of Sydney, Walter Smith of the NOAA Laboratory for Satellite Altimetry, and Emmanuel Garcia of Scripps.
The study was supported by NSF, ONR, the National Geospatial-Intelligence Agency, and ConocoPhillips.
Links :
- BBC : Satellites detect 'thousands' of new ocean-bottom mountains / map in 3d
- NationalGeographic : Interpolation of ocean-floor shape by satellite
- Wired : Super-detailed interactive 3-D seafloor map
- Nature : Gravity map uncovers sea-floor surprises
- SciencesMag : Satellites reveal hidden features at the bottom of Earth's seas
- Retracking CryoSat-2, Envisat and Jason-1 radar altimetry waveforms for improved gravity field recovery
Quartz : Amazing new maps of the ocean floor
ReplyDeleteUT SanDiego : New map offers deepest detail of ocean depths
ReplyDelete