
With over 4,000 kms of shoreline and some of the richest fishing grounds in the world off its coast, Chile is ranked globally as the eighth largest fishing nation.
Today, Chile took a stand to safeguard our Vibrant Oceans by working with Global Fishing Watch and Oceana to publish their vessel tracking data, which will help improve surveillance and encourage vessels to comply with regulations.
From GlobalFishingWatch by Brian Wong
At Global Fishing Watch, we use cutting-edge technology to visualize, track and share data about global fishing activity in near real-time and for free.
Our primary dataset comes from data about a vessel’s identity, type, location, speed, direction and more that is broadcast using the Automatic Identification System (AIS) and collected via satellites and terrestrial receivers.
We analyze AIS data collected from vessels that our research has identified as known or possible commercial fishing vessels, and apply a fishing detection algorithm to determine “apparent fishing activity” based on changes in vessel speed and direction.
The algorithm classifies each AIS broadcast data point for these vessels as either apparently fishing or not fishing and shows the former on our fishing activity heat map.
This allows us to currently track more than 65,000 fishing vessels.
The radar advantage
Our technology is revolutionary for tracking commercial fishing activity, but monitoring AIS still leaves a significant portion of global fishing activity from vessels that do not use the trackers unaccounted for.
What if we could see these unaccounted fishing vessels? What new research questions could we ask or fresh insights might be drawn from this new perspective? We’ve been exploring this idea using another form of cutting-edge technology, radar imagery from space.
Why radar? A physical property allows it to “see through” clouds.
Not having to deal with constant cloud coverage—typically two-thirds of our planet at any moment—provides a quicker pathway to discovering potentially interesting trends.
Check out the comparison of a radar and optical scene below.
Those bright spots in the red box are vessels otherwise covered up by clouds in optical imagery.
Unclassified radar detections
We’ve been developing methodology to automatically detect vessels from radar imagery.
However, our approach also detects non-vessel objects—typically fixed infrastructure like wind turbines and oil and gas platforms.
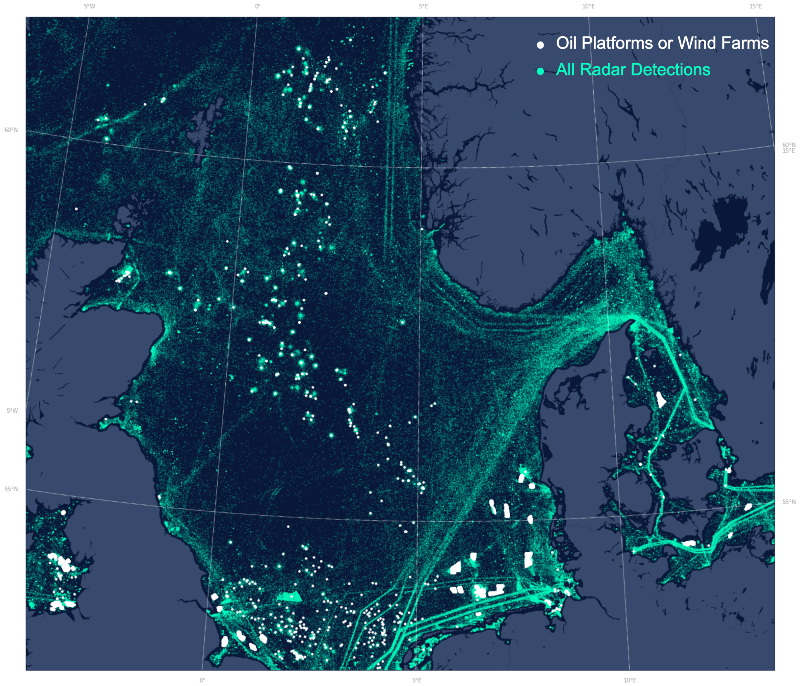
Below is a year’s worth of radar detections in the North Sea.
Clear transportation patterns jump out, but some more peculiar patterns are visible if you inspect close enough: the clusters in the box are oil and gas platforms, while the more geometric patterns pointed out by the arrows are wind farms.
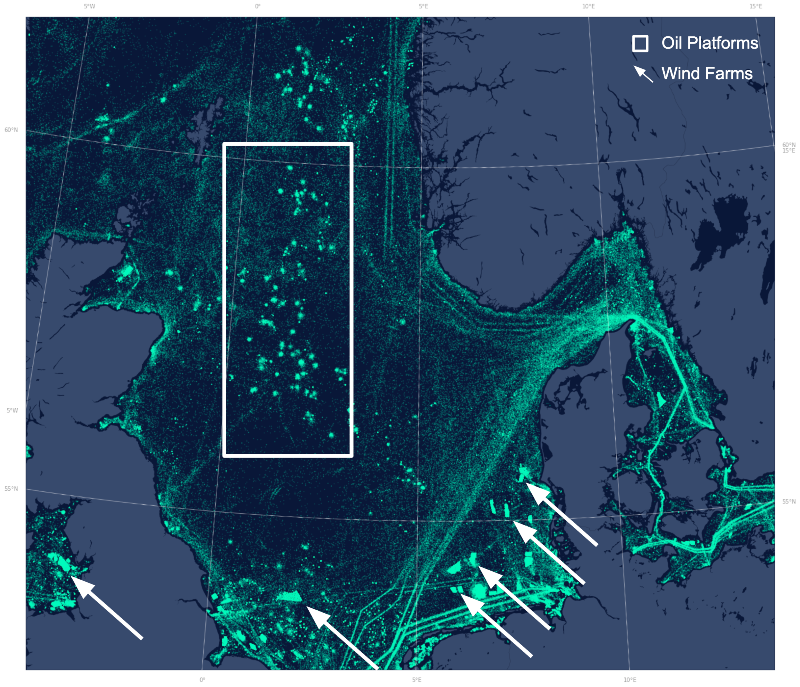
To learn if the new radar data might elucidate new information unavailable via AIS, we needed to compare apples to apples, which meant filtering the radar detections to only vessels by removing all fixed infrastructure.
The fixed infrastructure would otherwise heavily bias the detections since they would likely be observed on every pass.
We hoped there was already an existing dataset to assist, and although disparate wind turbine and oil and gas platforms datasets were available, none met the requirements we needed.
So, we developed another method to map the fixed infrastructure in order to “subtract” it from the cumulative radar detections.
Specifically, we used the Gulf of Mexico, North Sea, and East China Sea to develop the methodology due to available ground-truth data.
These sites also allowed us to examine the generalizability of the method since two types of fixed infrastructure (oil and gas platforms and wind turbines) were included.
We drew on two strings of the literature for our methodology: a radar-based peak detection algorithm called CFAR and OpenCV’s blob detection (Rohling, 1983; Walt et.
al, 2014).
What does our algorithm do?
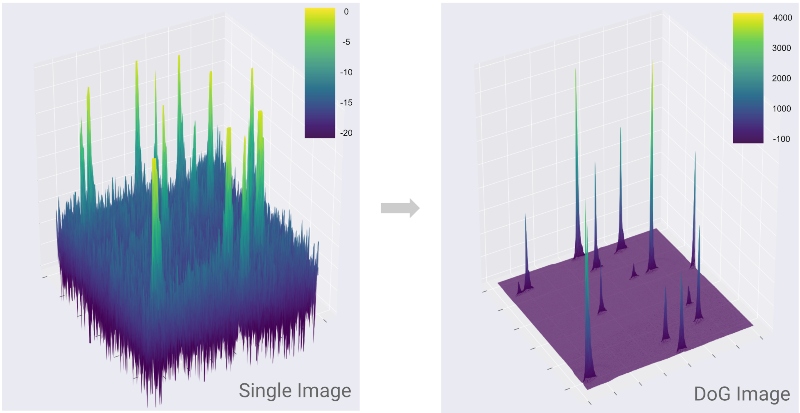
Check out the full methodology here in the paper, but its novelty can be observed by the drastic change from left to right plot below.
It maximizes the signal of the fixed infrastructure (wind turbines and oil platforms) yet concurrently minimizes the signal of the background ocean area.
This improves the detection of fixed infrastructure represented by those peaks.
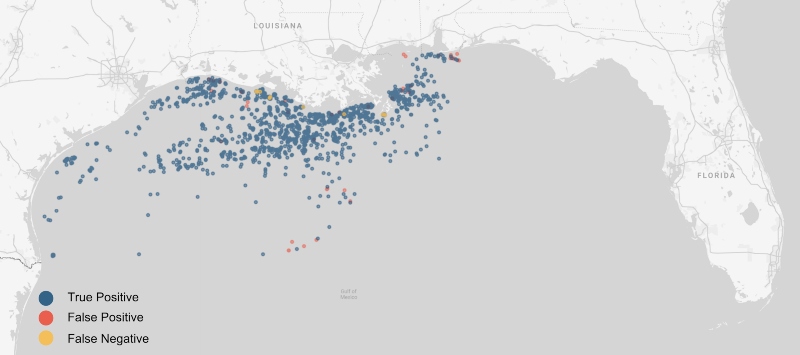
Gulf of Mexico oil platform detection
Our algorithm included seven adjustable parameters.
It was unclear which combination would perform the best so we used Google Earth Engine to find the optimal parameters.
We tested 480 permutations further characterized in Table 1 of the paper.
Check out the top performing model results below.
It correctly detected 1,672 platforms (blue dots), incorrectly detected 46 objects (false positives in red), and missed 22 platforms (false negatives in yellow).
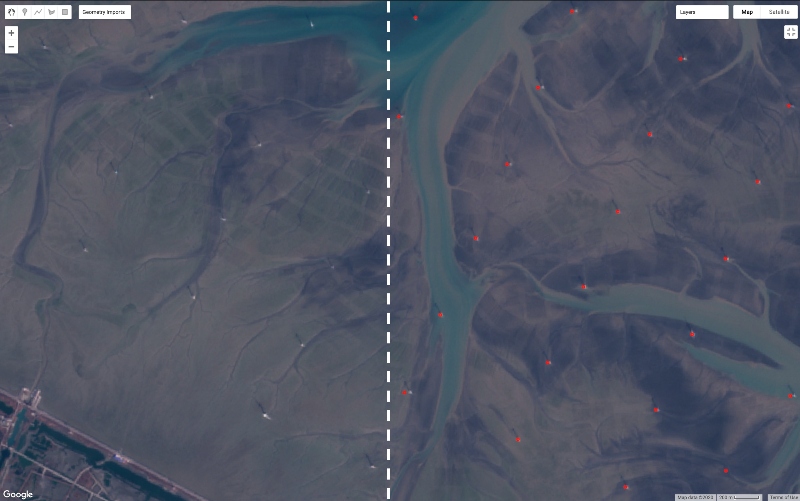
Wind turbine detection
Lastly, we tested our algorithm across a few wind farms (1,954 total individual turbines) just north of Shanghai, China and the North Sea since nearly all of the objects in the Gulf of Mexico were related to oil and gas.
The area zoomed in below shows the output of our algorithm—the red dots—superimposed in the right half.
You can still see the individual wind turbines on the left.
Towards a global fixed infrastructure dataset
Below is the same North Sea area with one key change.
Both the wind turbines and oil platforms are now mapped separately in white.
The aforementioned experiment was nice, but we want to do this at scale so we’re currently refining a global version.
We plan to classify these stationary objects as well.
Monitoring our vast oceans is both incredibly challenging and rewarding—our public fishing effort map demonstrates the positive impact of what planetary scale environmental data science can have, but we’re always seeking to facilitate new discoveries.
Mapping offshore infrastructure is one small step in this quest, and we’re even finding that scaling up from the regional work to the global version has presented new challenges—one of the more interesting hurdles is a radar-specific issue called range and azimuth ambiguities.
If you’ve got a geospatial solution to map these ambiguities, we’d love to hear from you.
This work was done in collaboration with SkyTruth and Duke University’s Marine Geospatial Ecology Lab.
Links :
- Rohling, H., 1983. Radar CFAR Thresholding in Clutter and Multiple Target Situations. IEEE Transactions on Aerospace and Electronic Systems AES-19, 608–621. https://doi.org/10.1109/TAES.1983.309350
- Walt, S. van der, Schönberger, J.L., Nunez-Iglesias, J., Boulogne, F., Warner, J.D., Yager, N., Gouillart, E., Yu, T., 2014. scikit-image: image processing in Python. PeerJ 2, e453. https://doi.org/10.7717/peerj.453
- GFW : Detecting dark fishing activity in the North Natuna Sea / Shedding a light on intruders at sea
No comments:
Post a Comment