Saturday, June 25, 2022

AIS-based fishing effort

This little dataviz shows the daily hourly totals per grid for 2020 - the frames towards the end show the cumulative yearly totals.
Also showing the link between bathymetry and fishing activity more clearly - i.e. concentrated activity around the Whittard Canyon.
 with data from GlobalFishingWatch
 
It's interesting what patterns start emerging when you compare years.
Here green pillars show areas where there was less fishing activity in 2020 than 2019, whilst orange shows areas where there was more activity. Taller the pillar - greater the delta. 

Friday, June 24, 2022

Mapping shipping lanes: Maritime traffic around the world


From Visual Capitalist

Each year, thousands of ships travel across the globe, transporting everything from passengers to consumer goods like wheat and oil.

But just how busy are global maritime routes, and where are the world’s major shipping lanes?
This map by Adam Syminton paints a macro picture of the world’s maritime traffic by highlighting marine traffic density around the world.

It uses data from the International Monetary Fund (IMF) in partnership with The World Bank, as part of IMF’s World Seaborne Trade Monitoring System.

Data spans from Jan 2015 to Feb 2021 and includes five different types of ships: commercial ships, fishing ships, oil & gas, passenger ships, and leisure vessels. 

An Overview of Key Maritime Shipping Lanes

If you take a look at the map, you’ll spot some distinct areas where traffic is heavily concentrated.

These high-density areas are the world’s main shipping lanes.
Syminton provided some zoomed-in visuals of these waterways in detail, so let’s dive in: 

Panama Canal


The Panama Canal is a man-made waterway that connects the Pacific and Atlantic Oceans.
For ships traveling from the east to west coast of the U.S., this route avoids the far more treacherous Cape Horn at the tip of South America or the Bering Strait in the Arctic, and shaves off roughly 8,000 nautical miles—or 21 days off their journey.

In 2021, approximately 516.7 million tons of goods passed through the major waterway, according to Ricaurte Vasquez, the Panama Canal Authority’s administrator. 

Strait of Malacca


This marine passage is the fastest connector between the Pacific and Indian oceans, winding through the Malay Peninsula and Sumatra.
It’s a slender waterway—at its narrowest point, the canal is less than 1.9 miles wide.
Approximately 70,000 ships pass through this strait each year. 

The Danish Straits


Connecting the North Sea with the Baltic Sea, the Danish Straits include three channels: the Oresund, the Great Belt and the Little Belt.

The Danish Straits are known to be a major passageway for Russian oil exports—which, despite sanctions and boycotts against Russian oil, have remained strong throughout 2022 so far.

Suez Canal


This 120-mile-long artificial waterway runs through Egypt and connects the Mediterranean Sea to the Red Sea, saving ships traveling between Asia and Europe a long passage around Africa.
Over 20,600 vessels traveled through the canal in 2021.

Last year, the canal made headlines after a 1,312-foot-long container ship called the Ever Given got stuck in the canal for six days, causing a massive traffic jam and halting billions of dollars worth of traded goods. 

Strait of Hormuz


This 615-mile waterway connects the Persian Gulf and the Gulf of Oman and ultimately drains into the Arabian Sea.
In 2020, the canal transported approximately 18 million barrels of oil every day. 

The English Channel


Located between England and France, the 350-mile-long English Channel links the North Sea to the Atlantic Ocean.
Approximately 500 vessels travel through the channel each day, making it one of the world’s busiest shipping lanes.

Some of the major European rivers are also clearly visible in these visualizations, including the Thames in the UK, the Seine in France, and the Meuse (or Mass) that flows through Belgium and the Netherlands.

COVID-19’s Impact on Maritime Transport

Though these maps show six years worth of marine traffic, it’s important to remember that many sectors were negatively impacted by the global pandemic, and maritime trade was no exception.
In 2020, global maritime shipments dropped by 3.8% to 10.65 billion tons.

While the drop wasn’t as severe as expected, and output is projected to keep growing throughout 2022, certain areas are still feeling the effects of COVID-19-induced restrictions.

For instance, in March 2022, shipping volume at the port of Shanghai screeched to a halt due to strict lockdowns in Shanghai, triggered by a COVID-19 outbreak.
Traffic was impacted for months, and while operations have rebounded, marine traffic in the area is still congested.
 
Links :

Thursday, June 23, 2022

Ocean oil slick map reveals enough greasy patches to cover France—twice

 
A rescue ship sprays water on a 300-tonne oil tanker which exploded and caught fire at the Zhangjianqi shipyard in Ningbo, east China's Zhejiang province on October 12, 2013, killing seven workers.
Credit: STR/AFP via Getty Images
 
From Scientific American by Sasha Warren
 
An algorithm-aided analysis of satellite images reveals the size, distribution and sources of oil slicks at sea

How many oil slicks are there in the ocean?
Where are they, and where did they come from?
These seem like simple questions, but with 139 million square miles of ocean, keeping an eye on these slippery streaks on the sea surface is no mean feat.
Now, however, researchers have used the unique capabilities of satellites to assemble what they say is the first global map of oil slicks.
Their results, published on Thursday in Science, suggest that oil covered a total area more than twice the size of France between 2014 and 2019 and that the vast majority came from human-linked sources.

Oil slicks are microscopically thin sheets of hydrocarbons.
In satellite images, they do not always appear to be a different color from the surrounding ocean because light can pass through them.
But the slicks do change the way the water reflects sunlight, just as gasoline that has leaked from a car can cause a rainbow sheen in a street puddle.
Oily surfaces also change the way water ripples when it is windy, making oil-covered patches of the ocean’s surface look calmer and smoother than surrounding areas.
For the new study, the researchers used computer algorithms to look for these “fingerprints” of oil in more than half a million radar images gathered by the European Space Agency’s Sentinel satellites, which can be used to measure the ocean’s smoothness.
Employing this new technique, the scientists spotted slicks as small as a few city blocks in size dotting 80 percent of the world’s ocean surface.

 
Credit: Amanda Montañez; Source: “Chronic Oiling in Global Oceans,” by Yanzhu Dong et al., in Science, Vol. 376.
Published online June 16, 2022


The largest total oil slick areas were detected in the Java Sea (between several islands of Indonesia), Mediterranean Sea and South China Sea.
Together, the slicks in these three areas accounted for nearly a third of all the oil the researchers spotted.
The region with the most concentrated oil cover was the Caspian Sea, where 20 percent of the water was covered in slicks, compared with a 4 percent average across all the world’s oceans.

The study’s lead author Yanzhu Dong and her colleagues wanted to go beyond pinpointing oil slick sizes and locations; they also wanted to identify sources.
The original goal of their study had been to find areas where oil naturally seeps from the seafloor.
This can be distinguished from human activity because natural slicks tend to be long-lived in one place, so any such slicks would show up again and again in the five years’ worth of satellite images used in the study.
These natural seeps occur globally, but they are particularly notable causes of oil slicks in the Gulf of Mexico, coastal region of Ecuador and Peru, and coast of California.

The new findings doubled the number of known natural slicks, and the researchers also noticed many more coinciding with shipping routes, oil pipelines and drilling platforms.
In some cases, leaky platforms and ships could even be spotted in the satellite images.
Based on earlier studies, “it was thought that natural seep and oil from human activities were roughly equal,” says Dong, a geographer at Nanjing University in China.
“But our new findings show that over 90 percent of all oil leaks in the oceans come from human sources.”

Most of this human oil footprint was concentrated within 100 miles of land.
“Since 2000 the population of the planet has increased by [about] two billion.
And those two billion people? Most of them are settled on the coasts,” says study co-author Ian MacDonald, a Florida State University oceanographer.
“With that population growth, you have industrial and road networks and vehicle transportation.
That runoff from the land contributes oil into the ocean.”

Unsurprisingly, the study found that the greatest contributions from pipelines occurred in areas known for their oil infrastructure, such as the North Sea and Gulf of Guinea.
(The researchers found the largest contribution from pipelines in the heavily drilled Gulf of Mexico, but it is harder to precisely single out oil leaked from that source in the region because it is also home to one of the largest natural seeps by area).
But on a global scale, leaky drilling platforms and punctured pipelines accounted for only a tiny fraction of oil coverage.
Almost all 550,000 square miles of human-related slicks—a little more than the land area of Peru—came from oil left trailing behind ships and washed off the land by rainfall.
“We have a globalized supply chain,” MacDonald says.
“Since 2000 the amount of international shipping ocean has increased nearly threefold.”

Signals that implicated shipping were most clearly seen in major port regions such as the South China Sea but also out in the deeper ocean.
It was in open-ocean areas that Dong and her team spotted 21 slicks near ships and in shipping lanes, where floating oil tends to form a telltale linear shape.
“It’s these small-scale spills that are dominating, rather than the big ones that capture the media attention and the public imagination,” says Ira Leifer, an oil seep scientist and CEO of a green-tech company called Bubbleology Research International.
Leifer was not involved in the new study but wrote an accompanying article in Science on the complex impact of oil on marine ecosystems.
“I never really expected that because I didn’t think about it.
But it’s one of those [instances] where you go give a Homer Simpson ‘D’oh!’”

 
Oil slicks from a May 2016 pipeline leak in the Northern Gulf of Mexico.
Credit: IR MacDonald, Florida State University


Leifer suggests that using algorithms to comb through satellite images could become a powerful and accessible method for assessing the effectiveness of efforts to prevent oil spills.
He cautions, however, that spotting oil at sea does not necessarily point to immediate destructive impacts in the involved areas.
Some microorganisms can break down the slicks to use as food, and although high concentrations of oil in the water are toxic to marine life, some ecosystems can likely tolerate small amounts.
Exactly how much oil is too much needs further study, especially in coastal areas.

The oil slicks discovered in the study could also point to where other industrial pollutants that cannot be observed remotely or broken down by organisms—such as PCBs and heavy metals—are likely to be found, says Deborah French McCay, an oceanographer and director of research and modeling at RPS Group, a company whose services include environmental consulting.
She was not involved in the new study.

Dong hopes that exposing the vast extent of human-related oil slicks will inspire international cooperation to better protect marine environments, particularly along coastlines—and not only in terms of oil pollution.
“The footprint of oil slicks can also be seen as an indicator of human activities,” she says.
“We think these results will alert humanity to the ways in which humans are stressing the ocean.”

Wednesday, June 22, 2022

Heat wave: how Orkney is leading a tidal power revolution

 
The 74-metre Orbital O2 being towed to the Orkney test site in 2021.
Photograph: Orbital Marine Power

From The Guardian by Eve Livingston 

Strong tides make conditions in the Scottish islands ideal, but can the UK grasp the opportunity to become a leader in the sector?

On a small passenger boat about 10 miles north of Kirkwall, Orkney, at the point where the Atlantic Ocean meets the North Sea, an immense yellow structure heaves into view.
This is the world’s most powerful tidal stream energy generator, Orbital Marine Power’s O2.
Its shadow quickly dwarfs the tiny vessel.

Today, the generator’s turbines are raised above sea level for maintenance.
It is difficult to comprehend the O2’s scale until a worker appears, a tiny stick figure against the hulking turbine. 
 
Orkney islands in the North of Scotland with the GeoGarage platform (UKHO nautical raster map)

Orkney, chosen as the European Marine Energy Centre’s (Emec) headquarters for its combination of strong tides and waves as well as connection to the energy grid, has become a hub for tidal power innovation.
Alongside Scottish company Orbital, Spain-based Magallanes is also testing at Emec and US company Aquantis has just signed up to a six-month demo programme.

 
The Orbital O2 at the Emec Fall of Warness test site. Photograph: Orbital Marine Power

Tidal power, while not yet widely commercialised, is seen by many as the next frontier in global renewables.
It’s the only renewable power source that comes from the moon’s pull on the Earth. 
“Unlike other renewables which rely on, for instance, the sun or the wind, tidal resources are predictable and continuous,” says Prof AbuBakr Bahaj, head of the energy and climate change division at the University of Southampton.

Harnessing power from the waves can be done in three ways: tidal barrages, in which turbines are attached to a dam-like wall; tidal lagoons, where a body of water is enclosed by a barrage-like barrier; and tidal stream, where turbines are placed directly into fast-flowing bodies of water.

Only tidal barrages are used commercially – most notably at Lake Sihwa in South Korea and La Rance in northern France – but it is tidal stream technology that is being tested in Orkney. Tidal stream is cheaper to build and has less of an environmental impact than barrages, which alter tidal flow and can affect marine life and birds.

Tidal stream power alone could provide 11% of the UK’s current electricity needs, according to 2021 research from Edinburgh University.

Despite its promise, progress has been slow.
Aboard the boat, Lisa MacKenzie from Emec tells a now infamous tale about the UK renewables sector. In the 1980s, Orkney was home to experimental wind turbine technology that could have seen the UK become a global leader in the sector.
But the government didn’t invest – and Denmark and Germany swooped in to monopolise the market.
“Wind energy was the UK’s to lose and we lost it,” she says.
“Now tidal energy is ours to lose. We can’t let that happen again.”

In Orkney, testing is aimed at lowering the costs and risks of tidal power to make it commercially viable.
“We have some of the best conditions in the world to test new technologies,” MacKenzie says.
“More ocean energy converters have been tested here than any other site.”

Orbital’s O2 turbine, deployed to Orkney’s Fall of Warness testing site in July last year, is the third iteration of its tidal technology.
This is the version the company hopes to take to market.
It consists of a 74-metre floating structure with a submerged two-bladed turbine on each side.
A subsea cable connects it to the local onshore electricity grid, where the energy it produces can meet the demands of about 2,000 homes each year.

 
The Orbital 02 turbine blades being submerged below the waves.
Photograph: Orbital Marine Power

“All new technology in any space is more expensive than the market, so we can’t compete out of the box against mature generating technologies,” says Andrew Scott, CEO of Orbital Marine Power.
“What we need is market intervention to level the playing field.”

The UK is considered a world leader in the development of tidal power technology, but while the government provided ringfenced support to the sector from 2008, it was removed in 2016.
Last year, the governmentreintroduced short-term support, but what is needed is a long-term vision, Scott says.
“If we can’t get comfortable that there’s going to be a long-term market, we’re still at square one,” he says.
“Private investors won’t be prepared to put money in because it feels like the rug could be pulled from under you at any moment.”

Just minutes away from the O2 is an abandoned test rig installed by Irish company OpenHydro in 2006. The company entered liquidation in 2018, having been bought out by French company Naval Energies which ultimately pulled its funding.
In the same year, plans for a tidal lagoon at Swansea Bay, previously tipped to be the UK’s first commercial tidal power generator, collapsed when the government failed to guarantee financial support to cover energy costs.

This is a global challenge, Bahaj says.
“The operational environment requires high specification designs and technologies, and specialist ships for installation and maintenance,” he says.
“All these activities demand money from developers who, unlike oil and gas, are mainly SMEs with limited financial resources. Funding availability, including government technology support, is the major challenge which limits scale-up and cost reductions.”

 
A graphic showing the Orbital O2 in action.
Photograph: Orbital Marine

Some governments are responding.
In 2020, the Canadian government announced a $28.5m investmentin floating tidal energy being developed by Scottish company Sustainable Marine at the Bay of Fundy, home to the world’s most powerful tides.
In May, it delivered the first floating tidal stream power to Nova Scotia’s energy grid.

The Faroe Islands, too, are home to ambitious tidal stream investments.
Under a 2018 agreement, Sweden-based developer Minesto will install and operate two grid-connected tidal stream units and the islands’ main power company, SEV, committed to buy the electricity.
At the time, the deal was hailed by Minesto CEO Dr Martin Edlund as playing “a significant role” in the Faroes planned transition to 100% renewable energy by 2030.

Orbital’s Scott wants the UK to take a similarly ambitious approach to tidal power. “We have an ability to grow an indigenous industry here, one that can help with net zero, the levelling up agenda, the just transition,” he says. The O2 was built using a UK supply chain which generated about 60 jobs, he adds. “The industry doesn’t need to get massive and we can make a very meaningful contribution.”

Back on the boat as it navigates around Orkney’s islands, MacKenzie is watching for orcas, which had been spotted close to the O2 earlier in the day.


As tidal technology develops some scientists have raised concerns about potential effects on marine life. MacKenzie says marine mammals and fish are well versed in avoiding boats and other structures and research carried out at Emec’s test sites has shown little impact on wildlife.
Some studies have suggested that tidal and wave systems may even have a positive effect on marine life, acting as artificial reefs.

Vessels required for installation and maintenance do generate potentially disruptive noise but the tide itself, in these rough seas, is thought to belouder than the turbine.
Turbine blades may present the greatest dangers, however research suggests their effects are rare and mostly non-lethal.

With the ability to generate large volumes of predictable, renewable energy, some experts believe tidal power could play an important part in the world’s energy mix.
“There is a global interest in tidal stream and with the current hike in gas and electricity prices, tidal-driven power is likely to compete favourably,” says Bahaj. 
“In a way, the future looks brighter than it did a year ago.”
 

Tuesday, June 21, 2022

World Hydrography Day

World Hydrography Day, 21 June was adopted by the IHO International Hydrographic Organization as an annual celebration to publicize the work of hydrographers and the importance of hydrography which is the science of surveying and charting bodies of water, such as seas, lakes and rivers.

MIS ready for multibeam Olex installation in the Svalbard islands with Ponant very soon.

Localization of the multibeam survey in the North of Norway in the GeoGarage platform
(NHS nautical raster chart)


From nautical charts to all ocean data,
this IHO video discusses how hydrographic data could be used in the future.

Links :


Monday, June 20, 2022

4,000 robots roam the oceans, climate in their crosshairs


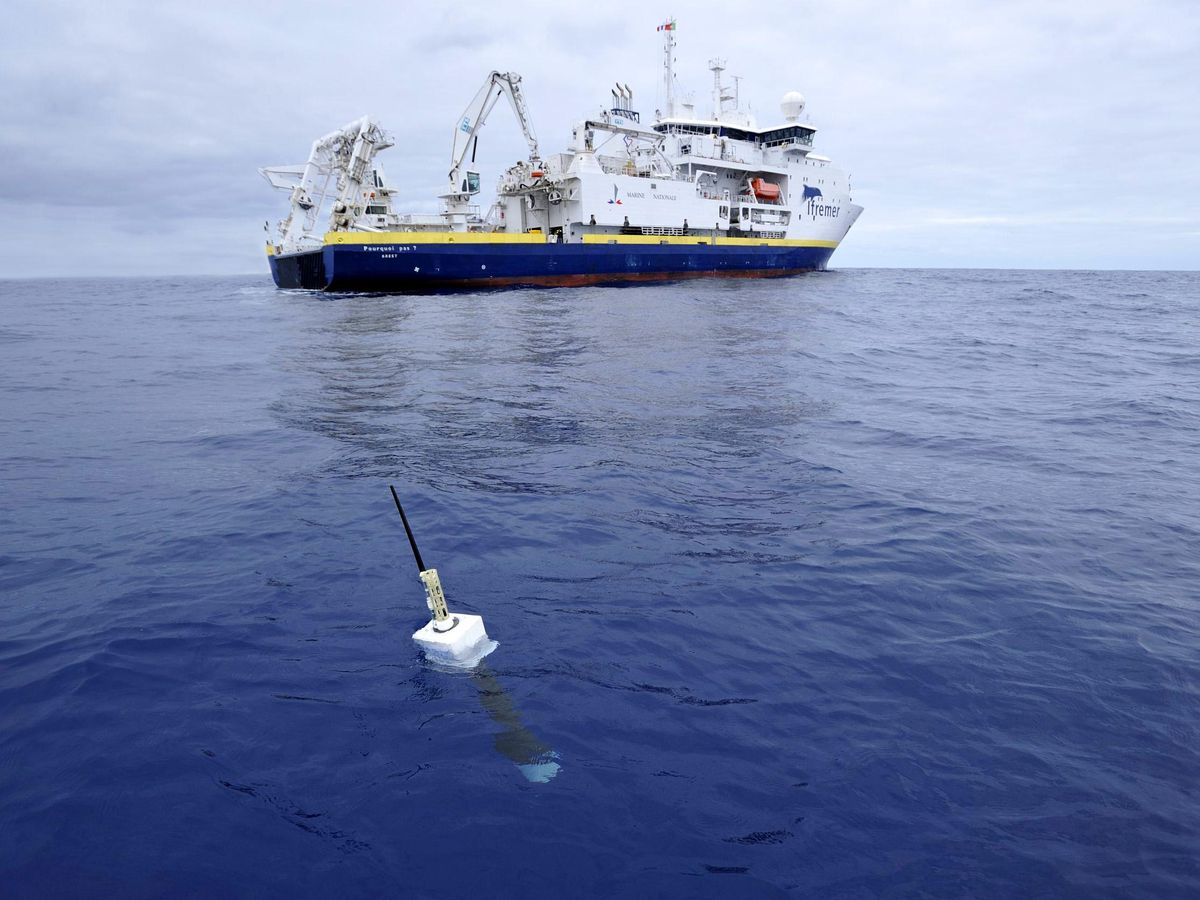
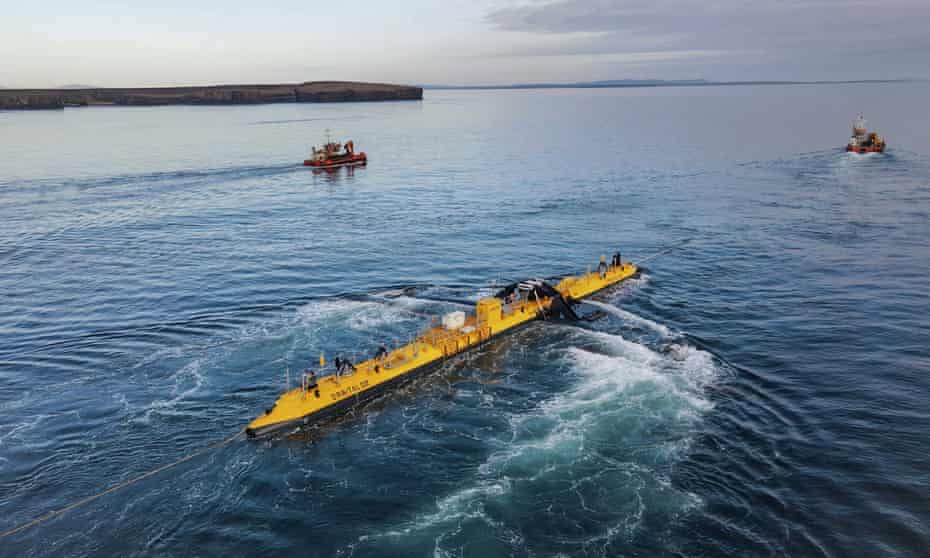
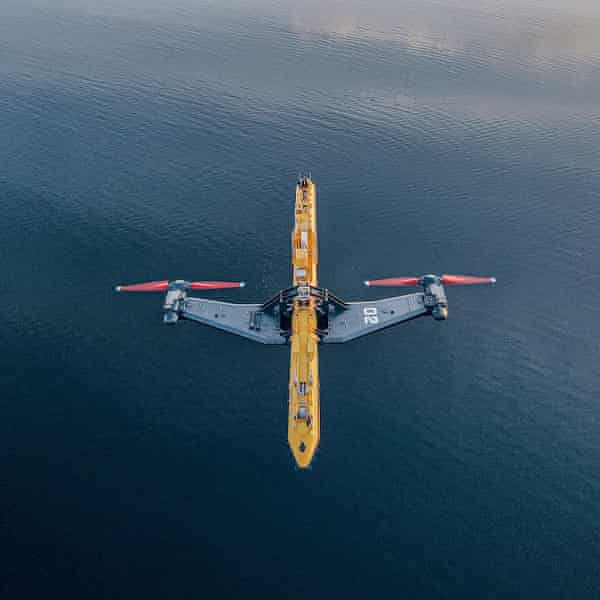
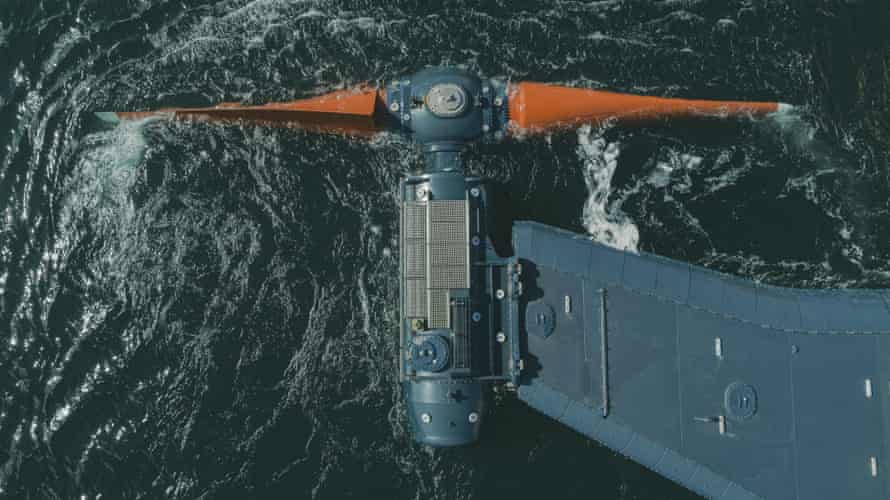
A robotic underwater craft called a profiling float was deployed by the French research vessel Pourquoi Pas in 2020.
Olivier Dugornay / Ifremer / Argo Program
 
From IEEE Spectrum by Glenn Zorpette

A leading Argo program scientist describes the quiet revolution in undersea tech

In the puzzle of climate change, Earth’s oceans are an immense and crucial piece.
The oceans act as an enormous reservoir of both heat and carbon dioxide, the most abundant greenhouse gas.
But gathering accurate and sufficient data about the oceans to feed climate and weather models has been a huge technical challenge.

Over the years, though, a basic picture of ocean heating patterns has emerged.
The sun’s infrared, visible-light, and ultraviolet radiation warms the oceans, with the heat absorbed particularly in Earth’s lower latitudes and in the eastern areas of the vast ocean basins.
Thanks to wind-driven currents and large-scale patterns of circulation, the heat is generally driven westward and toward the poles, being lost as it escapes to the atmosphere and space.

This heat loss comes mainly from a combination of evaporation and reradiation into space.
This oceanic heat movement helps make Earth habitable by smoothing out local and seasonal temperature extremes.
But the transport of heat in the oceans and its eventual loss upward are affected by many factors, such as the ability of the currents and wind to mix and churn, driving heat down into the ocean.
The upshot is that no model of climate change can be accurate unless it accounts for these complicating processes in a detailed way.
And that’s a fiendish challenge, not least because Earth’s five great oceans occupy 140 million square miles, or 71 percent of the planet’s surface.
“We can see the clear impact of the greenhouse-gas effect in the ocean.
When we measure from the surface all the way down, and we measure globally, it’s very clear.”
—Susan Wijffels
Providing such detail is the purpose of the Argo program, run by an international consortium involving 30 nations.
The group operates a global fleet of some 4,000 undersea robotic craft scattered throughout the world’s oceans.
The vessels are called “floats,” though they spend nearly all of their time underwater, diving thousands of meters while making measurements of temperature and salinity.
Drifting with ocean currents, the floats surface every 10 days or so to transmit their information to data centers in Brest, France, and Monterey, Calif.
The data is then made available to researchers and weather forecasters all over the world.

The Argo system, which produces more than 100,000 salinity and temperature profiles per year, is a huge improvement over traditional methods, which depended on measurements made from ships or with buoys.
The remarkable technology of these floats and the systems technology that was created to operate them as a network was recognized this past May with the IEEE Corporate Innovation Award, at the 2022 Vision, Innovation, and Challenges Summit.
Now, as Argo unveils an ambitious proposal to increase the number of floats to 4,700 and increase their capabilities, IEEE Spectrum spoke with Susan Wijffels, senior scientist at the Woods Hole Oceanographic Institution on Cape Cod, Mass., and cochair of the Argo steering committee.

Why do we need a vast network like Argo to help us understand how Earth’s climate is changing?

Susan Wijffels: Well, the reason is that the ocean is a key player in Earth’s climate system.
So, we know that, for instance, our average climate is really, really dependent on the ocean.
But actually, how the climate varies and changes, beyond about a two-to-three-week time scale, is highly controlled by the ocean.
And so, in a way, you can think that the future of climate—the future of Earth—is going to be determined partly by what we do, but also by how the ocean responds.

 
Susan Wijffels

Aren’t satellites already making these kind of measurements?

Wijffels: The satellite observing system, a wonderful constellation of satellites run by many nations, is very important.
But they only measure the very, very top of the ocean.
They penetrate a couple of meters at the most.
Most are only really seeing what’s happening in the upper few millimeters of the ocean.
And yet, the ocean itself is very deep, 5, 6 kilometers deep, around the world.
And it’s what’s happening in the deep ocean that is critical, because things are changing in the ocean.
It’s getting warmer, but not uniformly warm.
There’s a rich structure to that warming, and that all matters for what’s going to happen in the future.

How was this sort of oceanographic data collected historically, before Argo?

Wijffels: Before Argo, the main way we had of getting subsurface information, particularly things like salinity, was to measure it from ships, which you can imagine is quite expensive.
These are research vessels that are very expensive to operate, and you need to have teams of scientists aboard.
They’re running very sensitive instrumentation.
And they would simply prepare a package and lower it down the side into the ocean.
And to do a 2,000-meter profile, it would maybe take a couple of hours.
To go to the seafloor, it can take 6 hours or so.

The ships really are wonderful.
We need them to measure all kinds of things.
But to get the global coverage we’re talking about, it’s just prohibitive.
In fact, there are not enough research vessels in the world to do this.
And so, that’s why we needed to try and exploit robotics to solve this problem.

Pick a typical Argo float and tell us something about it, a day in the life of an Argo float or a week in the life.

How deep is this float typically, and how often does it transmit data?

Wijffels: They spend 90 percent of their time at 1,000 meters below the surface of the ocean—an environment where it’s dark and it’s cold.
A float will drift there for about nine and a half days.
Then it will make itself a little bit smaller in volume, which increases its density relative to the seawater around it.
That allows it to then sink down to 2,000 meters.
Once there, it will halt its downward trajectory, and switch on its sensor package.
Once it has collected the intended complement of data, it expands, lowering its density.
As the then lighter-than-water automaton floats back up toward the surface, it takes a series of measurements in a single column.
And then, once they reach the sea surface, they transmit that profile back to us via a satellite system.
And we also get a location for that profile through the global positioning system satellite network.
Most Argo floats at sea right now are measuring temperature and salinity at a pretty high accuracy level.

How big is a typical data transmission, and where does it go?

Wijffels: The data is not very big at all.
It’s highly compressed.
It’s only about 20 or 30 kilobytes, and it goes through the Iridium network now for most of the float array.
That data then comes ashore from the satellite system to your national data centers.
It gets encoded and checked, and then it gets sent out immediately.
It gets logged onto the Internet at a global data assembly center, but it also gets sent immediately to all the operational forecasting centers in the world.
So the data is shared freely, within 24 hours, with everyone that wants to get hold of it.

 
This visualization shows some 3,800 of Argo’s floats scattered across the globe.
ARGO PROGRAM

You have 4,000 of these floats now spread throughout the world.
Is that enough to do what your scientists need to do?

Wijffels: Currently, the 4,000 we have is a legacy of our first design of Argo, which was conceived in 1998.
And at that time, our floats couldn’t operate in the sea-ice zones and couldn’t operate very well in enclosed seas.
And so, originally, we designed the global array to be 3,000 floats; that was to kind of track what I think of as the slow background changes.
These are changes happening across 1,000 kilometers in around three months—sort of the slow manifold of what’s happening to subsurface ocean temperature and salinity.

So, that’s what that design is for.
But now, we have successfully piloted floats in the polar oceans and the seasonal sea-ice zones.
So we know we can operate them there.
And we also know now that there are some special areas like the equatorial oceans where we might need higher densities [of floats].
And so, we have a new design.
And for that new design, we need to get about 4,700 operating floats into the water.

But we’re just starting now to really go to governments and ask them to provide the funds to expand the fleet.
And part of the new design calls for floats to go deeper.
Most of our floats in operation right now go only as deep as about 2,000 meters.
But we now can build floats that can withstand the oceans’ rigors down to depths of 6,000 meters.
And so, we want to build and sustain an array of about 1,200 deep-profiling floats, with an additional 1,000 of the newly built units capable of tracking the oceans by geochemistry.
But this is new.
These are big, new missions for the Argo infrastructure that we’re just starting to try and build up.
We’ve done a lot of the piloting work; we’ve done a lot of the preparation.
But now, we need to find sustained funding to implement that.

 
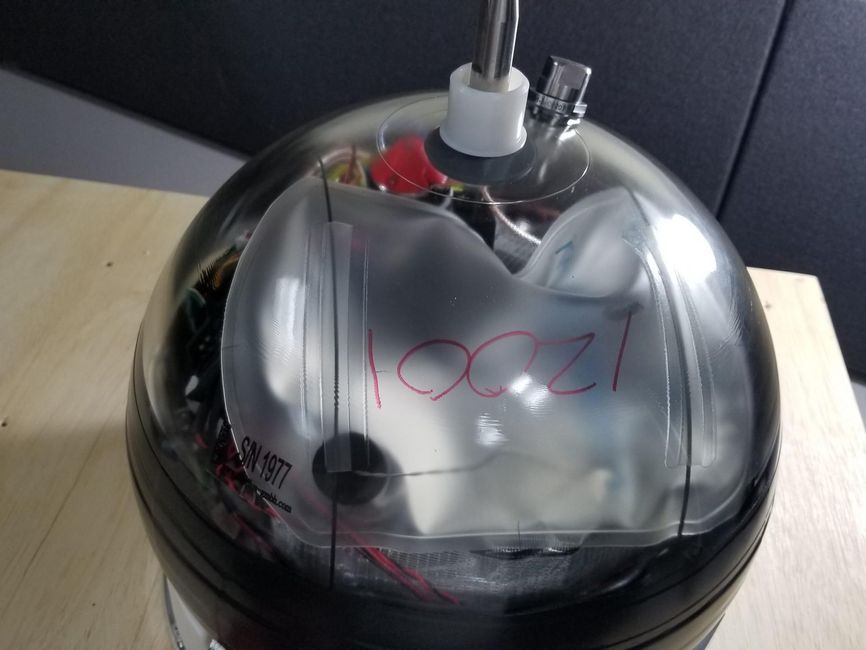
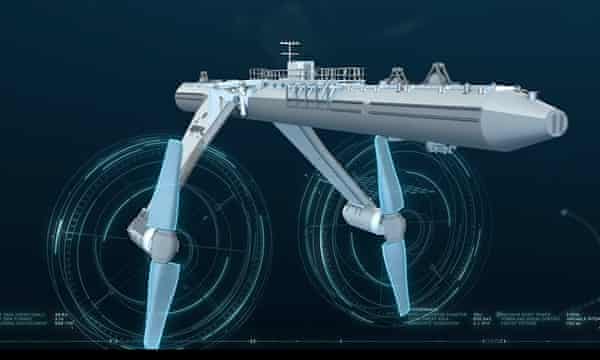
A new generation of deep-diving Argo floats can reach a depth of 6,000 meters.
A spherical glass housing protects the electronics inside from the enormous pressure at that depth.
MRV SYSTEMS/ARGO PROGRAM

What is the cost of a typical float?


Wijffels: A typical cold float, which just measures temperature, salinity, and operates to 2,000 meters, depending on the country, costs between $20,000 and $30,000 U.S.
dollars.
But they each last five to seven years.
And so, the cost per profile that we get, which is what really matters for us, is very low—particularly compared with other methods [of acquiring the same data].

What kind of insights can we get from tracking heat and salinity and how they’re changing across Earth’s oceans?

Wijffels: There are so many things I could talk about, so many amazing discoveries that have come from the Argo data stream.
There’s more than a paper a day that comes out using Argo.
And that’s probably a conservative view.
But I mean, one of the most important things we need to measure is how the ocean is warming.
So, as the Earth system warms, most of that extra heat is actually being trapped in the ocean.
Now, it’s a good thing that that heat is taken up and sequestered by the ocean, because it makes the rate of surface temperature change slower.
But as it takes up that heat, the ocean expands.
So, that’s actually driving sea-level rise.
The ocean is pumping heat into the polar regions, which is causing both sea-ice and ice-sheet melt.
And we know it’s starting to change regional weather patterns as well.
With all that in mind, tracking where that heat is, and how the ocean circulation is moving it around, is really, really important for understanding both what's happening now to our climate system and what's going to happen to it in the future.

What has Argo’s data told us about how ocean temperatures have changed over the past 20 years? Are there certain oceans getting warmer? Are there certain parts of oceans getting warmer and others getting colder?


Wijffels: The signal in the deep ocean is very small.
It’s a fraction, a hundredth of a degree, really.
But we have very high precision instruments on Argo.
The warming signal came out very quickly in the Argo data sets when averaged across the global ocean.
If you measure in a specific place, say a time series at a site, there's a lot of noise there because the ocean circulation is turbulent, and it can move heat around from place to place.
So, any given year, the ocean can be warm, and then it can be cool…that’s just a kind of a lateral shifting of the signal.
“We have discovered through Argo new current systems that we knew nothing about....There’s just been a revolution in our ability to make discoveries and understand how the ocean works.”
—Susan Wijffels
But when you measure globally and monitor the global average over time, the warming signal becomes very, very apparent.
And so, as we’ve seen from past data—and Argo reinforces this—the oceans are warming faster at the surface than at their depths.
And that’s because the ocean takes a while to draw the heat down.
We see the Southern Hemisphere warming faster than the Northern Hemisphere.
And there’s a lot of work that’s going on around that.
The discrepancy is partly due to things like aerosol pollution in the Northern Hemisphere’s atmosphere, which actually has a cooling effect on our climate.

But some of it has to do with how the winds are changing.
Which brings me to another really amazing thing about Argo: We’ve had a lot of discussion in our community about hiatuses or slowdowns of global warming.
And that’s because of the surface temperature, which is the metric that a lot of people use.
The oceans have a big effect on the global average surface temperature estimates because the oceans comprise the majority of Earth’s surface area.
And we see that the surface temperature can peak when there’s a big El Niño–Southern Oscillation event.
That’s because, in the Pacific, a whole bunch of heat from the subsurface [about 200 or 300 meters below the surface] suddenly becomes exposed to the surface.
[Editor’s note: The El Niño–Southern Oscillation is a recurring, large-scale variation in sea-surface temperatures and wind patterns over the tropical eastern Pacific Ocean.]

What we see is this kind of chaotic natural phenomena, such as the El Niño–Southern Oscillation.
It just transfers heat vertically in the ocean.
And if you measure vertically through the El Niño or the tropical Pacific, that all cancels out.
And so, the actual change in the amount of heat in the ocean doesn’t see those hiatuses that appear in surface measurements.
It’s just a staircase.
And we can see the clear impact of the greenhouse-gas effect in the ocean.
When we measure from the surface all the way down, and we measure globally, it’s very clear.

Argo was obviously designed and established for research into climate change, but so many large scientific instruments turn out to be useful for scientific questions other than the ones they were designed for.

Is that the case with Argo?


Wijffels: Absolutely.
Climate change is just one of the questions Argo was designed to address.
It’s really being used now to study nearly all aspects of the ocean, from ocean mixing to just mapping out what the deep circulation, the currents in the deep ocean, look like.
We now have very detailed maps of the surface of the ocean from the satellites we talked about, but understanding what the currents are in the deep ocean is actually very, very difficult.
This is particularly true of the slow currents, not the turbulence, which is everywhere in the ocean like it is in the atmosphere.
But now, we can do that using Argo because Argo gives us a map of the sort of pressure field.
And from the pressure field, we can infer the currents.
We have discovered through Argo new current systems that we knew nothing about.
People are using this knowledge to study the ocean eddy field and how it moves heat around the ocean.

People have also made lots of discoveries about salinity; how salinity affects ocean currents and how it is reflecting what’s happening in our atmosphere.
There’s just been a revolution in our ability to make discoveries and understand how the ocean works.

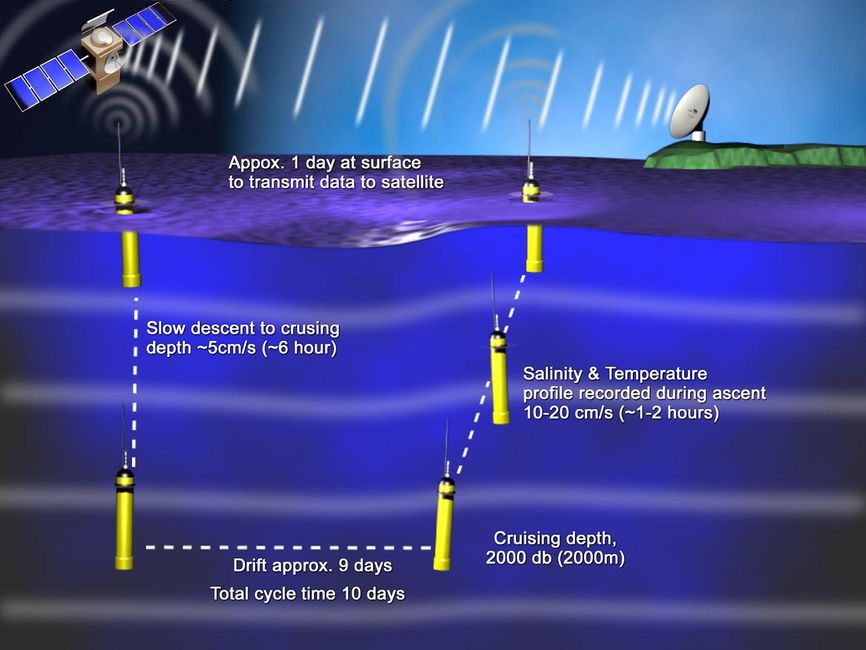
During a typical 10-day cycle, an Argo float spends most of its time at a depth of 2,000 meters, making readings before ascending to the surface and then transmitting its data via a satellite network.
ARGO PROGRAM

As you pointed out earlier, the signal from the deep ocean is very subtle, and it’s a very small signal.
So, naturally, that would prompt an engineer to ask, “How accurate are these measurements, and how do you know that they’re that accurate?”

Wijffels: So, at the inception of the program, we put a lot of resources into a really good data-management and quality-assurance system.
That’s the Argo Data Management system, which broke new ground for oceanography.
And so, part of that innovation is that we have, in every nation that deploys floats, expert teams that look at the data.
When the data is about a year old, they look at that data, and they assess it in the context of nearby ship data, which is usually the gold standard in terms of accuracy.
And so, when a float is deployed, we know the sensors are routinely calibrated.
And so, if we compare a freshly calibrated float’s profile with an old one that might be six or seven years old, we can make important comparisons.
What’s more, some of the satellites that Argo is designed to work with also give us ability to check whether the float sensors are working properly.

And through the history of Argo, we have had issues.
But we’ve tackled them head on.
We have had issues that originated in the factories producing the sensors.
Sometimes, we’ve halted deployments for years while we waited for a particular problem to be fixed.
Furthermore, we try and be as vigilant as we can and use whatever information we have around every float record to ensure that it makes sense.
We want to make sure that there’s not a big bias, and that our measurements are accurate.

You mentioned earlier there’s a new generation of floats capable of diving to an astounding 6,000 meters.
I imagine that as new technology becomes available, your scientists and engineers are looking at this and incorporating it.
Tell us how advances in technology are improving your program.

Wijffels: [There are] three big, new things that we want to do with Argo and that we’ve proven we can do now through regional pilots.
The first one, as you mentioned, is to go deep.
And so that meant reengineering the float itself so that it could withstand and operate under really high pressure.
And there are two strategies to that.
One is to stay with an aluminum hull but make it thicker.
Floats with that design can go to about 4,000 meters.
The other strategy was to move to a glass housing.
So the float goes from a metal cylinder to a glass sphere.
And glass spheres have been used in ocean science for a long time because they’re extremely pressure resistant.
So, glass floats can go to those really deep depths, right to the seafloor of most of the global ocean.

The game changer is a set of sensors that are sensitive and accurate enough to measure the tiny climate-change signals that we’re looking for in the deep ocean.
And so that requires an extra level of care in building those sensors and a higher level of calibration.
And so we’re working with sensor manufacturers to develop and prove calibration methods with tighter tolerances and ways of building these sensors with greater reliability.
And as we prove that out, we go to sea on research vessels, we take the same sensors that were in our shipboard systems, and compare them with the ones that we’re deploying on the profiling floats.
So, we have to go through a whole development cycle to prove that these work before we certify them for global implementation.

You mentioned batteries.
Are batteries what is ultimately the limit on lifetime? I mean, I imagine you can’t recharge a battery that’s 2,000 meters down.


Wijffels: You’re absolutely right.
Batteries are one of the key limitations for floats right now as regards their lifetime, and what they’re capable of.
If there were a leap in battery technology, we could do a lot more with the floats.
We could maybe collect data profiles faster.
We could add many more extra sensors.

So, battery power and energy management Is a big, important aspect of what we do.
And in fact, the way that we task the floats, it’s been a problem with particularly lithium batteries because the floats spend about 90 percent of their time sitting in the cold and not doing very much.
During their drift phase, we sometimes turn them on to take some measurements.
But still, they don’t do very much.
They don’t use their buoyancy engines.
This is the engine that changes the volume of the float.

And what we’ve learned is that these batteries can passivate.
And so, we might think we’ve loaded a certain number of watts onto the float, but we never achieved the rated power level because of this passivation problem.
But we’ve found different kinds of batteries that really sidestep that passivation problem.
So, yes, batteries have been one thing that we’ve had to figure out so that energy is not a limiting factor in float operation.
 
Links :

Sunday, June 19, 2022

Life below water: the arrival of a new species

A documentary-style film about the most formidable species in our oceans: plastic.
Using cinematic footage, alluring descriptions, powerful music and a well-known voiceover, this sequence illuminates the frightening truth about today’s oceans.

 
Each year, 11 million tonnes of plastic waste pour into the world's ocean.
That's 30 Empires State buildings weight in plastics swirling in the water, threatening fragile ecosystems around the globe.
This problem isn't going away on its own. In fact, it's getting worse.
How can we get the ocean Back to Blue?