From SENTINEL-1
I found in Twitter [1,2,3] that a simple way to visualize the sea lanes is to compute the maximum of each pixel across a time series of Sentinel-1 images.
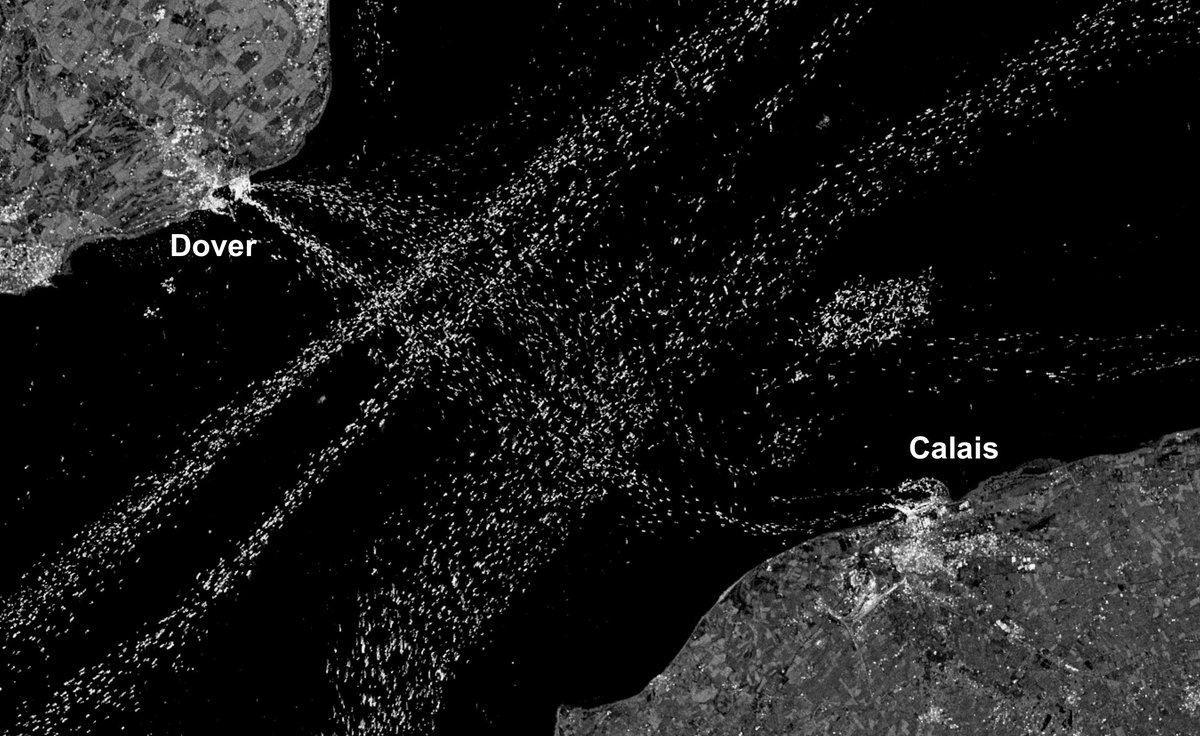
Max composite of all Sentinel-1 images from 2015-Jan-01 to 2019-Jan-01
(interferometric wide swath mode, VH polarization, ground range detected, log scaling)
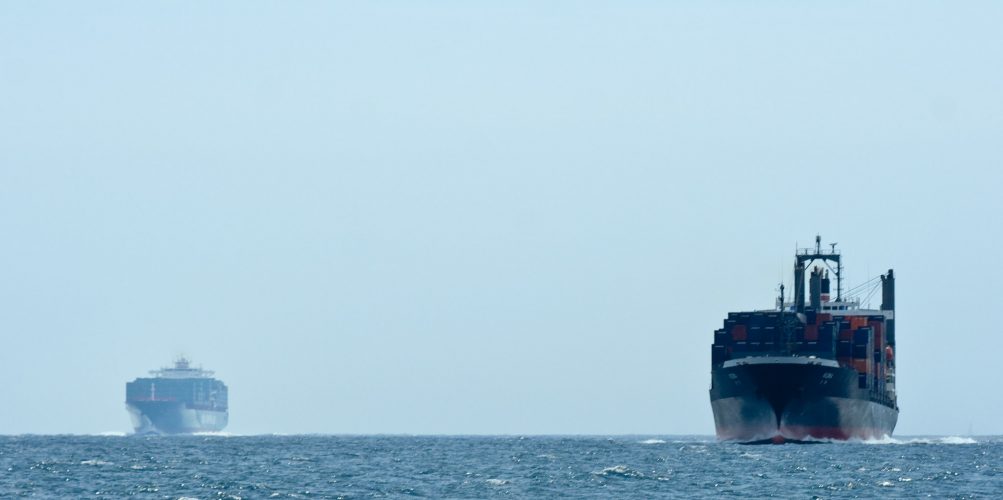
When a (big) ship is illuminated by Sentinel-1 C-band SAR, it returns a strong signal back to the antenna and therefore a bright spot is captured.
In contrast, the sea surface causes a smaller coherent scattering: the radar waves bounce off the water surface in many directions and thus only a small fraction of the energy return to the antenna, which explains why the sea looks much darker.
In Google Earth Engine it's straightforward to generate such a max composite using the function ee.ImageCollection.max().
In Google Earth Engine it's straightforward to generate such a max composite using the function ee.ImageCollection.max().
Here the max composite was done after filtering the Sentinel-1 GRD collection to get images from a similar look angles (in this case ascending node).
Hence it provides a snapshot of ships density at the overpass time of Sentinel-1 at 6 pm local time (England). We can compare to the same composite made with descending orbits only i.e. 6 am.
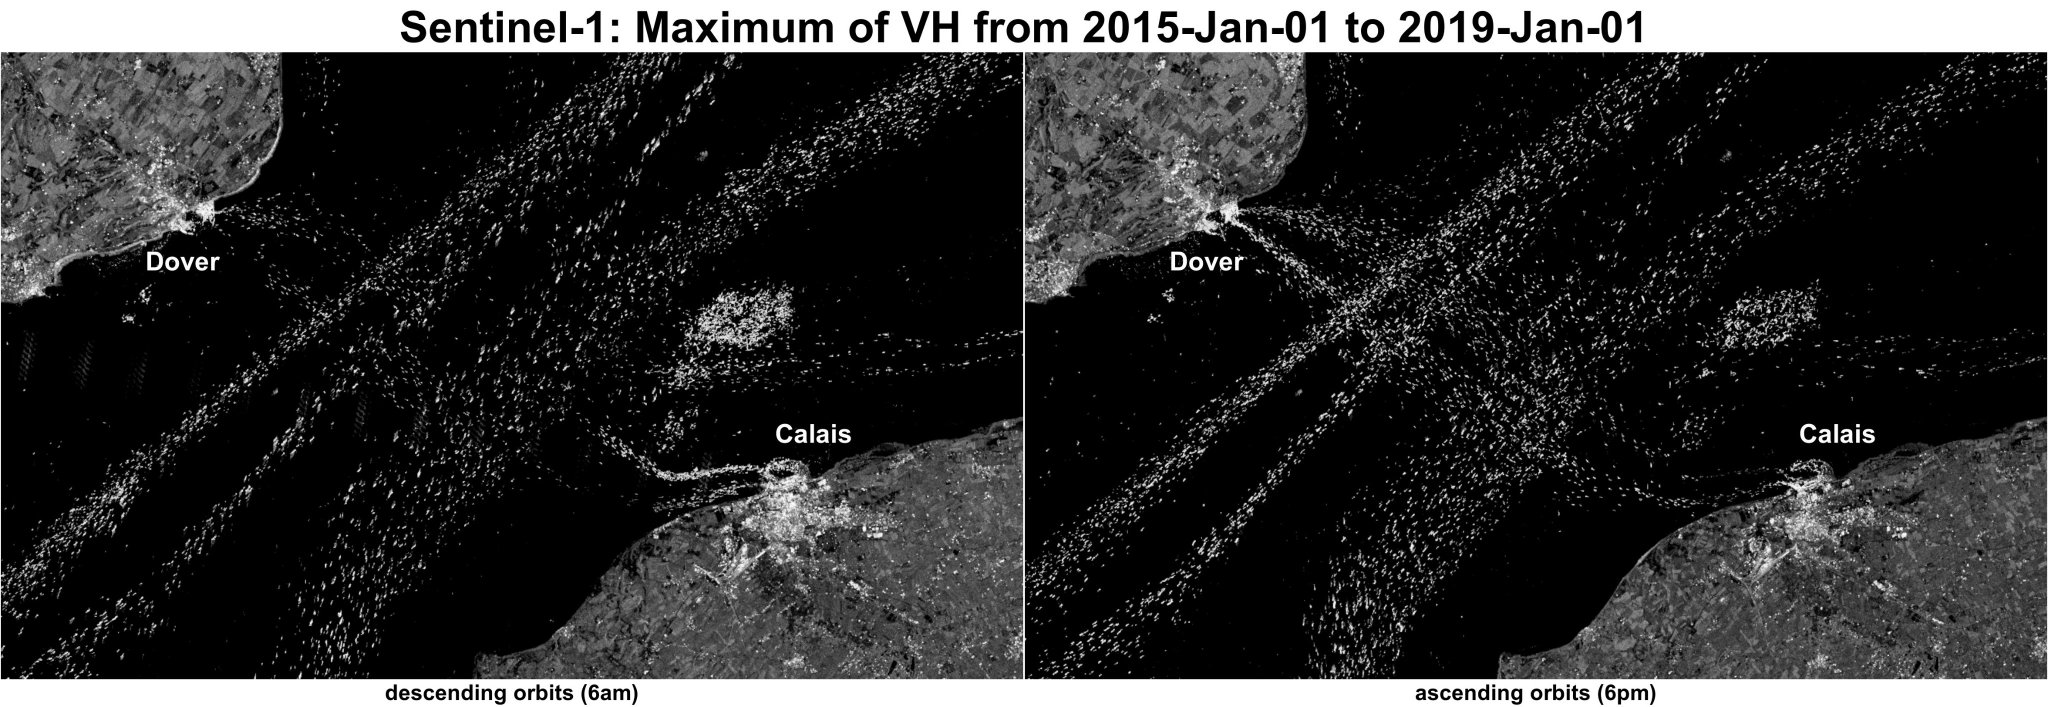
The differences in the area near Calais and Dover may be due to the fact that there's a P&O ferry leaving Calais at 5:45 which is still near the French coast at 6am, while a ferry leaves Dover at 5:30 which is already farther off the English coast in the 6 am image.
On the other hand, a ferry leaves Calais at 5:55 pm, therefore it is still very close to the port of Calais at Sentinel-1 overpass time. It's fun too look at other straits with the same method...
Singapore strait
Gibraltar strait
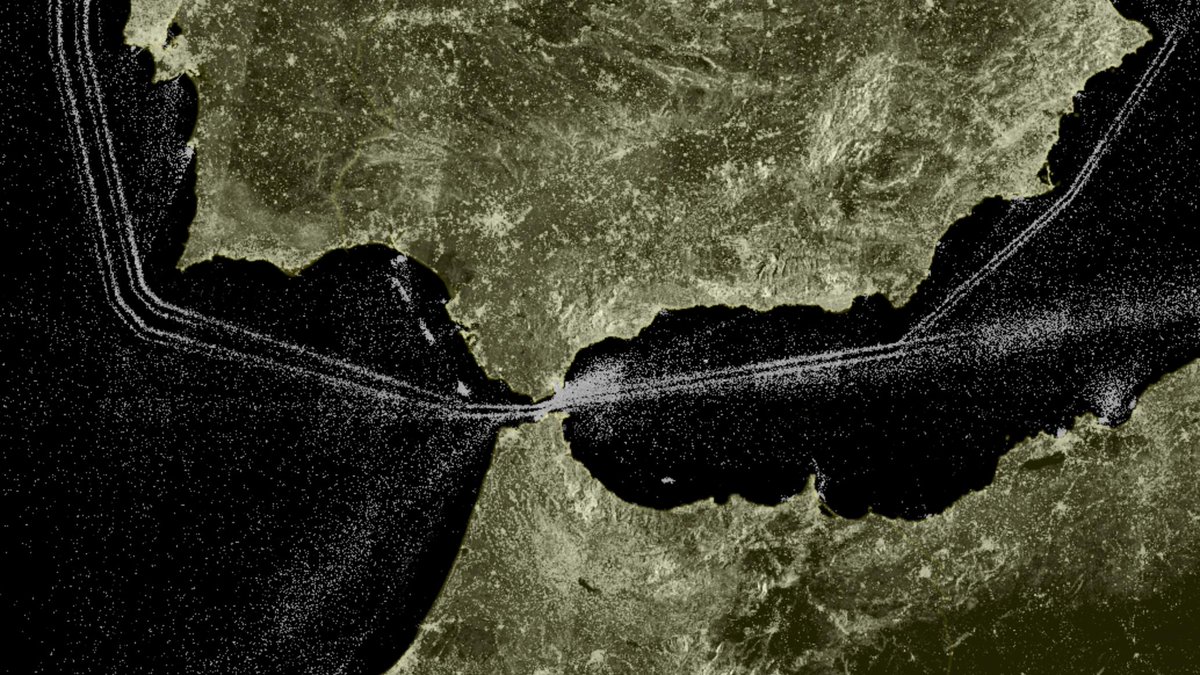
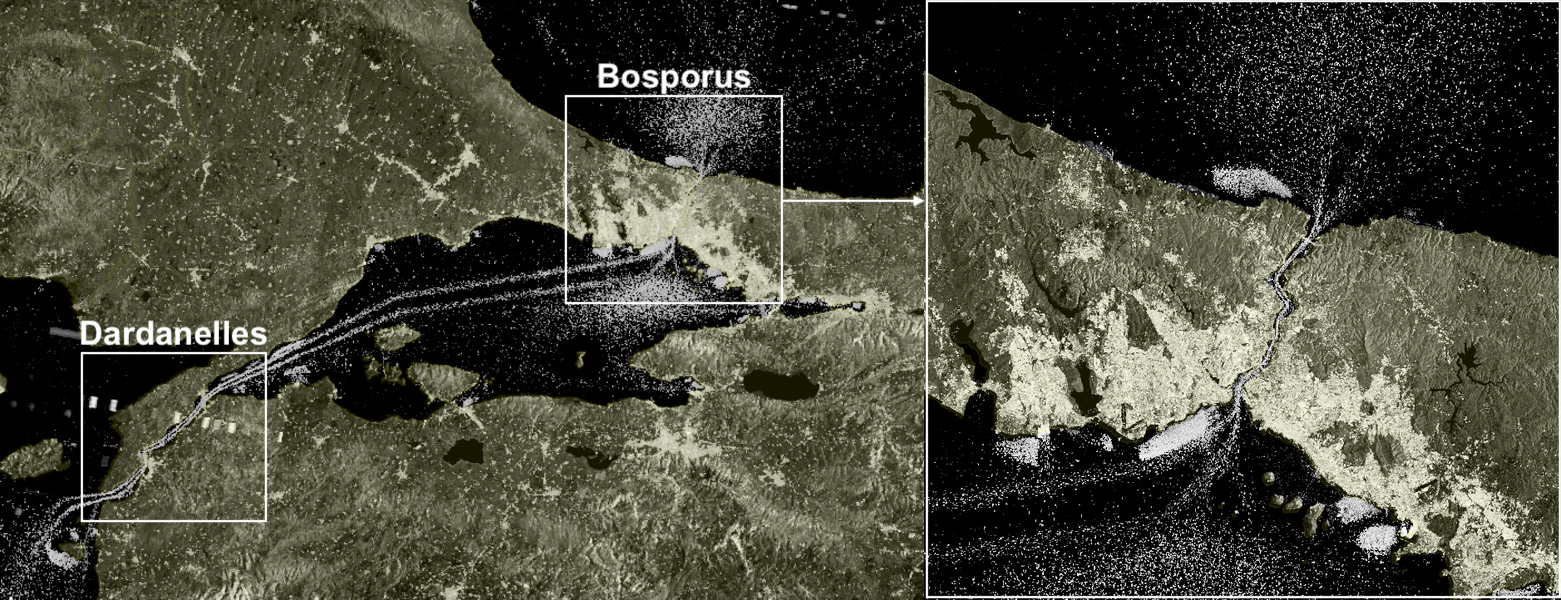
Sea of Marmara
In the Sea of Marmara the traffic is dense between the Bosphorus and Dardanelles straits. However, there is an intriguing dark area around İmralı island.
In the Sea of Marmara the traffic is dense between the Bosphorus and Dardanelles straits. However, there is an intriguing dark area around İmralı island.
This is because there is a military base and a maximum-security prison on the island...
 Sentinel-1 max composite around Imrali island
Suez canal
A nice one spotted by Michel Le Page: the southern entrance of the Suez canal, one of the world's most heavily used shipping lanes:

The bright areas beside the main stream of ships are anchorage areas for ships waiting to enter the canal...
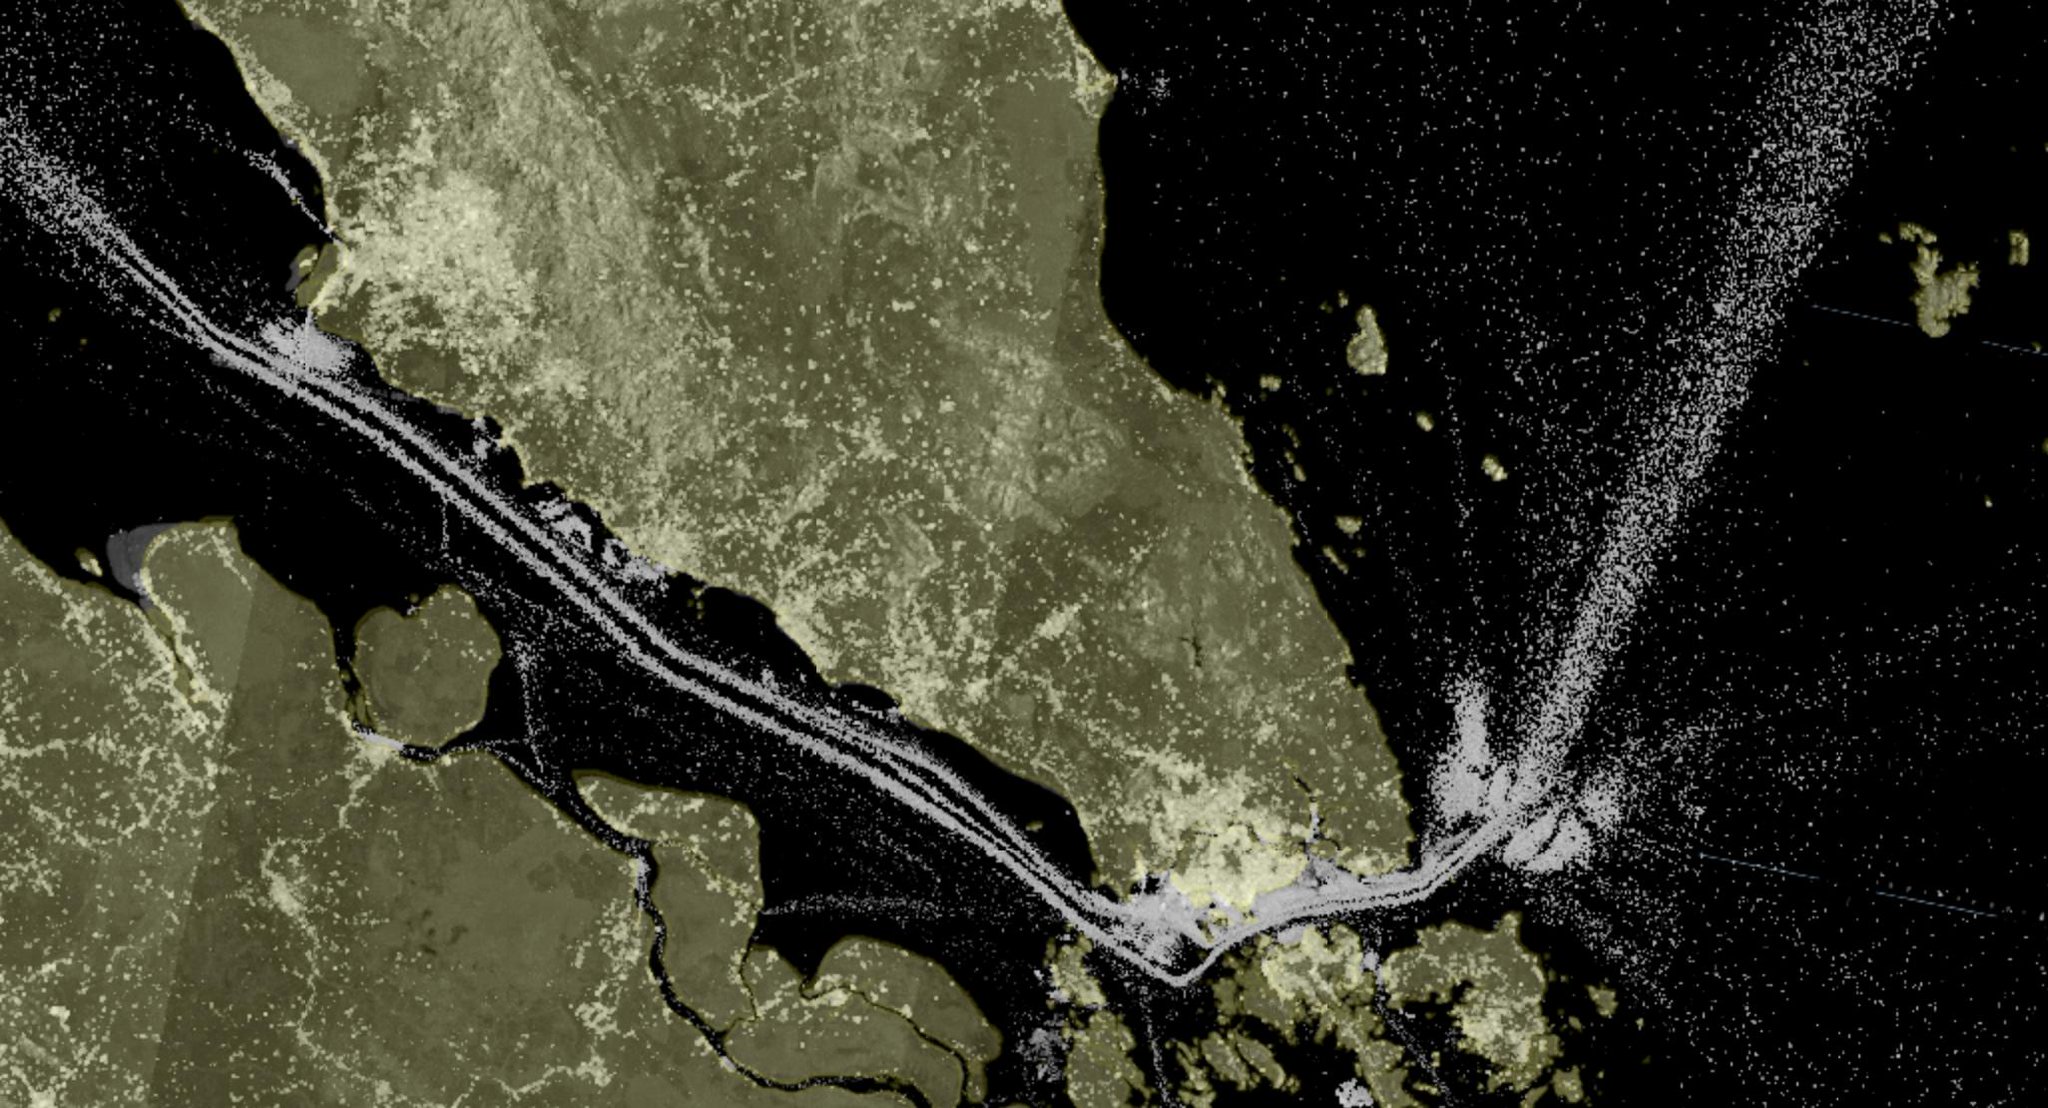
Mississippi River delta
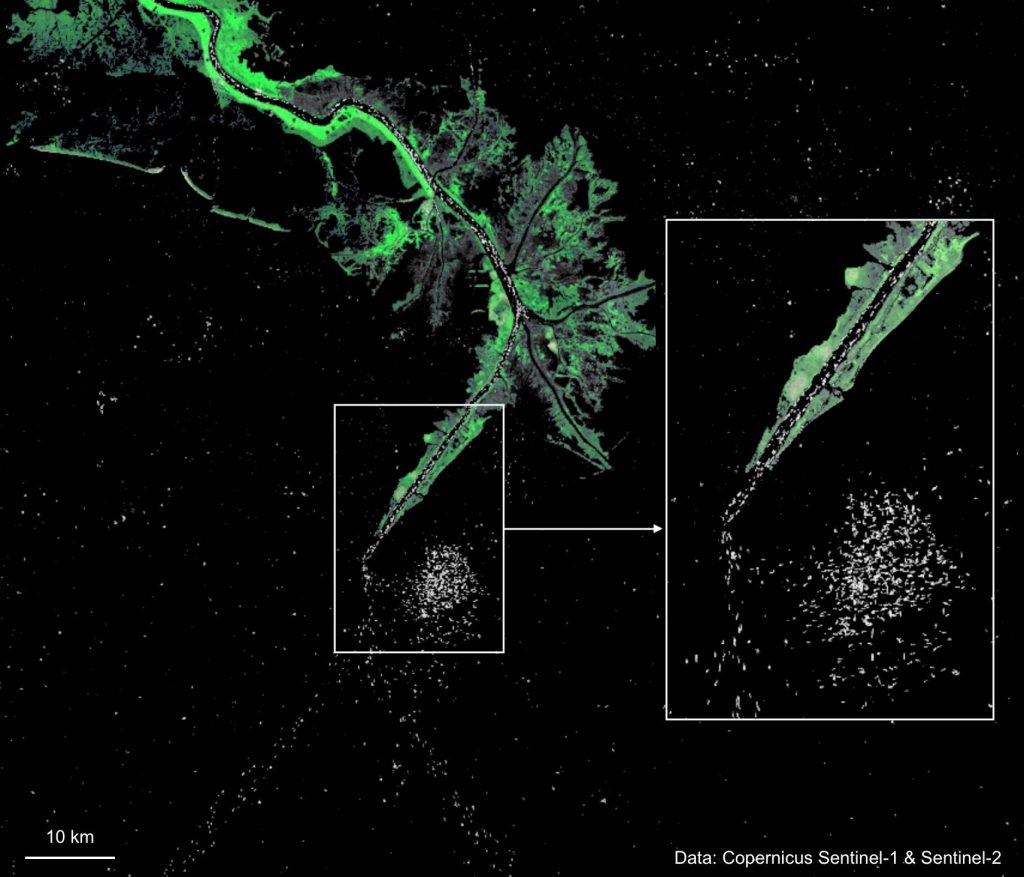 Mississippi River delta and the Gulf of Mexico. Land surface from Sentinel-2 false color composite B4/B8/B2 on 2019-04-03.
Notes
Ship detection using SAR imagery can be a bit more complex. In particular a challenge is to deal with interferences from ground sources and SAR ambiguities which create "ghost ships" [1,2,3].
However, mass processing of Sentinel-1 data accounting for this effect has been donefor maritime surveillance in the Mediterranean sea.
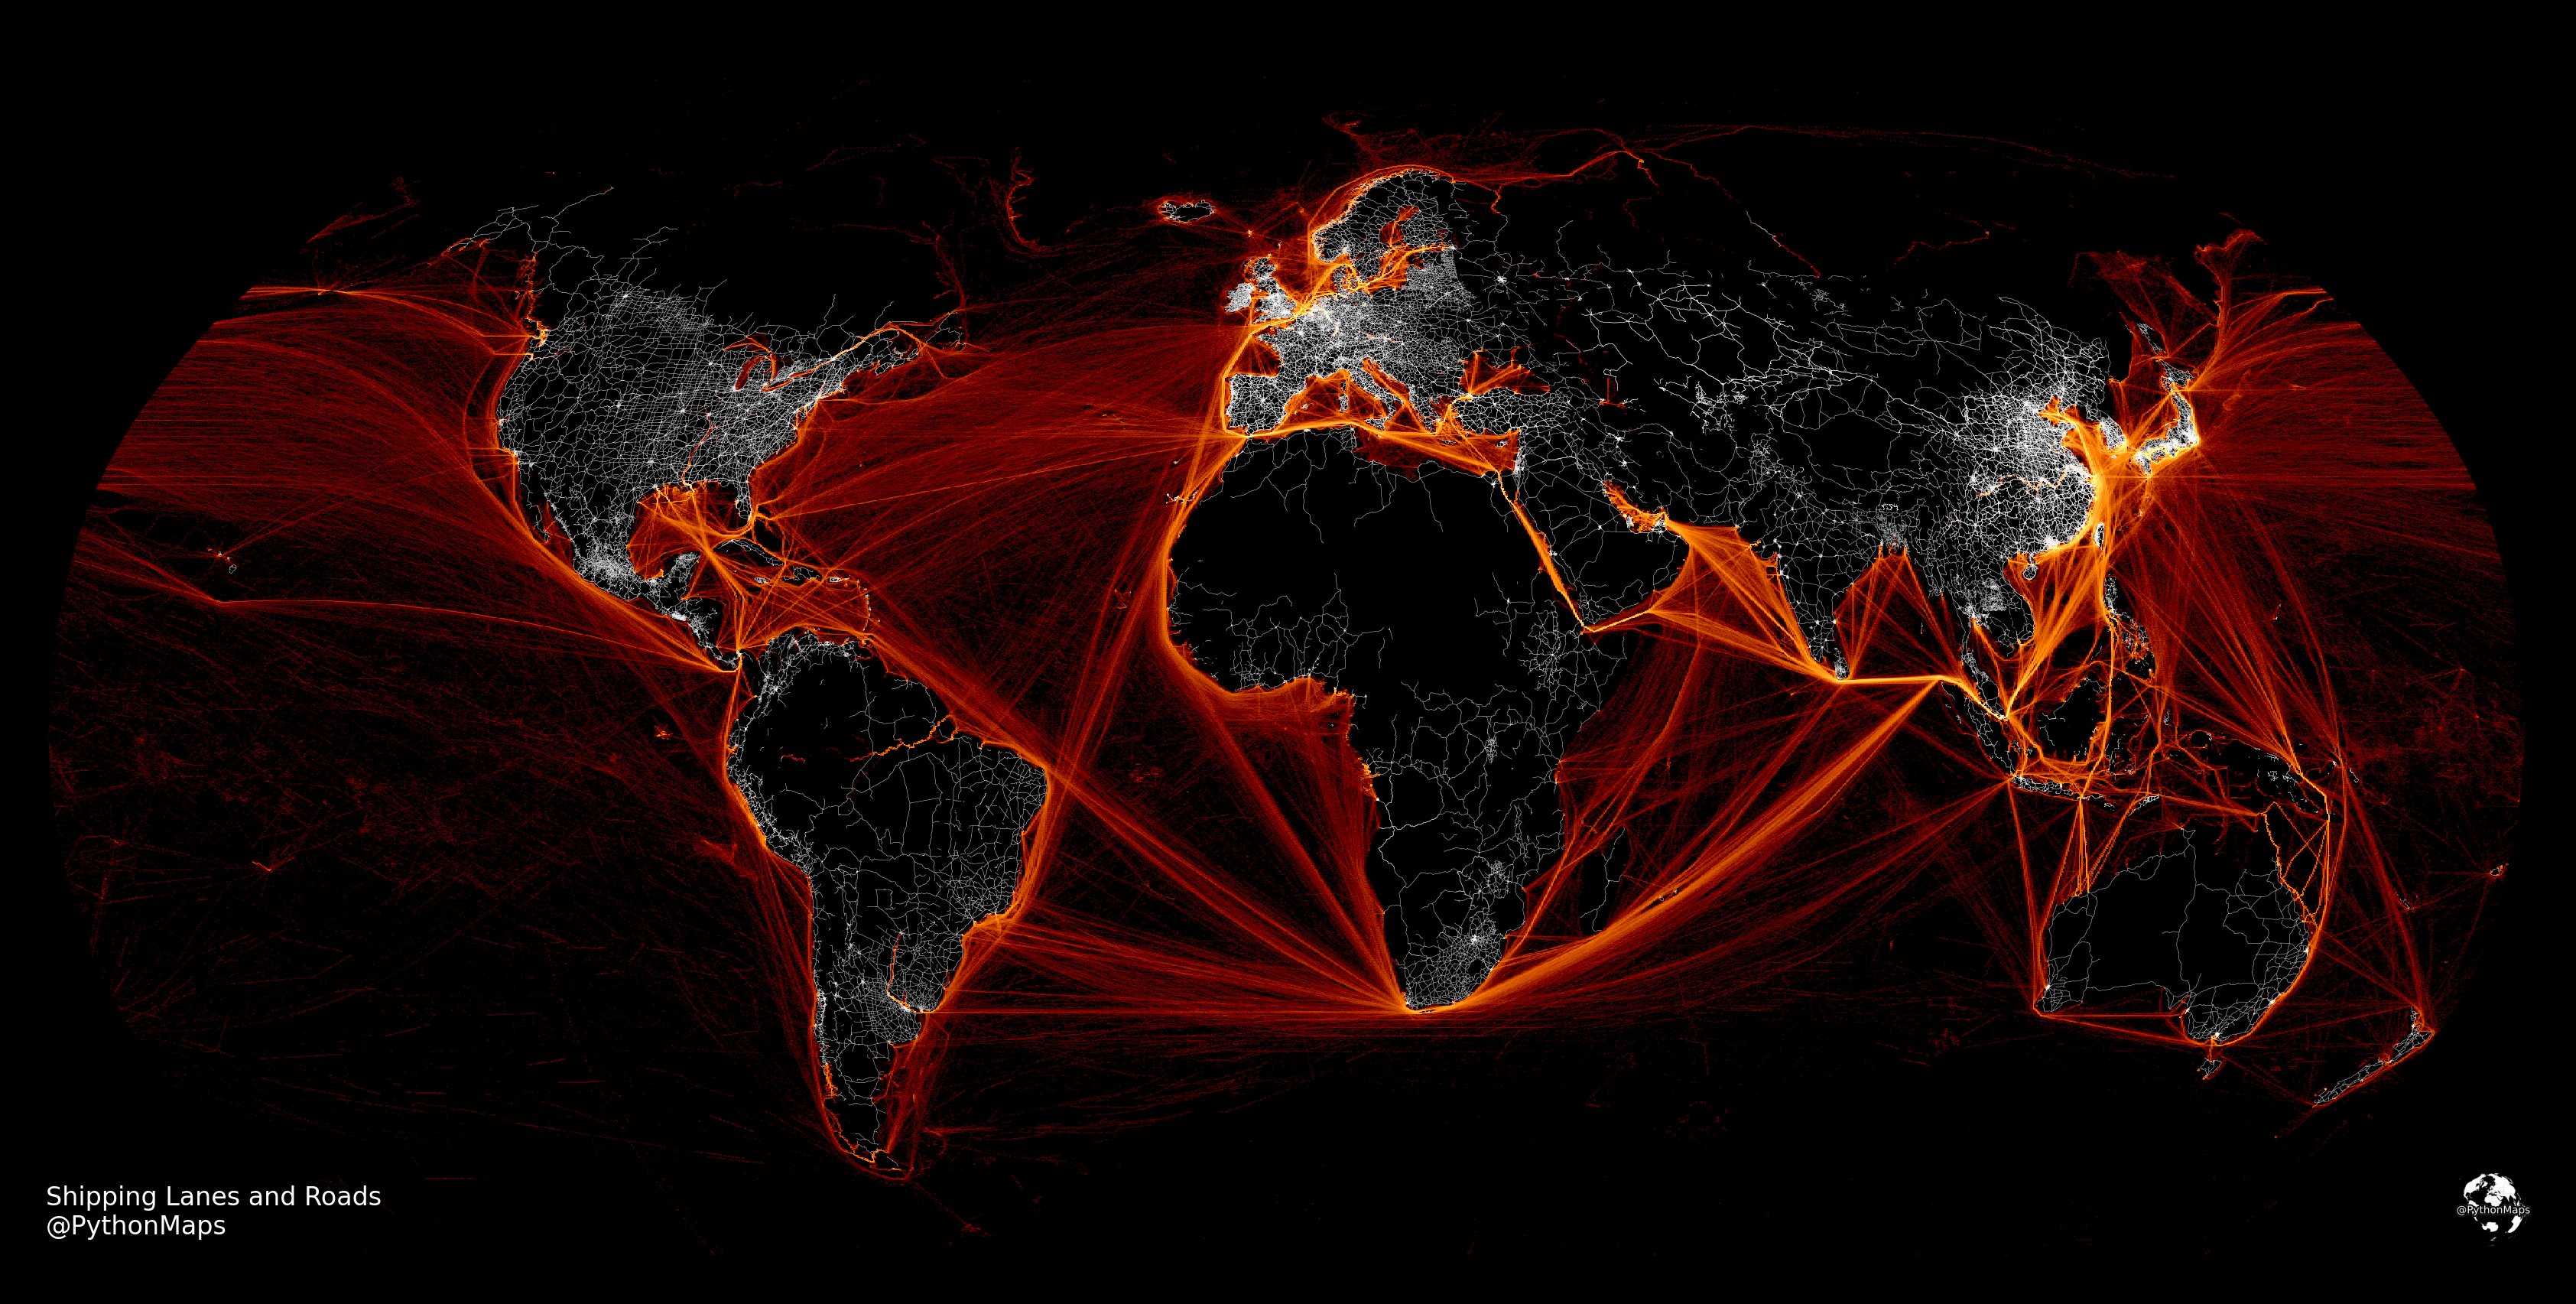
Map combining the worlds shipping lanes and the main roads on one map
If you are a GEE user and would like to play with these composites here is a quick-start script: https://code.earthengine.google.com/522465700ba56fadc5814ac457219d85).
The shipping lanes can also be visualized using Automatic Identification System (AIS) data (an automatic tracking system on ships) as done by Marine Traffic.
The shipping lanes can also be visualized using Automatic Identification System (AIS) data (an automatic tracking system on ships) as done by Marine Traffic.
AIS data are emitted by all kind of ships (even small ships that may not be detected by Sentinel-1) and not only at 6am or 6pm.
However, an AIS tracker can be switched off, whereas the Sentinel-1 radar at 693 km above sea level is out of reach...
It seems that a Greek startup SatShipAI is building a tool to automatically identify ships using Sentinel-1 data.
A new challenge for the yellow vests?
Wikipedia article on Environmental impact of shipping: "The International Maritime Organization estimates that carbon dioxide emissions from shipping were equal to 2.2% of the global human-made emissions in 2012 and expects them to rise 50 to 250 percent by 2050 if no action is taken"
Wikipedia article on Environmental impact of shipping: "The International Maritime Organization estimates that carbon dioxide emissions from shipping were equal to 2.2% of the global human-made emissions in 2012 and expects them to rise 50 to 250 percent by 2050 if no action is taken"
Links :
- MDPI : Observation of Maritime Traffic Interruption in Patagonia during the COVID-19 Lockdown Using Copernicus Sentinel-1 Data and Google Earth Engine
- GeoGarage blog : New satellite data reveals whopping boost in shipping / Image of the week : satellite's view of ... / Visualizing ocean shipping / Image of the week : In a year's worth of photos, the Sentinel-1 ...
No comments:
Post a Comment