1st North-West passage solo sailing on a beach catamaran
Saturday, October 14, 2017
Friday, October 13, 2017
Hidden ice canyons in the making
ESA’s CryoSat and the Copernicus Sentinel-1 missions have been used to measure subtle changes in the elevation and flow of ice shelves that, in turn, reveals how huge canyons are forming underneath. Warm bottom ocean water is entering the cavity under Antarctica’s Dotson ice shelf and is stirred by Earth’s rotation.
This is causing one side of the ice shelf to melt.
The canyon, which has formed over 25 years, is now 200 m deep in places and the ice just above it is heavily crevassed, affecting the shelf’s future ability to buttress the ice on land.
From ESA
We are all aware that Antarctica’s ice shelves are thinning, but recently scientists have also discovered huge canyons cutting through the underbelly of these shelves, potentially making them even more fragile. Thanks to the CryoSat and Sentinel-1 missions, new light is being shed on this hidden world.
Antarctica is surrounded by ice shelves, which are thick bands of ice that extend from the ice sheet and float on the coastal waters.
They play an important role in buttressing the ice sheet on land, effectively slowing the sheet’s flow as it creeps seaward.
The ice sheet that covers Antarctica is, by its very nature, dynamic and constantly on the move. Recently, however, there has been a worrying number of reports about its floating shelves thinning and even collapsing, allowing the grounded ice inland to flow faster to the ocean and add to sea-level rise.
While scientists continue to study the changing face of Antarctica, monitor cracks in the surface of the ice that might signal the demise of a shelf and learn how these changes are affecting the biology of coastal waters, they are also aware of dramatic changes taking place below the surface, hidden from view.
There are huge inverted canyons in the underside of ice shelves, but little is known about how they form and how they affect the stability of the ice sheet.
One type is thought to be caused by subglacial water that drains from beneath the ice sheet and runs into the ocean.
In this region, the ocean water is stratified, with the warmer water at the bottom.
However, as the colder meltwater pours down into the ocean it then rises because it is less dense than the seawater – but as it rises it drags up the warm bottom water which causes the underbelly of the floating ice shelf to melt.
Another type is thought to be caused by the way ocean water circulates under the shelf.
Scientists have been using ESA’s CryoSat to study changes in the surface of the ice shelf and the Copernicus Sentinel-1 mission to study how shelves flow to learn more about what’s going on hidden from view.
Their focus has been on the Dotson ice shelf in West Antarctica.
Noel Gourmelen from the University of Edinburgh said “We have found subtle changes in both surface elevation data from CryoSat and ice velocity from Sentinel-1 which shows that melting is not uniform, but has centred on a 5 km-wide channel that runs 60 km along the underside of the shelf.
“Unlike most recent observations, we think that the channel under Dotson is eroded by warm water, about 1°C, as it circulates under the shelf, stirred clockwise and upward by Earth’s rotation.
“Revisiting older satellite data, we think that this melt pattern has been taking place for at least the entire 25 years that Earth observation satellites have been recording changes in Antarctica.
“Over time, the melt has calved in a broad channel-like feature up to 200 m deep and 15 km across that runs the entire length of the underside of Dotson ice shelf.
“We can see that this canyon is deepening by about 7 m a year and that the ice above is heavily crevassed.
“Melt from Dotson ice shelf results in 40 billion tonnes of freshwater being poured into the Southern Ocean every year, and this canyon alone is responsible for the release of four billion tonnes – a significant proportion.
”The strength of an ice shelf depends on how thick it is. Since shelves are already suffering from thinning, these deepening canyons mean that fractures are likely to develop and the grounded ice upstream will flow faster than would be the case otherwise.
“It is the first time that we’ve been able to see this process in the making and we will now expand our area of interest to the shelves all around Antarctica to see how they are responding. We couldn’t do this without CryoSat and the European Commission’s Copernicus Sentinel missions,” added Dr Gourmelen.
Links :
Antarctica is surrounded by ice shelves, which are thick bands of ice that extend from the ice sheet and float on the coastal waters.
They play an important role in buttressing the ice sheet on land, effectively slowing the sheet’s flow as it creeps seaward.
Some fast-thinning glaciers drain into the Amundsen Sea
(Pine island, Twaites, Haynes & Pope, Smith, Kohler and Dotson Ice shelf in the Admunden Sea)
with the GeoGarage platform (NGA chart)
The ice sheet that covers Antarctica is, by its very nature, dynamic and constantly on the move. Recently, however, there has been a worrying number of reports about its floating shelves thinning and even collapsing, allowing the grounded ice inland to flow faster to the ocean and add to sea-level rise.
While scientists continue to study the changing face of Antarctica, monitor cracks in the surface of the ice that might signal the demise of a shelf and learn how these changes are affecting the biology of coastal waters, they are also aware of dramatic changes taking place below the surface, hidden from view.
Ice shelf appears flat
There are huge inverted canyons in the underside of ice shelves, but little is known about how they form and how they affect the stability of the ice sheet.
One type is thought to be caused by subglacial water that drains from beneath the ice sheet and runs into the ocean.
In this region, the ocean water is stratified, with the warmer water at the bottom.
However, as the colder meltwater pours down into the ocean it then rises because it is less dense than the seawater – but as it rises it drags up the warm bottom water which causes the underbelly of the floating ice shelf to melt.
Another type is thought to be caused by the way ocean water circulates under the shelf.
Scientists have been using ESA’s CryoSat to study changes in the surface of the ice shelf and the Copernicus Sentinel-1 mission to study how shelves flow to learn more about what’s going on hidden from view.
Their focus has been on the Dotson ice shelf in West Antarctica.
Dotson ice shelf from Sentinel-1
Noel Gourmelen from the University of Edinburgh said “We have found subtle changes in both surface elevation data from CryoSat and ice velocity from Sentinel-1 which shows that melting is not uniform, but has centred on a 5 km-wide channel that runs 60 km along the underside of the shelf.
“Unlike most recent observations, we think that the channel under Dotson is eroded by warm water, about 1°C, as it circulates under the shelf, stirred clockwise and upward by Earth’s rotation.
“Revisiting older satellite data, we think that this melt pattern has been taking place for at least the entire 25 years that Earth observation satellites have been recording changes in Antarctica.
“Over time, the melt has calved in a broad channel-like feature up to 200 m deep and 15 km across that runs the entire length of the underside of Dotson ice shelf.
“We can see that this canyon is deepening by about 7 m a year and that the ice above is heavily crevassed.
A figure showing Dotson Ice Shelf and the Amundsen Sea Sector of West Antarctica.
Colors show ice flow of grounded ice across the grounding line (white line) feeding floating ice shelves (DIS and Crosson Ice Shelf (CIS)), as well as ocean regions of high annual primary productivity (APP) (Arrigo et al., 2015).
(Image credit: Noel Gourmelen)
“Melt from Dotson ice shelf results in 40 billion tonnes of freshwater being poured into the Southern Ocean every year, and this canyon alone is responsible for the release of four billion tonnes – a significant proportion.
”The strength of an ice shelf depends on how thick it is. Since shelves are already suffering from thinning, these deepening canyons mean that fractures are likely to develop and the grounded ice upstream will flow faster than would be the case otherwise.
“It is the first time that we’ve been able to see this process in the making and we will now expand our area of interest to the shelves all around Antarctica to see how they are responding. We couldn’t do this without CryoSat and the European Commission’s Copernicus Sentinel missions,” added Dr Gourmelen.
Links :
Thursday, October 12, 2017
There’s enough wind energy over the oceans to power human civilization, scientists say
From Washington Post by Chris Mooney
New research published on Monday finds there is so much wind energy potential over oceans that it could theoretically be used to generate “civilization scale power” — assuming, that is, that we are willing to cover enormous stretches of the sea with turbines, and can come up with ways to install and maintain them in often extreme ocean environments.
It’s very unlikely that we would ever build out open ocean turbines on anything like that scale — indeed, doing so could even alter the planet’s climate, the research finds.
But the more modest message is that wind energy over the open oceans has large potential — reinforcing the idea that floating wind farms, over very deep waters, could be the next major step for wind energy technology.
“I would look at this as kind of a greenlight for that industry from a geophysical point of view,” said Ken Caldeira of the Carnegie Institution for Science in Stanford, Calif.
The study, in the Proceedings of the National Academy of Sciences, was led by Carnegie researcher Anna Possner, who worked in collaboration with Caldeira.
An offshore wind farm stands in the water near the Danish island of Samso, May 19, 2008. Reuters/Bob Strong
The study takes, as its outset, prior research that has found that there’s probably an upper limit to the amount of energy that can be generated by a wind farm that’s located on land.The limit arises both because natural and human structures on land create friction that slows down the wind speed, but also because each individual wind turbine extracts some of the energy of the wind and transforms it into power that we can use — leaving less wind energy for other turbines to collect.
“If each turbine removes something like half the energy flowing through it, by the time you get to the second row, you’ve only got a quarter of the energy, and so on,” explained Caldeira.
The ocean is different.
First, wind speeds can be as much as 70 percent higher than on land.
But a bigger deal is what you might call wind replenishment.
The new research found that over the mid-latitude oceans, storms regularly transfer powerful wind energy down to the surface from higher altitudes, meaning that the upper limit here for how much energy you can capture with turbines is considerably higher.
“Over land, the turbines are just sort of scraping the kinetic energy out of the lowest part of the atmosphere, whereas over the ocean, it’s depleting the kinetic energy out of most of the troposphere, or the lower part of the atmosphere,” said Caldeira.
Wind farms offshore British coast with the GeoGarage platform (UKHO ENCs)
The study compares a theoretical wind farm of nearly 2 million square kilometers located either over the U.S. (centered on Kansas) or in the open Atlantic.
And it finds that covering much of the central U.S. with wind farms would still be insufficient to power the U.S. and China, which would require a generating capacity of some 7 terawatts annually (a terawatt is equivalent to a trillion watts).
But the North Atlantic could theoretically power those two countries and then some.
The potential energy that can be extracted over the ocean, given the same area, is “at least three times as high.”
It would take an even larger, 3 million square kilometer wind installation over the ocean to provide humanity’s current power needs, or 18 terawatts, the study found.
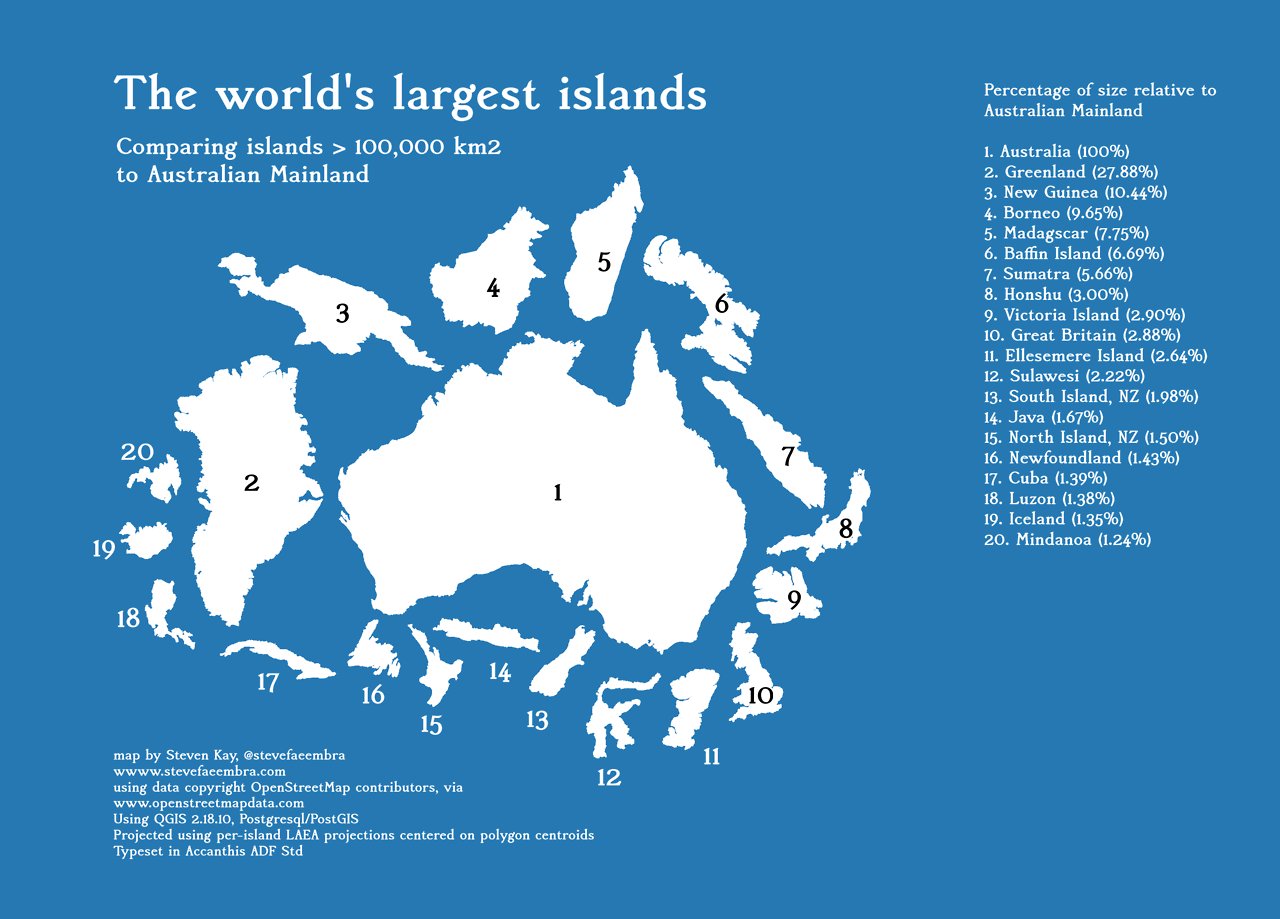
That’s an area even larger than Greenland.
Hence, the study concludes that “on an annual mean basis, the wind power available in the North Atlantic could be sufficient to power the world.”
It is not just utility companies racing to respond to the rise of renewable energy.
Oil and gas giant Statoil is building on four decades of offshore experience to erect its first floating wind farm.
But it’s critical to emphasize that these are purely theoretical calculations.
They are thwarted by many practical factors, including the fact that the winds aren’t equally strong in all seasons, and that the technologies to capture their energy at such a scale, much less transfer it to shore, do not currently exist.
Oh, and then there’s another large problem: Modeling simulations performed in the study suggest that extracting this much wind energy from nature would have planetary-scale effects, including cooling down parts of the Arctic by as much as 13 degrees Celsius.
“Trying to get civilization scale power out of wind is a bit asking for trouble,” Caldeira said.
But he said the climate effect would be smaller if the amount of energy being tapped was reduced down from these extremely high numbers, and if the wind farms were more spaced out across the globe."
“I think it lends itself to the idea that we’re going to want to use a portfolio of technologies, and not rely on this only,” said Caldeira.
Energy gurus have long said that among renewable sources, solar energy has the greatest potential to scale up and generate terawatt-scale power, enough to satisfy large parts of human energy demand.
Caldeira doesn’t dispute that.
But his study suggests that at least if open ocean wind becomes accessible someday, it may have considerable potential too.
Wind farms projects in Europe
blue : authorized / green : operational / grey : planned /
brown : production / red : under construction
source : EMODNET
Alexander Slocum, an MIT mechanical engineering professor who has focused on offshore wind and its potential, and who was not involved in the research, said he considered the paper a “very good study” and that it didn’t seem biased.
“The conclusion implied by the paper that open ocean wind energy farms can provide most of our energy needs is also supported history: as a technology gets becomes constrained (e.g., horse drawn carriages) or monopolized (OPEC), a motivation arises to look around for alternatives,” Slocum continued by email.
“The automobile did it to horses, the U.S. did it to OPEC with fracking, and now renewables are doing it to the hydrocarbon industry.”
“The authors do acknowledge that considerable technical challenges come into play in actually harvesting energy from these far off-shore sites, but I appreciate their focus on the magnitude of the resource,” added Julie Lundquist, a wind energy researcher at the University of Colorado, Boulder.
“I hope this work will stimulate further interest in deep water wind energy.”
Underscoring the theoretical nature of the calculations, Lundquist added by email that “current and foreseeable wind turbine deployments both on- and off-shore are much smaller than would be required to reach the atmospheric energy limitations that this work and others are concerned with.”
The research points to a kind of third act for wind energy.
On land, turbines are very well established and more are being installed every year.
Offshore, meanwhile, coastal areas are now also seeing more and more turbine installations, but still in relatively shallow waters.
But to get out over the open ocean, where the sea is often well over a mile deep, is expected to require yet another technology — likely a floating turbine that extends above the water and sits atop some kind of very large submerged floating structure, accompanied by cables that anchor the entire turbine to the seafloor.
Each wind turbine is taller than Big Ben and the farm can power 20,000 homes.
Experimentation with the technology is already happening: Statoil is moving to build a large floating wind farm off the coast of Scotland, which will be located in waters around 100 meters deep and have 15 megawatts (million watts) of electricity generating capacity.
The turbines are 253 meters tall, but 78 meters of that length refers to the floating part below the sea surface.
“The things that we’re describing are likely not going to be economic today, but once you have an industry that’s starting in that direction, should provide incentive for that industry to develop,” said Caldeira.
Links :
- OilPrice : Can Deep Water Wind Farms Power The World?
- GeoGarage blog : Offshore wind power cheaper than new nuclear / North Sea wind power hub: A giant wind farm to power all ... / Wind power takes to the seas / Image of the week : Offshore wind farms ... / The new Viking invasion: How Denmark's offshore wind giant ...
- YouTube : The innovations and projects transforming wind power | Sustainable Energy (part I / II)
Wednesday, October 11, 2017
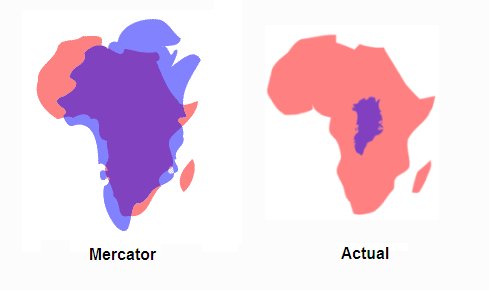
Mercator projection : the Greenland problem
Greenland's size using the Mercator projection vs its actual size
courtesy of Bob Lammle, Mental Floss
Many large countries seem to be as tall as Greenland
courtesy of Bob Lammle, Mental Floss
The Mercator projection creates increasing distortions of size as you move away from the equator.
As you get closer to the poles the distortion becomes severe.
Cartographers refer to the inability to compare size on a Mercator projection as "the Greenland Problem."
Greenland appears to be the same size as Africa, yet Africa's land mass is actually fourteen times larger (see figure below right).
The nineteen largest islands in the world in a to-scale
Because the Mercator distorts size so much at the poles it is common to crop Antarctica off the map. This practice results in the Northern Hemisphere appearing much larger than it really is.
Typically, the cropping technique results in a map showing the equator about 60% of the way down the map, diminishing the size and importance of the developing countries. (from Peter's Map)
Many large countries seem to be as tall as Greenland
Whether you realize it or not, you're probably pretty familiar with the
Mercator projection.
It's the chosen map of Google, and often displayed
in classrooms around the country.
It's also inaccurate.
Links :
- Mapzen : Escape from Mercator
- MrGris : Mercator extreme
- GISgeography : Map distorsion with Tissot's indicatrix
- The True size
- Rhumb Lines and Map Wars: A Social History of the Mercator Projection by Mark Monmonier
- GeoGarage blog : Advisory notice on "Web Mercator" / Japan's 'Good Design Award' goes to this crazy accurate World Map
New charts for Greenland added in the Denmark DGA layer in the GeoGarage platform
Greenland DGA charts added in the Denmark layer in the GeoGarage platform
see GeoGarage news
The video shows a brief cluster of measurements in Greenland 2016.
The vessels used are the Inspection vessel Ejnar Mikkelsen and its Navy vessel SAR2 (Naja Mikkelsen).
The survey was conducted on the route Sdr Strømfjord to Sisimiut.
The survey itself is that Ejnar Mikkelsen operates externally, where business traffic mainly passes, while the SAR vessel operates in shallow inland routes and remote fjords primarily used by dinghies and small boats.
The video shows, among other things, filmed footage from the two ships, as well as animated films that show how data collection takes place in practice.
Greenland, Iceland, and Frisland on the Gerardus Mercator world map of 1569
Greenland map (1616) made by Flemish cartographer Petrus Bertius.
Greenland map (1616) made by Flemish cartographer Petrus Bertius.
1747 map of old Greenland or Oster Bygd & Wester Bygd,
agreeable to Egede's late description of Greenland
1747 map of Greenland, Iceland and the Faroe Islands
1747 map of Greenland, Iceland and the Faroe Islands
Bjarne Rasmussen tells - in English - about the risk and the disastrous consequences that may be about to navigate the icy waters of Greenland in summer time.
Greenland’s coasts are growing as seas rise
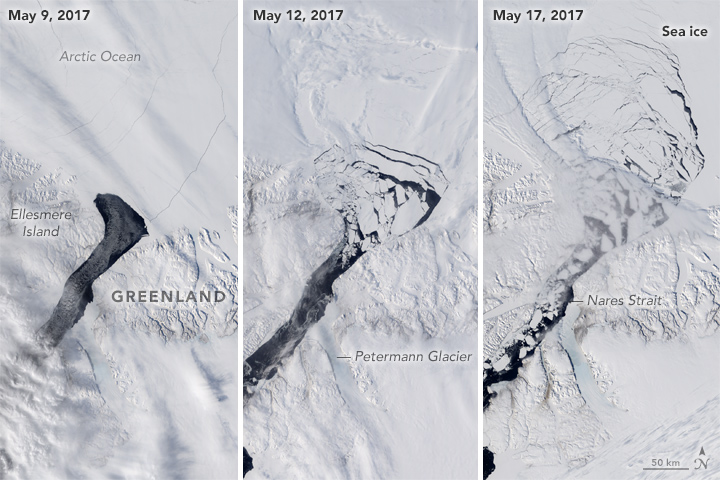
Saunders Island and Wolstenholme Fjord with Kap Atholl in the background are seen in an image taken during an Operation IceBridge survey flight of Greenland in April 2013.
(Michael Studinger/NASA/Reuters)
From Scientific American by Chelsea Harvey E&E News reporter
Melting glaciers are causing Greenland’s delta regions to expand
Around the world, from Alaska's remote North Slope to the island nations in the South Pacific, coastal communities are watching their shorelines slip away into the rising seas.
But in an unexpected discovery, scientists have found one place where the effects of climate change are having the opposite impact.
Meet Helheim, a glacier in Greenland of exquisite beauty at every scale.
The finding is all the more surprising considering that Greenland is home to the world's second-largest ice sheet, whose melting glaciers are among the planet's biggest potential contributors to future sea-level rise.
Breakdown of an Ice Arch
Here's the surprise: It's the melting glaciers that are causing these delta regions to expand, scientists say.
In their findings published Tuesday in the journal Nature, the researchers note that as glaciers melt, they send fresh water and loose sediment flowing out toward the ocean.
The sediment is then deposited along the coastline where the rivers meet the sea, causing the delta to expand outward.
"We were surprised to see that in Greenland we had the exact opposite trend of what is going on in the rest of the Arctic," said Mette Bendixen of the University of Copenhagen, the study's lead author.
The researchers had expected the ocean to play a bigger role in eroding away the coastline, as it has elsewhere—especially as climate change is causing more Arctic sea ice to melt away, leaving the surface of the water exposed.
Instead, they found that Greenland's deltas are largely shielded from the ocean's waves by the presence of large, steep-cliffed fjords.
The researchers made their discovery by examining aerial imagery from the 1940s and 1980s—including photographs taken on flights by the U.S.
Army during World War II—and Google Earth satellite imagery from the 2000s to see how Greenland's deltas had changed over time.
They found that the deltas remained mostly static between the 1940s and the 1980s, but expanded from the 1980s on.
Topographic figure from the new study.
On the left (a), the figure is color coded between -1500 m and +1500 m with respect to mean sea level, with areas below sea level in blue.
On the right (b) the figure shows regions below sea level (light pink), that are connected to the ocean and maintain a depth below 200 m (dark pink), and that are continuously deeper than 300 m below sea level (dark red).
The thin white line shows the current ice sheet extent.
(Mathieu Morlighem)
These findings suggest that Greenland's glaciers have been experiencing increasing ice loss for at least three decades—a result that may reinforce scientists' concerns over the stability of the melting ice sheet.
The research also suggests that areas with more intense meltwater runoff are seeing the most expansion along the coastline.
It may seem like the Greenland coast is catching a rare break, while other coastal regions throughout the Arctic are slipping away.
According to Bendixen, it's been well-documented that shorelines in Alaska, Canada and Russia are "generally eroding," and there's great concern about what will happen to the human communities in these places.
Multiple Alaskan villages have already begun preparing for the need to relocate.
Several open-fan deltas are located along the coast within the narrow fjord in Greenland.
(Anders Anker Bork)
But Bendixen cautioned that Greenland's expanding deltas are not necessarily a good thing for nearby human communities either.
They rely heavily on fishing and tourism, she noted—but as the deltas push outward, the harbors that these industries depend on become sandy and difficult to navigate.
And if ice loss continues to accelerate in the warming Arctic, this effect may only become more pronounced in the future.
Two open-fan deltas located in a narrow fjord in Greenland.
In the distal part of the image, a restricted delta and its plume of sediment is visible.
(Anders Anker Bjork)
But these changes send another message, as well, one that reverberates far beyond the Greenland shore.
The shifting coastline is a sobering reminder that Greenland's ice sheet is changing, as well, in ways that could have dramatic consequences throughout the rest of the world.
Links :
- Washington Post : Scientists mapping Greenland have produced some surprising – and worrying – results
- NASA : NASA flights map summer melt of Greenland ice sheet / NASA UCI reveal new details of Greenland ice loss
- The New Yorker : Greenland is melting
- Wired : Science Torpedoes Reveal How Greenland Is Melting From Below
- PBS : First data in from nasas oceans are melting greenland mission
- The Guardian : OMG measurements of Greenland give us a glimpse of future sea rise
Tuesday, October 10, 2017
An ingenious use of big data helped expose a Chinese company illegally poaching thousands of sharks

Hammerheads were among 150 tons of illegally caught sharks in the hold of the Fu Yuan Yu Leng 999.
(Reuters/Jorge Silva)
From Quartz by Gwynn Guilford
Last month, Ecuadorian authorities busted a ship carrying one of the largest caches of illegally caught sharks in history.
The crew of the ship has now been tried, fined, and sentenced.
Yet the plot of this complicated tale—a rare glimpse into the black market trade made possible by industrialized global fishing—just keeps on thickening.
First a rundown of what happened.
On Aug. 13, Ecuadorian coast guards intercepted the Fu Yuan Yu Leng 999 with 300 tons of fish—more than half of which was sharks, including babies and endangered species—crammed in its hold.
The FYY Leng 999 (as we’ll abbreviate it, since other ships with “Fu Yuan Yu” in their names are about to enter the picture) is a Chinese-flagged refrigerated-cargo vessel, one of the key technologies underlying the industrialization of marine fishing.
These “reefers,” as they’re sometimes known, don’t catch fish.
Instead they buy them from other fishing vessels, storing them in their massive refrigerated holds while the other boats head back out to catch more.
The FYY Leng 999 obviously didn’t catch the sharks.
But who, then, did?
A new report out today by Caixin (paywall), a leading Chinese financial magazine, gets us a step closer to the answer.
Chinese authorities insist that the ships that poached the sharks are two Taiwan-flagged vessels named Hai Fang 301 and Hai Fang 302, citing receipts reported by Ecuadorian authorities that were found onboard the FYY Leng 999 and China’s fishery administration’s conversation with that ship’s captain.
This implies that Chinese involvement was limited to transshipment, and not actual poaching—something the government might want to emphasize given increasing attention to its subsidizing fishing fleets accused of depleting other countries’ marine resources.
(Technically, China claims Taiwan as its sovereign territory, but never mind that.)
There’s a catch, though.
Neither Hai Fang 301 nor Hai Fang 302 are registered with any country.
Meaning, they don’t exist.
So who, then, did catch the 150 tons of sharks?
SkyTruth, a nonprofit, retraced FYY Leng 999‘s journey from China to Ecuador’s Galapagos Islands using Global Fishing Watch, a platform that employs artificial intelligence to collect and analyze ships’ satellite data, which SkyTruth created in collaboration with Google and another nonprofit, Oceana, in 2014.
After departing on July 7, it chugged steadily across the Pacific for a month and then, on Aug.
5, suddenly stopped.
But it wasn’t alone in the vast emptiness of the eastern Pacific.
Soon, four vessels joined the FYY Leng 999, each sidling up to the reefer for about 12 hours at a time.
“These lengthy rendezvous at sea suggest a substantial transfer of cargo was possible,” said Skytruth.

Fu Yuan Yu Leng 999 meets up with the four other Fu Yuan Yus.
The four ships are—and this is where it gets confusing—Fu Yuan Yu 7861, Fu Yuan Yu 7862, Fu Yuan Yu 7865, and Fu Yuan Yu 7866.
They’re supposed to be catching tuna.
Was this quartet of “Fu Yuan Yu” the culprit?
Two of the vessels are owned by NASDAQ-listed Pingtan Marine Enterprises, China’s second-biggest marine-fishing company, according to the company’s website.
And Pingtan has a special relationship with Fuzhou Hong Long, the company that owns FYY Leng 999.
The CEO and majority owner of Pingtan is Zhuo Xingrong.
His wife, Lin Ping, happens to be the biggest shareholder of Fuzhou Hong Long, according to Pingtan’s financial statements.
She may, however, have recently shifted ownership to a company owned by Zhuo’s brother, who also happens to be a director of Pingtan, reports Caixin.
Despite all this, the Chinese fisheries authority doubled down on blaming the fictitious Taiwanese ships, telling Caixin they may have traveled undetected by turning off their satellite positioning systems.
Since to do so, these ghost ships would have had to travel the Pacific without satellite navigation for the entirety of their journey, this conjecture is highly unlikely, fishing experts told Caixin.
And while Pingtan CEO Zhuo wouldn’t comment on the alleged involvement of his tuna FYYs, he told Caixin that the captain of FYY Leng 999 is an old friend of the captain of the two Taiwanese boats that supposedly caught the sharks.
But, wait—if Hai Fang 301 and Hai Fang 302 don’t exist, where’d the receipts onboard FYY Leng 999 come from?
It turns out when reporting the incident, the Ecuadorian authorities misspelled the ships names; the receipts cited in court were for Hai Feng 301 and Hai Feng 302, reports Caixin. Doh.
Weirdly, a vessel named Hai Feng 301—but renamed Hai Fa in 2009—was convicted of illegal trade in 66 tons of hammerheads and whitetip sharks (both protected species) in Indonesia in 2015, according to Greenpeace.
That vessel—which, like FYY Leng 999, is a reefer—is owned by a Hong Kong-registered company that Caixin links to Pingtan.
But in July and August of this year, Hai Fa was nowhere near the eastern Pacific.
The remaining unsettled question is where the FYY Leng 999 was ultimately headed when Galapagos authorities apprehended it.
SkyTruth has a hunch.
It turns out FYY Leng 999 has a history of operating near where suspicious fishing activity is afoot.
This includes palling around with an unregulated squid fleet in the northwest Indian Ocean in 2016.
And—what do you know?—around the corner from where the FYY Leng 999 was busted, there it is: a cluster of squid ships, bobbing just beyond Ecuador’s territorial waters, near a critical hammerhead breeding ground.

Links :
- Bloomberg : Paul Allen Wants to Use Satellites and Software to Fight Illegal Fishing
- Dataconomy : When data science alone won't cut it
- Science : Illegal fishing on the Galápagos high seas
- GeoGarage blog : China's appetite pushes fisheries to the brink / Nations will start talks to protect fish of the high seas / Getting serious about overfishing / Fighting illegal fishing with Big Data / Just where exactly did China get the South China Sea ... / Green groups are harnessing data from space / Global Fishing Watch lets you track 35000 ... / Google's global fishing watch is using ...
Monday, October 9, 2017
SS Thistlegorm images released by Nottingham University
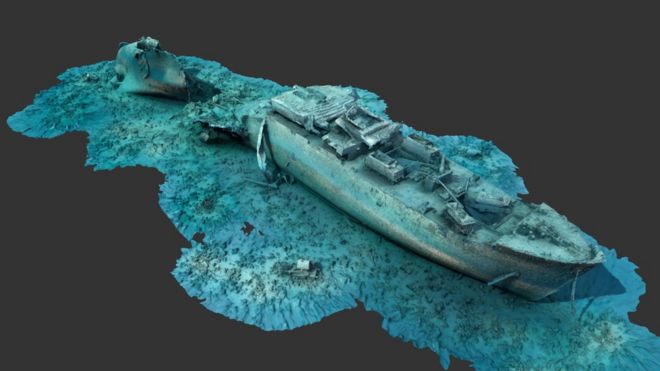
It is the first time the shipwreck has been viewed in this way
From BBC by
New 3D images of one of the world's best known World War Two dive sites have been released to the public.
British merchant steam ship SS Thistlegorm was hit by a German bomber in 1941 and lies on the bed of the Red Sea off the coast of Egypt.
(British ship launched on the 9th April 1940, 126.5 m lenght, 4.898 tons,
sunk on the 6th of October 1941)
The Thistlegorm Project, led by the University of Nottingham, could help to preserve its valuable remains.
Director Dr Jon Henderson said the shipwreck deserved to be seen by the wider public.
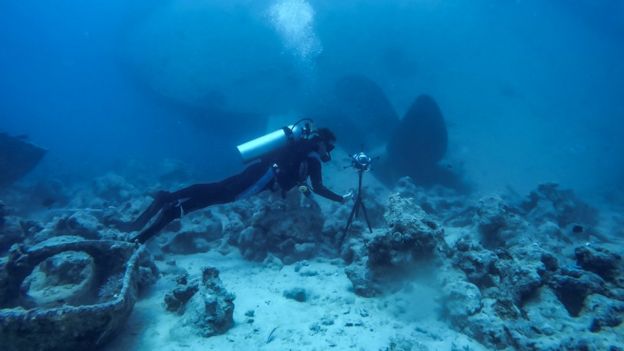
Divers had to take part in 12 dives to gather enough images
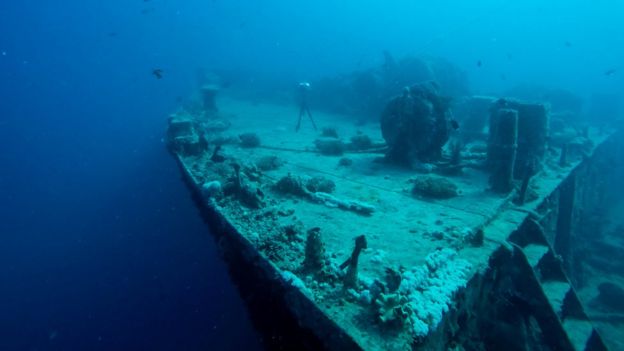
Some of the Thistlegorm's original features can still be see
A website has been launched to enable people to view the images.
SS Thistlegorm was carrying trains, aircraft parts, trucks and motorbikes, and heading to Egypt to support the allied war effort when it was hit.
Five Royal Navy gunners and four merchant sailors lost their lives.
The wreck has become one of the most famous dive sites in the world due to the clear water and military equipment still on board.
Dr Henderson, from the university's School of Archaeology, said: "The thing about underwater sites and the importance of underwater cultural heritage is that the only people who've ever seen it are divers.
"However, we are now at a point where we have the technology to reconstruct these sites."
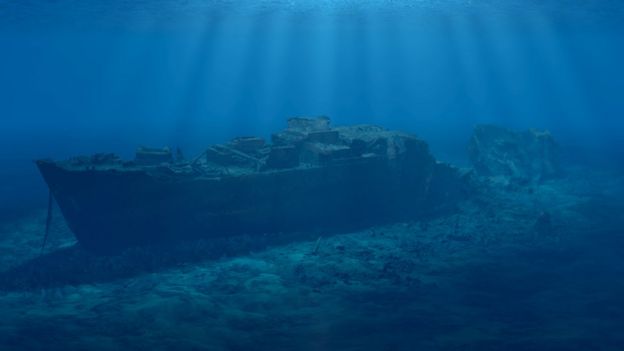
The ship is popular with divers in the Red Sea
The university said the photogrammetric survey was one of the largest ever carried out on a shipwreck, with 24,307 high resolution pictures taken during 12 dives at the site.
"The Thistlegorm is an amazing resource, it's a remarkable snapshot in history, it's got all this material from World War Two sitting on it and so there is a lot to learn from the wreck," said Dr Henderson.
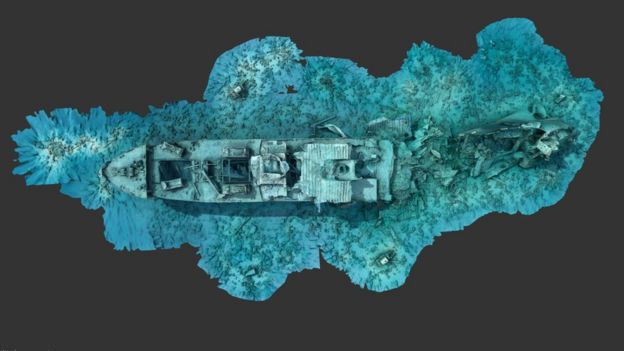
Dr Henderson said much could be learned from the wreck
The university said the underwater archaeological project was one of the first to utilise 360 video, which will allow people to experience what it is like to dive to the wreck.
Dr Henderson said the wreck had no legal protection and needed to be properly recorded.
"Carrying out a baseline survey (such as this) of exactly what's there is the first step in doing that," he said.
We can then chart changes over time and look at what we need to protect."
Links :
Sunday, October 8, 2017
1539 Agnese atlas containing the first map to show Magellan’s voyage around the world
The oval world map (no. 10) shows Magellan's route around the world and a route
from Spain to Peru.
The 12 wind cherubs on this map are named.
The 12 wind cherubs on this map are named.
source LOC
Between 1536 and 1564 an enterprising Genoese chartmaker, Battista Agnese, produced in Venice a number of remarkably accurate and beautifully decorated nautical or "portolan" atlases on vellum for merchant princes and ranking officials.
A version of this oval world map appeared in each of the seventy-one such atlases that have survived.
Agnese liked to show new discoveries and explorations of his maps, and this one includes the route that Magellan took around the world, inscribed in pure silver that later tarnished.
He also traced, in pure gold, the route from Cadiz, Spain, to Peru, with overland portage across the Isthmus of Panama.
This was the route of the treasure ships -- heavily armed galleons that carried vast amounts of silver from Peru to Spain.
On the Agnese map continents are in yellow and green watercolors, mountains in brown, white, and silver, rivers (including the legendary sources on the Nile) in blue, and the Red Sea and Gulf of California in red.
(In 1539 the explorer Francisco de Ulloa, noting that the water in the Gulf of California had a reddish tint, named it the Vermilion Sea to distinguish it form the Red Sea.)
In the blue-and-gold clouds surrounding the oval world are cherubs, or wind heads, representing the classical twelve-point winds from which modern compass directions evolved.
The symbolic treatment of winds first occurred in world maps of the tenth century on which the windblowers are portrayed as human figures seated on Aeolus bags.
With one hand they hold trumpets or horns, and with the other they squeeze the wind out of the bags.
This symbolism was at least as old as Homer, who wrote of Aeolus, the son of Hippotes, god and father of the winds and ruler of the island of Aeolia.
Figures of old men, cherubs, or angels as windblowers, with or without Aeolus bags, were popular illustrations on maps up to the eighteenth century.
In some cases the facial expression and size of the blast emerging from the mouth told a great deal about the wind, without further explanation.
The portolan atlas containing this world map was drawn in Venice in 1543-44.
It was originally prepared for and dedicated to Hieronimus Ruffault, abbot of the Benedictine monastery of St. Vaast and St. Adrian in Arras, a French city of Gallo-Roman origin.
The map is also known to have been in the library of the old Hanseatic League town of Wernigerode, Germany, in 1916, to have subsequently been offered for sale by Otto Lange in Florence, and to have been in the possession of Lathrop Harper in New York.
It was acquired by the Library of Congress in 1943.


