Courtesy subjects : Taryn Colbert, MH Illustrations
From Men'shealth by Cori Ritchey
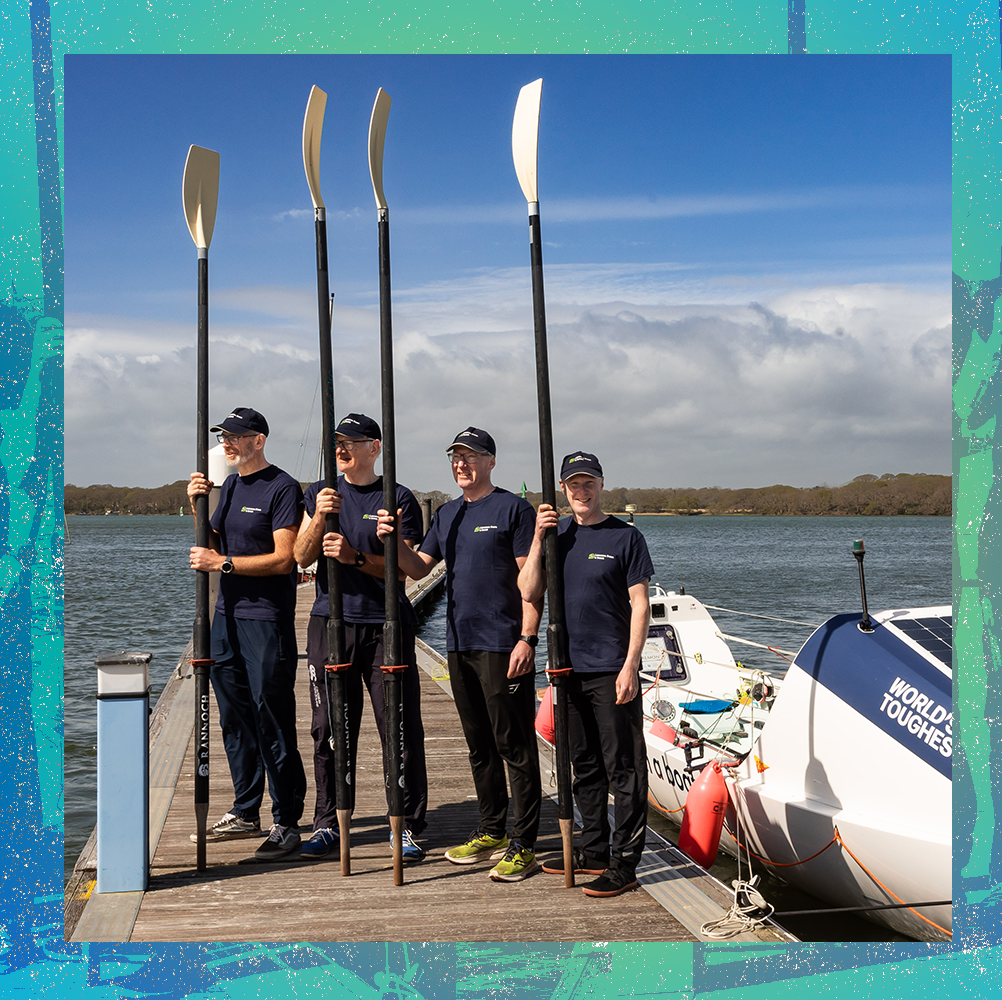
Three years ago, four friends committed to a lofty goal: row a boat 3,000 miles from the Canary Islands just off the coast of Africa, all the way across the Atlantic Ocean to Antigua.
The UK-based team are all water sport and adventure enthusiasts, each with his own niche.
Dan Dicker (52) is the group's techie, Jon Wilburn (52) is the ocean navigation specialist, Jason Howard (59) is the medical and physical support, and Steve Potter (62) is the "oldie with muscles of steel and unflappable constitution."
Most of them are avid rowers, and have been wanting to take on the World's Toughest Row for years.
The men will be at sea for what could be over 50 days.
They'll spend those 50 days alternating two hours of rowing, two hours of rest, day and night.
While they're excited for their grueling endeavor, their goals for the undertaking extend beyond that.
There's the change they've worked to inspire in their communities.
The awareness and support they've worked to raise for causes they care deeply about.
Diabetes awareness, cancer research, and efforts to curb ocean pollution are all top of mind.
The team embarks on their journey on December 12th.
In early November, Men's Health got a chance to sit down with teammates Jason and Steve to discuss how they're preparing for the journey physically, emotionally, and mentally.
Courtesy Subjects
MEN'S HEALTH: How did the idea of participating in the World's Toughest Row come about?
STEVE POTTER: John and I have been thinking about it for about 20 years, and then about three years ago, he said, "if we're going to do it, we need to do it now." And Jason and I completed a course out in the Mediterranean about three years ago, and Jason was very keen on getting on board.
And then John rang up a friend from university, Dan, and he immediately said yes.
We've been campaigning since.
JASON HOWARD: It's amazing how much goes into all the preparation.
There's so much that goes into it, in terms of sponsorship, preparing everything, getting the boat, getting all our kits ready, and doing all the competencies that we have to do.
It's a tremendous amount of work, and it's taken us three years to pack all that in.
SP: One thing we decided quite early on was we wanted this to have bigger impact.
There are three elements to it.
There's the the selfish element of, yeah, we want to row across the Atlantic, but we also want to use the opportunity to reach out to youngsters in our community.
We've been to about 45 to 50 schools in our area, and we talked to them about the benefits of getting out of your comfort zone and getting out there and going for a walk on the beach or playing in the woods—getting away from all these devices.
It's about making sure you get outside, appreciate the big outdoors, and personally speaking, I've really enjoyed that element of it.
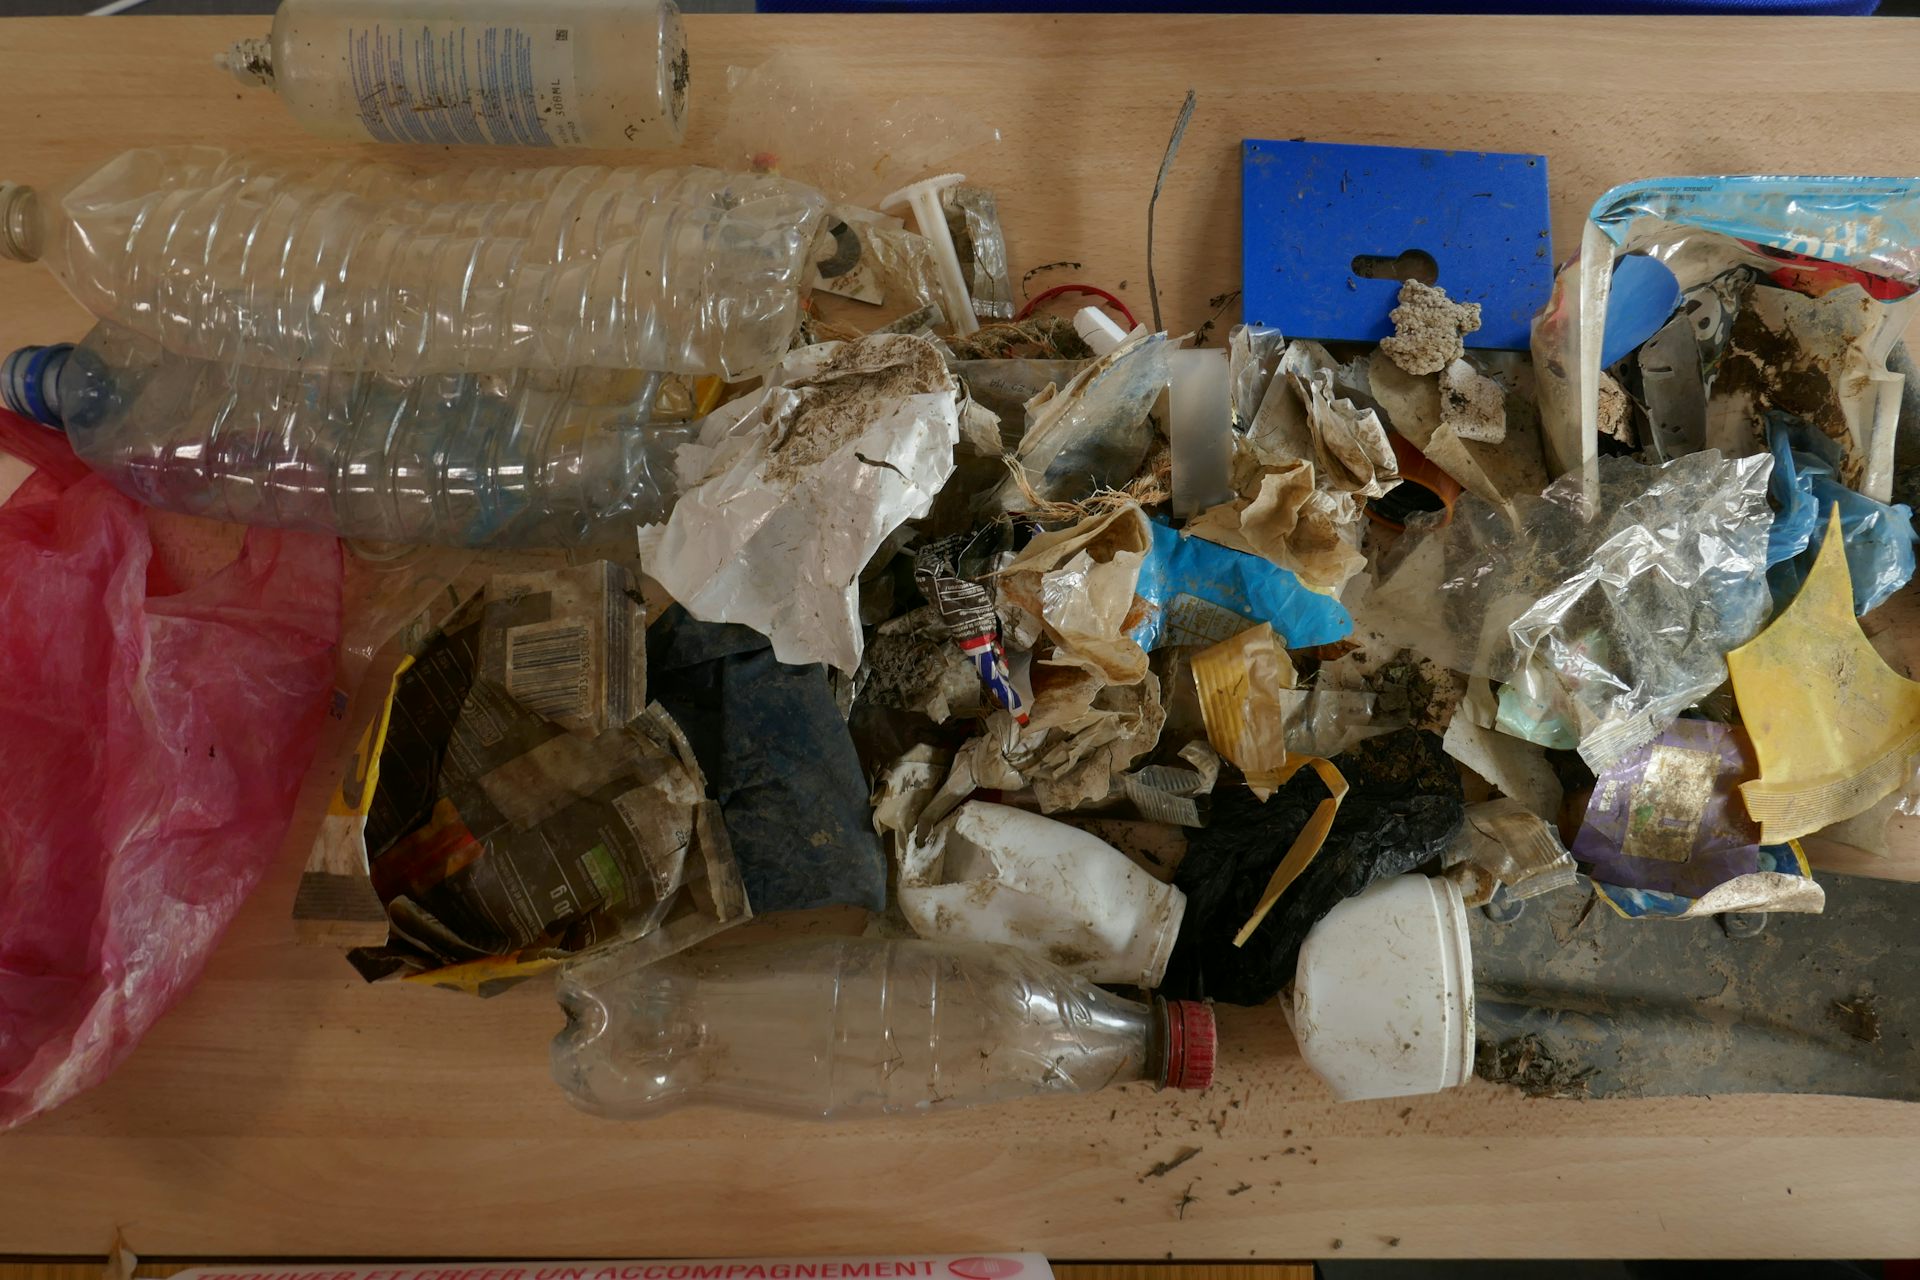
The third bit is we want to raise money for our three charities: diabetes, cancer research and a little local one called the Final Straw, which looks at reducing plastic waste out at sea.
MH: What all does your physical training entail?
JH: We've had quite a number of weekends on the water.
We all live in slightly different areas of the UK.
And we'd meet at our our boat, which is now on its way over to the Canary Islands in a shipment container.
We've had our boat on the south coast, so we all meet there, train all weekend, and go back to work the next week.
So we sort of fit many weekends in like that, which has been great to be able to get on the water.
We've done that for about 18 months now.
We each have a specific training program which has been building up, really, since January this year.
They're designed for flexibility, strength, and endurance.
Some of it is pretty tough.
When you have to fit in a two and a half hour row as well as a day's work, it's quite a lot to fit in.
That's part of the challenge in testing our bodies.
It's been great to be able to push ourselves and to know that anything is still possible.
We've been fortunate enough to have had our boat for 18 months to train on it.
There's some very tiny little cabins at either end, and all navigation and electronics [equipment] is in one of those cabins.
When the weather's really, really bad, we put out something called a power anchor, which is basically like a big parachute to stabilize the boat.
And we literally just have to get in our cabins, close the doors, and ride it out.
We expect to hit those sort of storms at certain times.
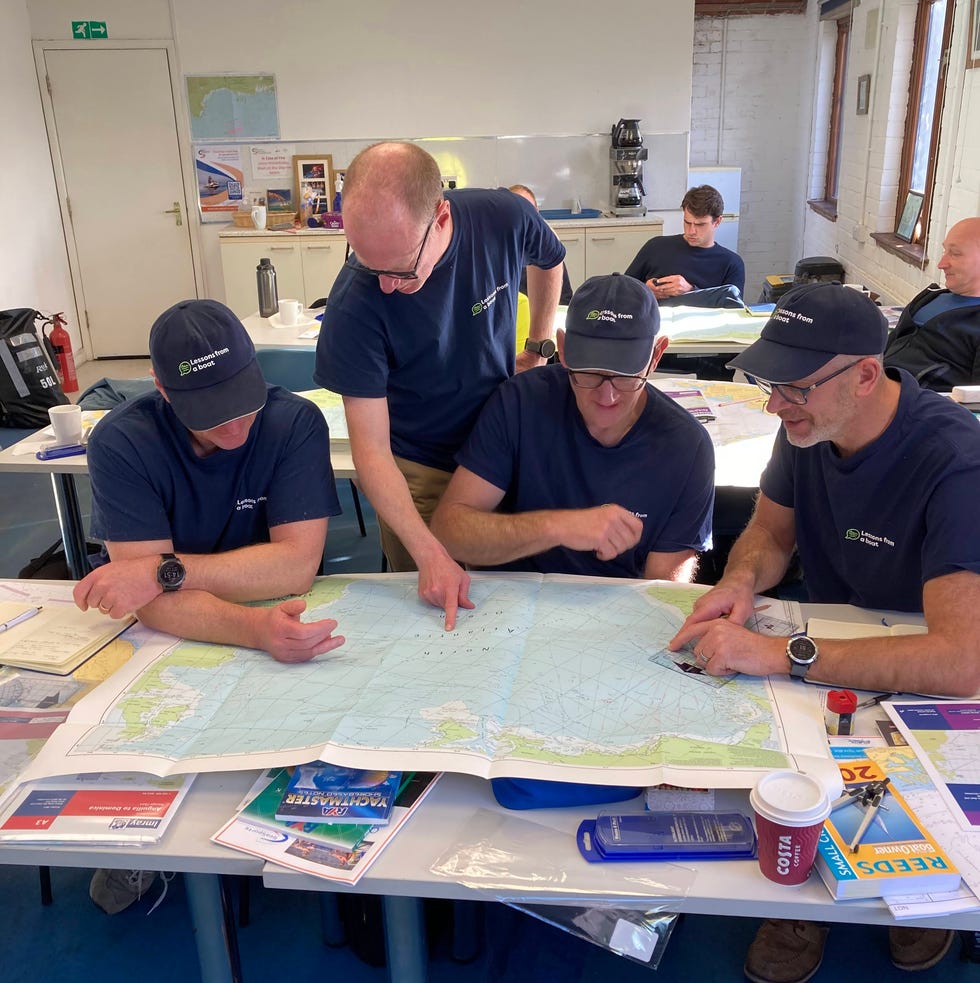
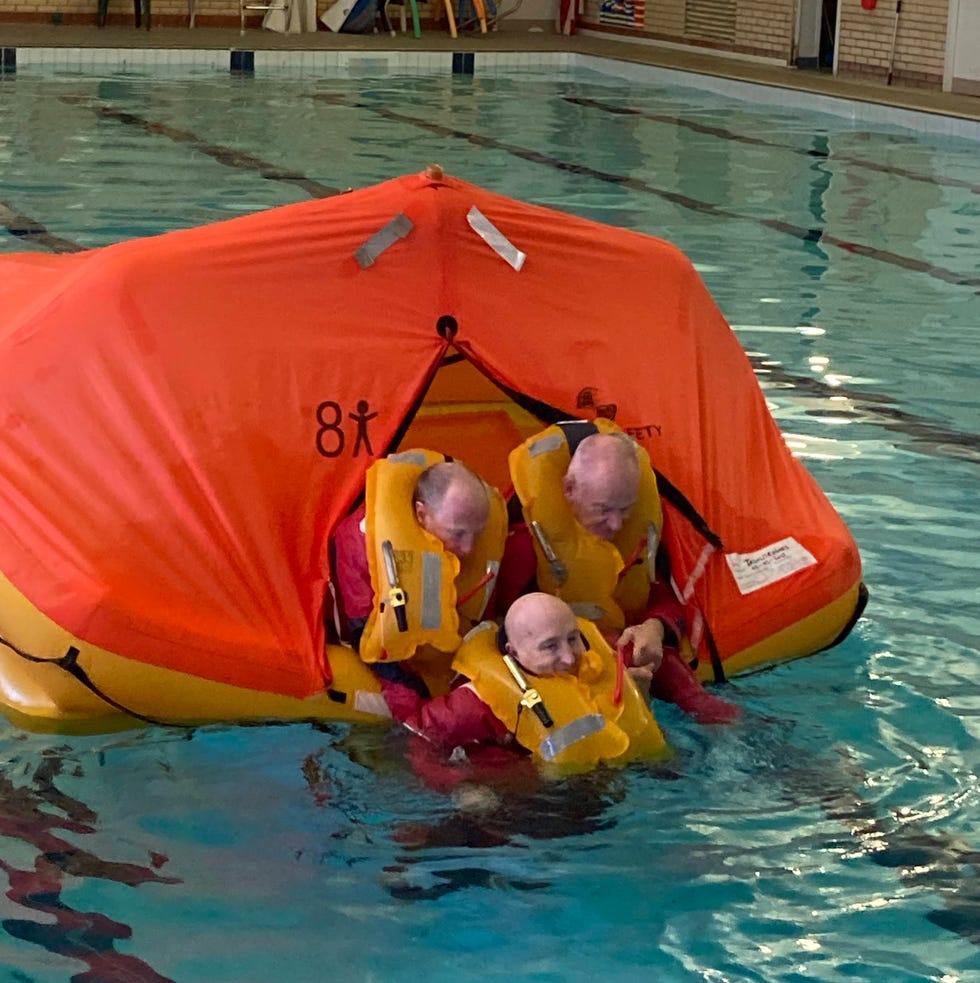
We've all had to do competencies in navigation, sea survival, that sort of stuff.
Courtesy Subjects
MH: Has your diet changed at all?
JH: We've been wearing Lingo [continuous glucose monitor] biosensors since January, so 11 months.
They're one of our sponsors.
Part of that is to help steer us and guide us with our performance and nutrition.
It's helped in terms of timing what to eat and when, to support our training.
We're going to be wearing the sensors for the duration of the event, too, and it'll be really interesting to see the data that comes back from that.
We'll need to eat about 5,500 calories a day, and we're going to certainly be eating a lot more in the way of carbohydrates than we are now.
If we're doing two hours [rowing] two hours [rest] for those 50 days, it's going to be an interesting thing to have a look at the pattern that develops.
Obviously, our food while we're away is very different.
It's all expedition rations, you know.
We've got a jet boiler, which boils us up some hot water on the boat, which we add to the rations.
And that's it, really.
MH: What are you doing to prepare mentally?
SP: We've all talked about things that we're most worried about, risk, etc.
But we are also working with a university sport science department, so we've got four sessions coming up with a sports psychologist, which will help.
JH: We've decided that we want to enjoy this event.
We also realize we're going to hit some dark spots, and that's part of it.
It's 50 days where we don't see anything but sea and we're going to have our highs and lows.
If we hit a storm, if we hit 60 foot waves—which we will—we [might] get thrown out of the boat repeatedly.
And I'm sure we're going to deal with fatigue and sleep deprivation, and we're gonna find it very hard mentally.
Even the smallest things will start to annoy us.
But we're all good friends, and we know each other well.
We're all sensible, and we don't panic too much.
I think we're all fairly level headed.
We've planned to have a 10 to 15 minute break every day to actually sit down and just chat amongst ourselves about what our concerns are, what's pissing us off.
We have to clear the air, no matter how big or small it is.
Part of the the learning and part of the event is actually supporting each other.
We've got to be able to perform.
We've got to keep the boat moving.
And we're not the oldest crew, potentially.
But, I think our combined ages are certainly over 220 years.
So we're getting on a bit.
There are some young guns out there, and we hope to be able to put a good performance in.
SH: I think mentally, Jason, we're going to be far better prepared than the youngsters.
JH: [Laughs]
MH: What are you most nervous for? Most excited for?
JH: One of the things is the weather.
I think the daunting thing is, when you first get hit by a big storm, figuring out what it's going to feel like.
We know the boat can survive.
Our boat has done three trips already.
It's a good, robust boat in the big waves.
I think that'll be exciting once we get used to it.
But the big waves will be quite terrifying, I'm sure, to start with.
From a fitness perspective, I think we're ready.
I think we'll cope, you know.
Our bodies will cope.
Courtesy Subjects
I think we're most excited to start, really.
I think we're all ready.
The [island] where we set sail from is the hub of the World's Toughest Row.
It's a really exciting place.
There's a good vibe.
It's a nice atmosphere.
All the crews really sort of gel together so that'll be fun.
That's something we look forward to.
And of course, all of us have been quite careful with our diet and our training, so I think that first beer when we get to Antigua will certainly be high on the agenda.
The message for us is the thing.
All the sponsorship has been a big thing for us to be able to get everything together, all the equipment costs, everything that's that's needed for the event.
Now for us, it's basically creating much as much awareness as we possibly can for our charities.
Diabetes is a personal one for me, because my son's Type 1 diabetic, and he's really been helped with sensor technology.
And, obviously that's not available to everybody.
We've all been touched by friends and family with cancer.
We want to see a legacy with our event.


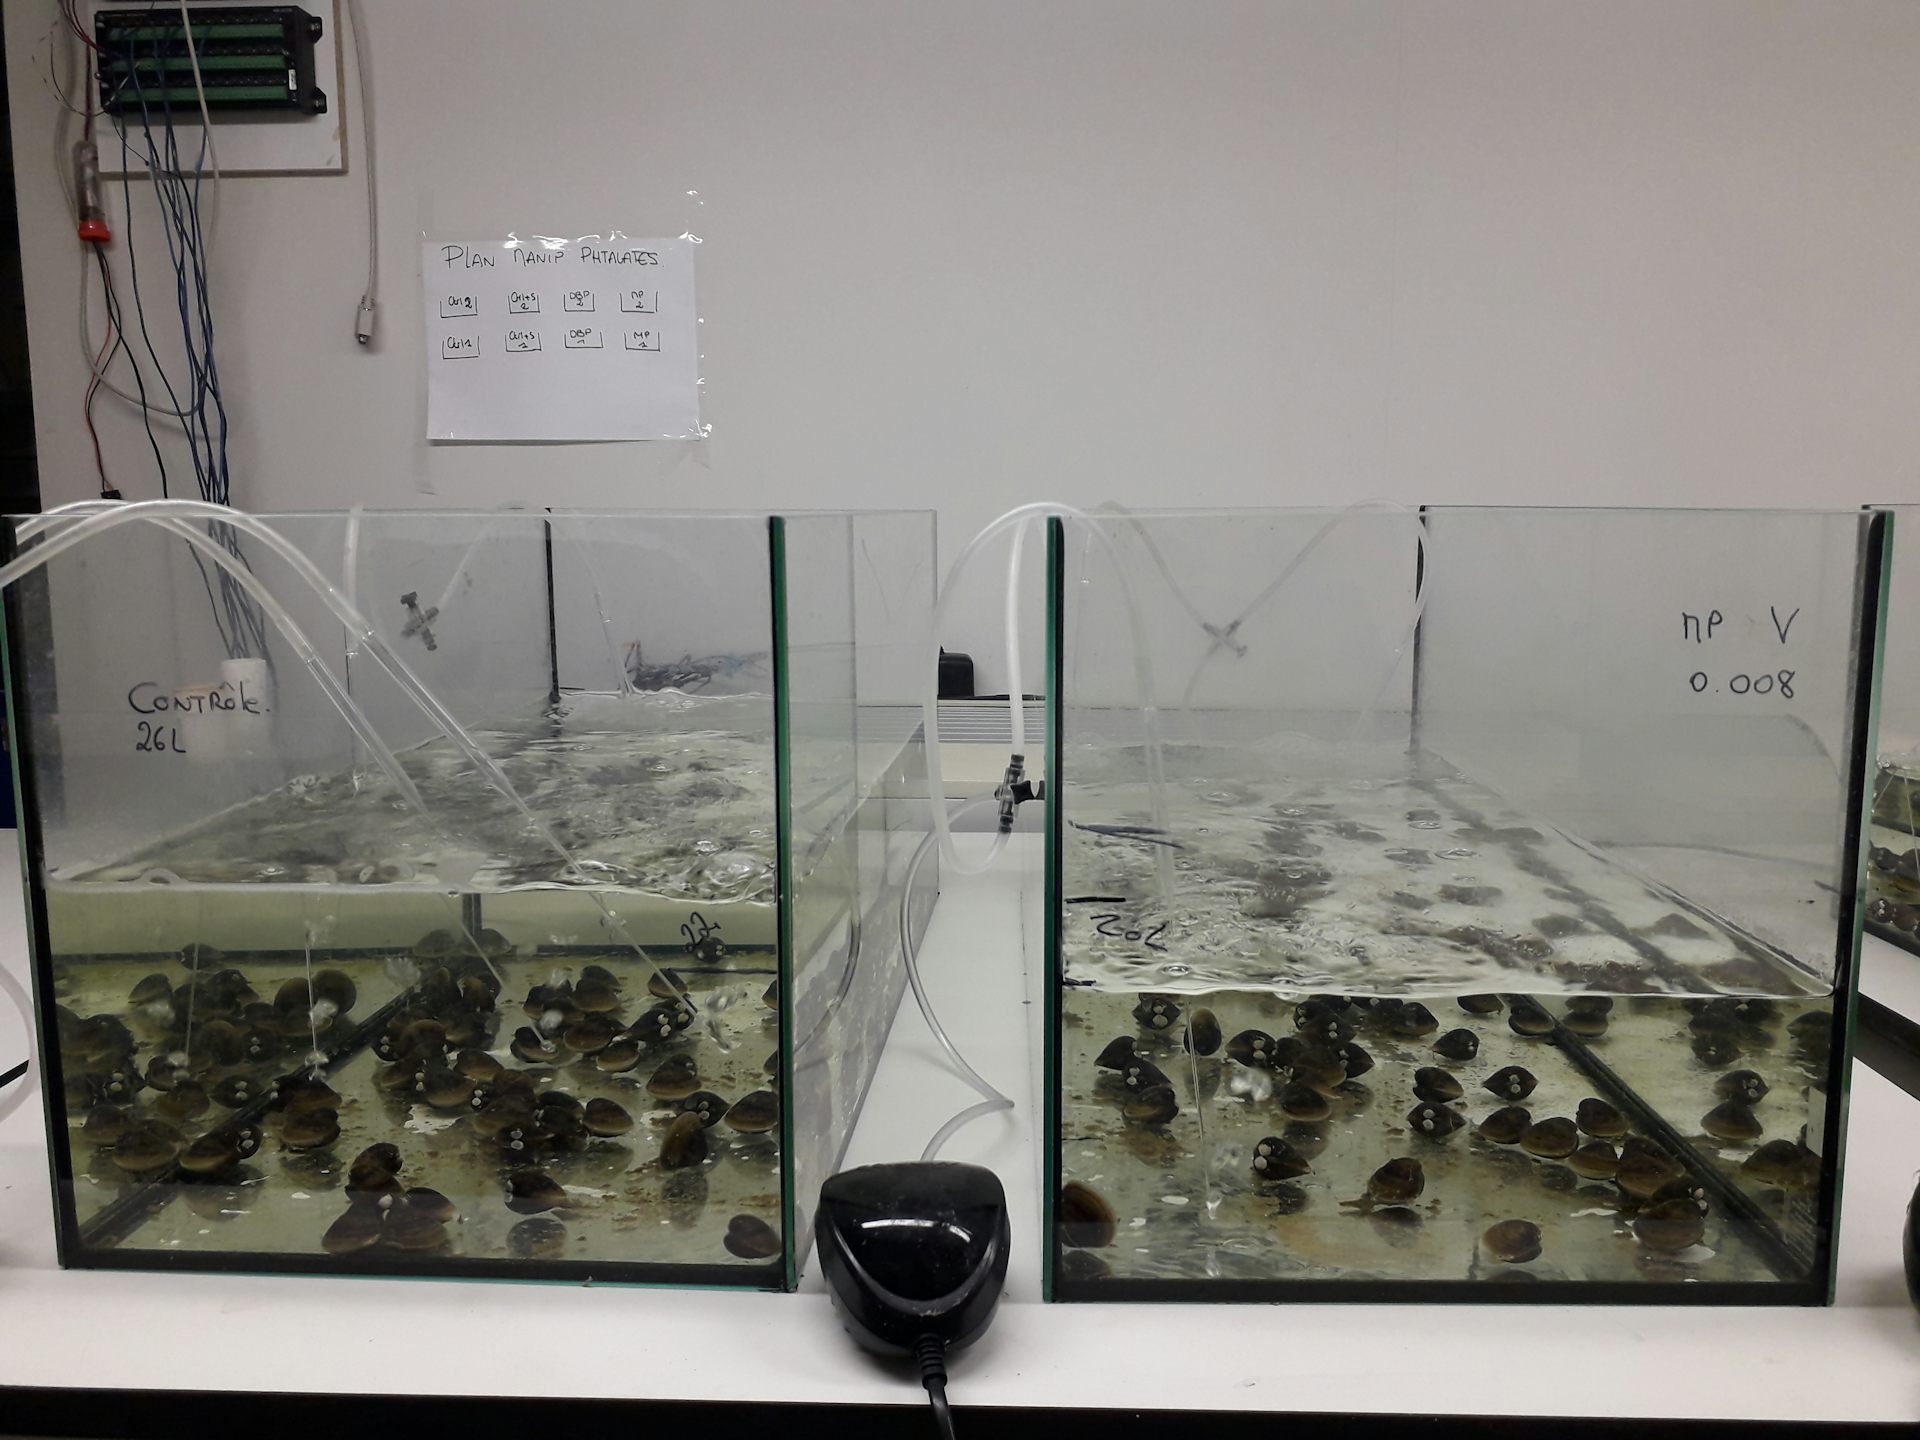
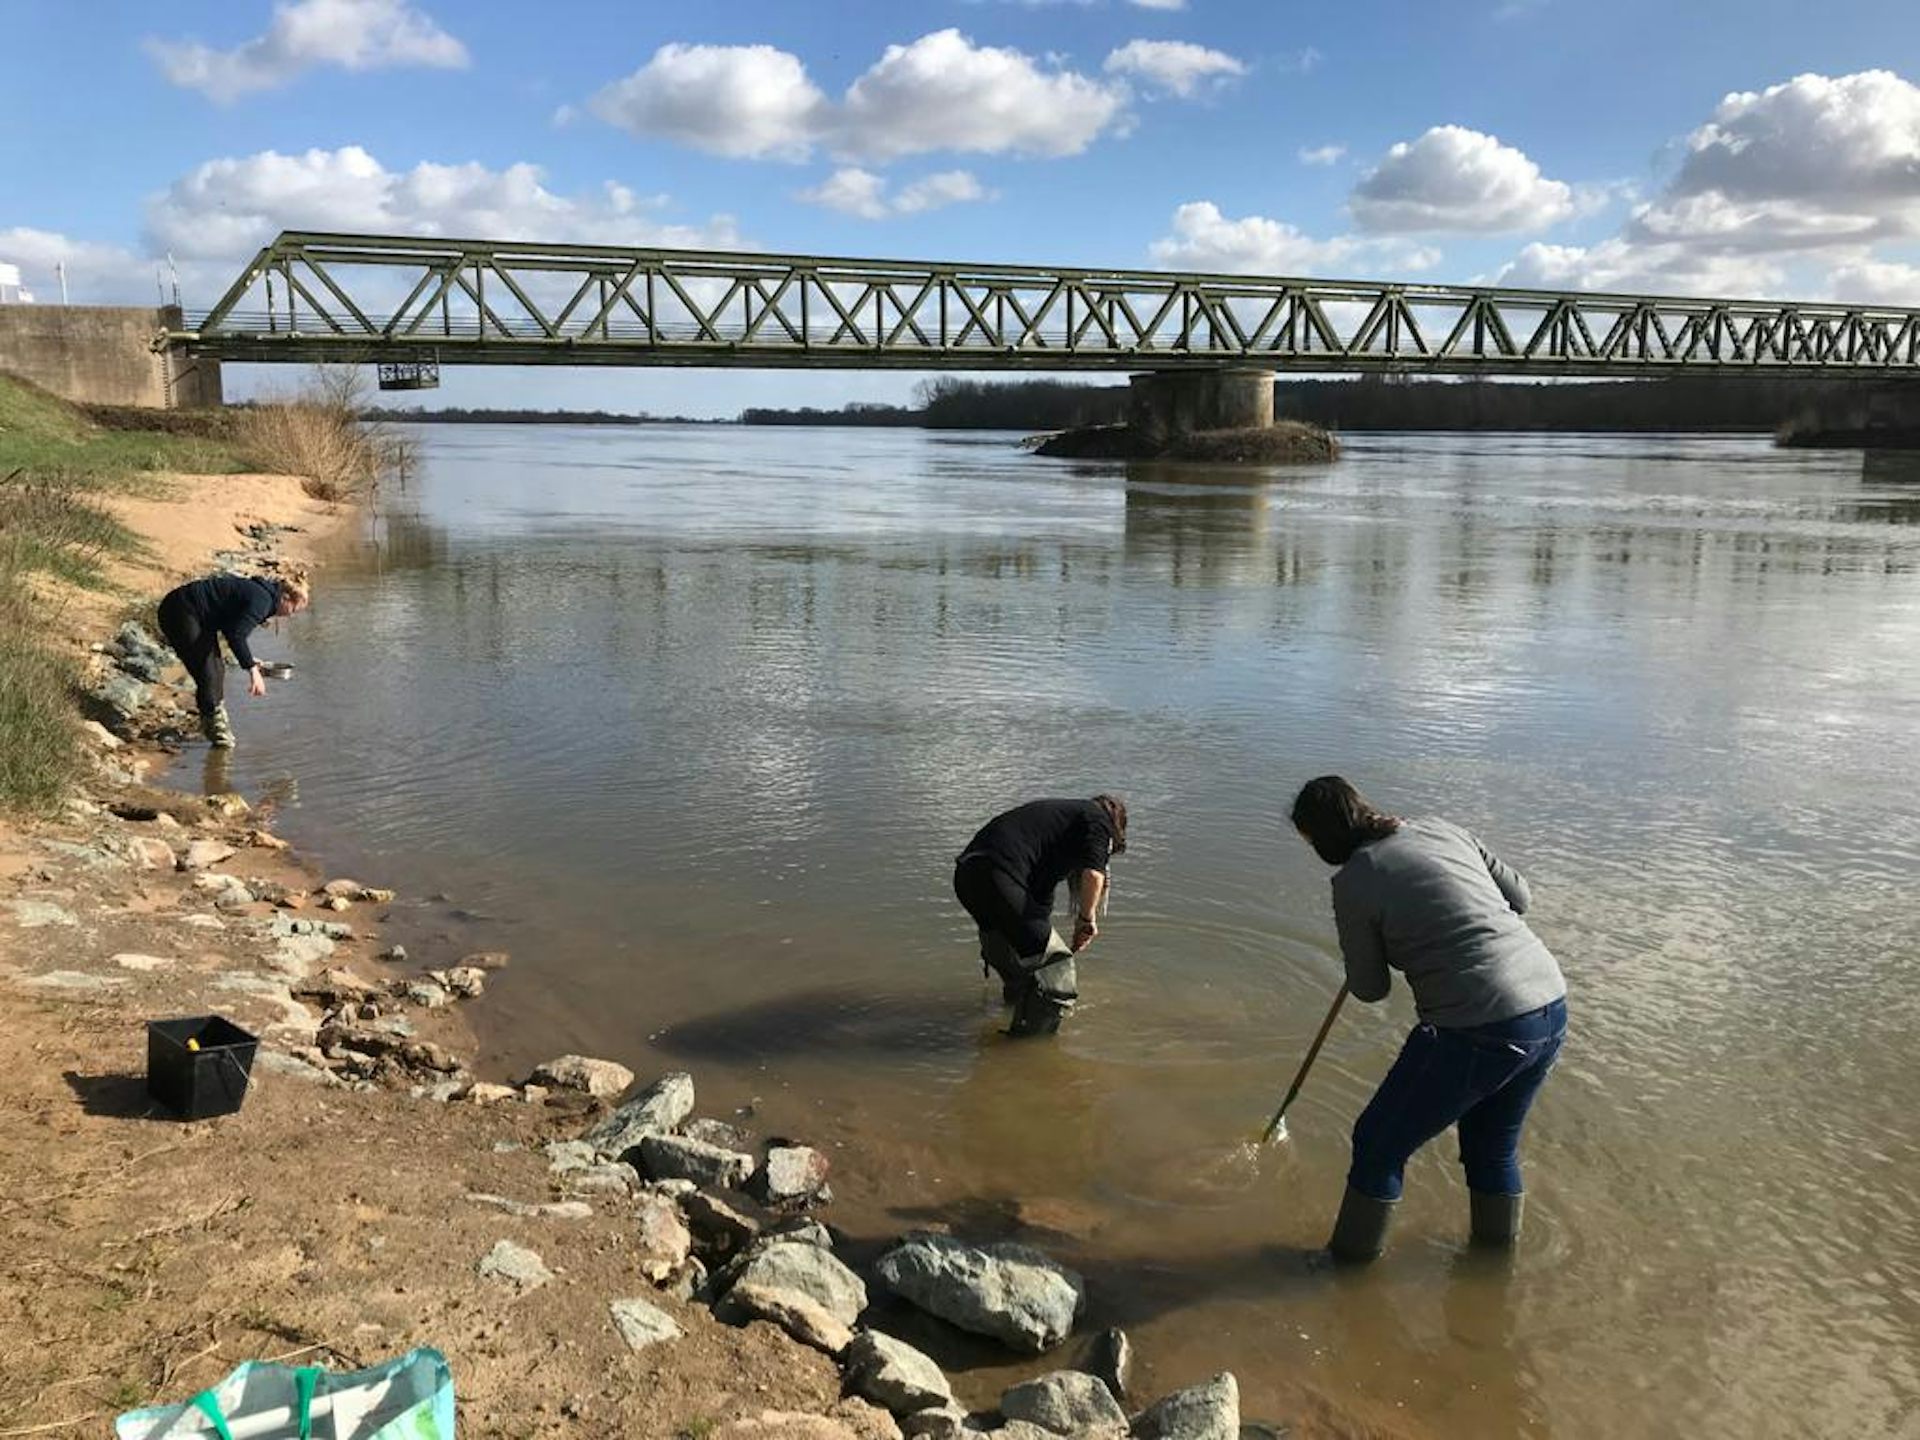 A sampling of the freshwater invertebrates C. fluminea in the Loire river.
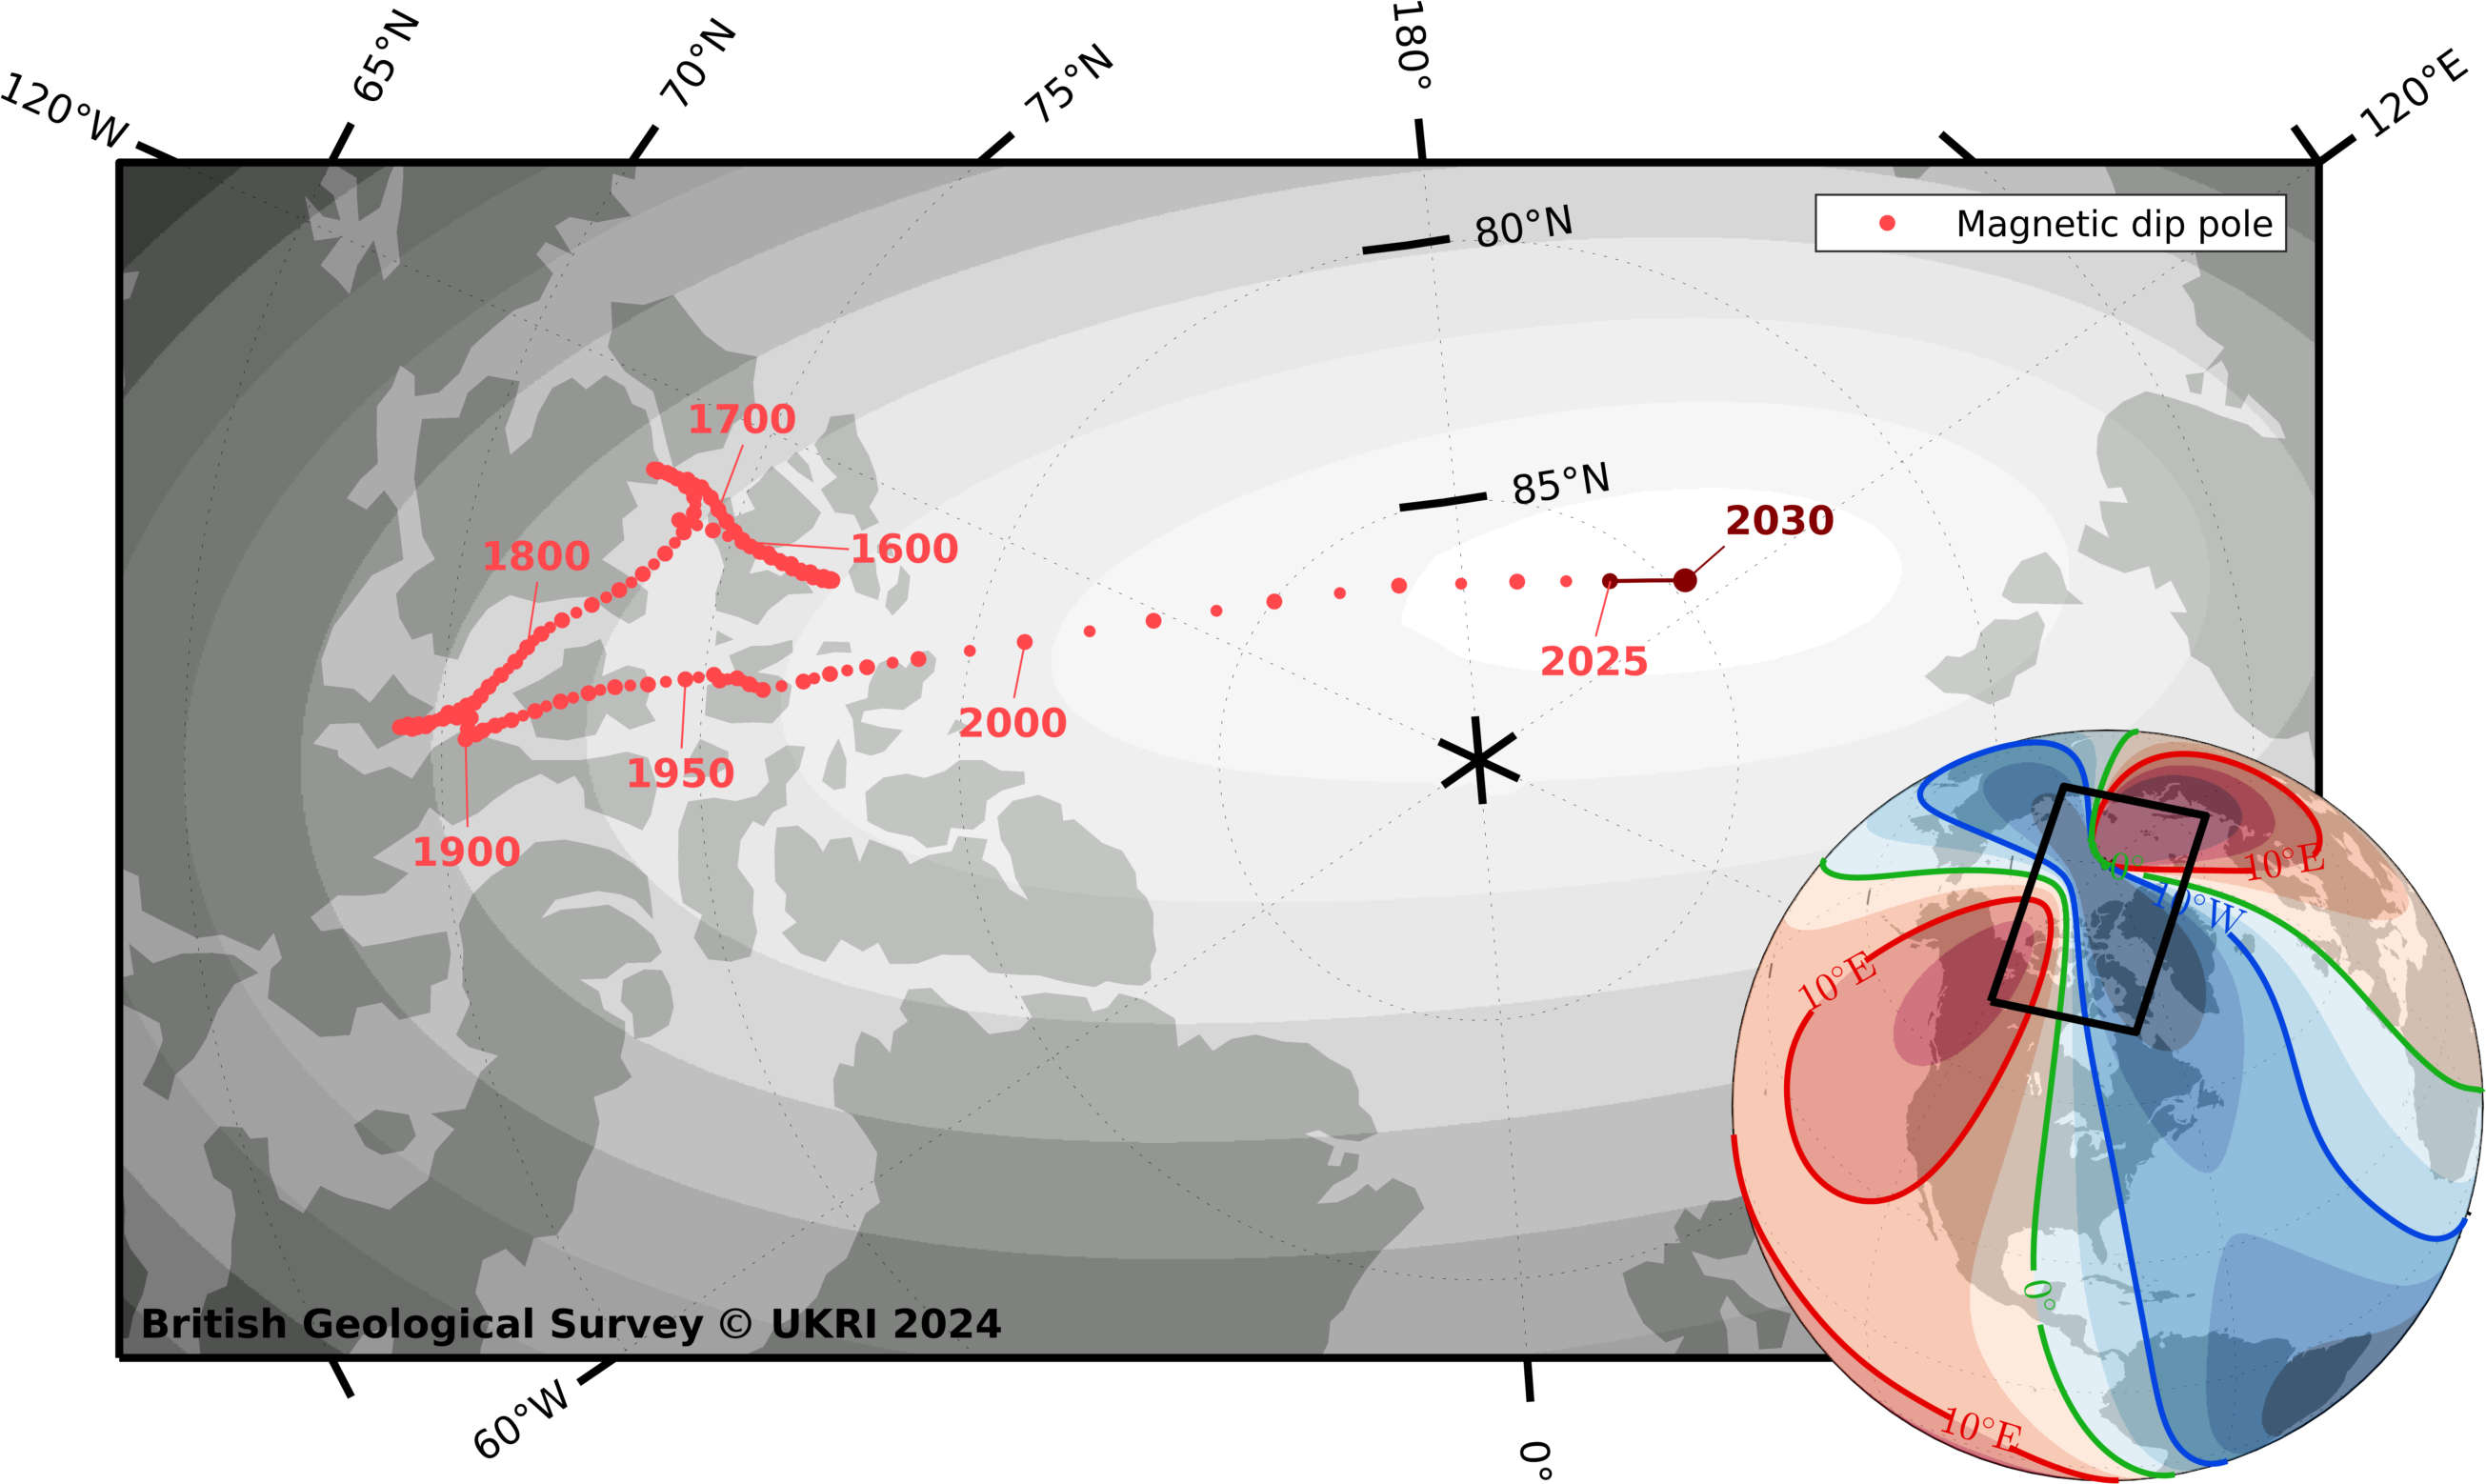
 Magnetic declination (the angle between magnetic and geographic north) in 2025 according to

 Australian sea lion by John Turnbull via