NTSB contracted for a dynamic motion analysis of El Faro, which also used the post-storm weather analysis model for wind and sea inputs.
This video shows the results of simulations with El Faro underway at about 17 knots, at 3:30
on the morning of the sinking.
The ship has a 4-degree list... similar
to the windheel calculated from the beam wind at the time.
Please note
that the vessel motions match the models' output data, but waves are not
accurately reflected.
From WorkBoat by Joel Milton
The National Transportation Safety Board, NTSB, has released their final report on the sinking of the El Faro cargo ship.
In its final report into the disaster, the NTSB said the Captain’s decisions and TOTE’s poor oversight and inadequate safety management system led to the sinking, the deadliest shipping disaster involving a U.S.-flagged vessel in more than 30 years.
In its final report into the disaster, the NTSB said the Captain’s decisions and TOTE’s poor oversight and inadequate safety management system led to the sinking, the deadliest shipping disaster involving a U.S.-flagged vessel in more than 30 years.
The
summary includes detailed pictures and even an artist rendering of what
the ship may look like sitting 3 miles below sea level on the ocean
floor.
All 33 crew members perished in the accident on October 1, 2015.
The 790-foot ship went down 430 miles southeast of Miami during Hurricane Joaquin, a category 3 storm.
All 33 crew members perished in the accident on October 1, 2015.
The 790-foot ship went down 430 miles southeast of Miami during Hurricane Joaquin, a category 3 storm.
It’s not a pretty picture, no matter what angle you view it from.
The findings from the U.S. Coast Guard and the National Transportation Safety Board after concluding their separate investigations of the now infamous sinking of the 790′ El Faroin the Bahamas on Oct. 1, 2015, are sobering stuff.
In spite of the fact that various parties representing various interests will continue to dispute portions of the Coast Guard and NTSB reports, the many failures and shortcomings that led to the disaster leave no one untouched.
Sinking of US Cargo Vessel SS El Far near Acklins and Crooked Island Bahamas October1, 2015 This two-dimensional animation reconstructs the sequence of events leading to the sinking of the US-flagged cargo vessel SS El Faro in the Atlantic Ocean near Acklins and Crooked Island, Bahamas, which occurred on the morning of October 1, 2015.
The animation displays the position of El Faro as a yellow circle, and a solid white line indicates the track path of the vessel.
During the animation, the planned course and proposed course changes for El Faro are shown as dotted white lines.
The Voyage Data Recorder (VDR) was recovered on August 8, 2016. The VDR retained the last 26 hours of conversation on the bridge and vessel operating data.
Data from the VDR were used to determine the position and heading of the accident vessel.
The bridge audio from the VDR was also used in reconstructing the sequence of events in the accident.
The animation does not depict visibility conditions at the time of the accident.
The animation includes audio narration, and the script of the narration is appended to this description/disclaimer.
The animation begins with an overall map of the area between Jacksonville, Florida and San Juan, Puerto Rico.
An inset photograph of the fully loaded El Faro is shown in the upper right side of the screen, and the typical course from Jacksonville to San Juan traveling to the east of the Bahama Islands is depicted.
An inset photograph shows the VDR in its position on El Faro before the voyage; the inset transitions to a photograph of the VDR in its location on the bottom of the ocean before it was recovered.
An arrow indicating north, and a scale are shown in the lower left side of the screen.
The departure of the El Faro on September 29, 2015 at 9:48 pm Easter Daylight Time (EDT) is indicated, along with the position and development of Hurricane Joaquin from a tropical depression through a tropical storm to a hurricane.
A series of predicted storm tracks are animated, indicating that the storm was consistently predicted to move southwest, then turn north.
The National Hurricane Center’s Best Track (the actual track calculated after the accident) is also shown.
The date and time in EDT of selected events are displayed on the lower left side of the screen, as they are depicted or when mentioned in the narration.
The sequence of events starts at 5:36 am EDT on September 30 with the earliest information available from the VDR.
The position of El Faro is shown along with the predicted storm tracks from Bon Voyage System (BVS) and from the National Hurricane Center Sat-C, plus the National Hurricane Center Best Track.
The hurricane position is interpolated on the BVS or Sat-C tracks to indicate where the hurricane would have been expected to be at any time.
The BVS information is shown in blue, the Sat-C information is shown in red and the National Hurricane Center Best Track is shown in black.
Beginning at 2:30 pm EDT on September 30, the animation changes to a closer view including the islands in the Bahamas, with the islands of San Salvador, Rum Cay and Samana Cay identified with text labels.
The Old Bahama Channel north of Cuba is also labeled with text. Beginning at 12:00 am EDT on October 1, the animation changes to a closer view centered on San Salvador, Rum Cay and Samana Cay, which are identified with text labels.
The Old Bahama Channel north of Cuba is again labeled with text.
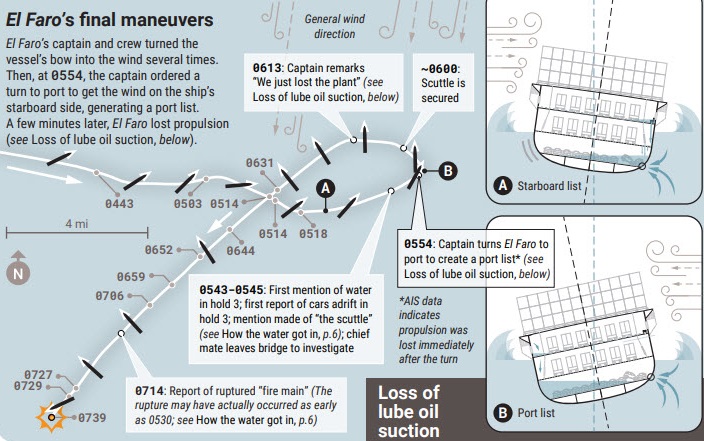
An inset photograph looking at the aft and starboard side of El Faro is shown, superimposed with twelve white ovals to indicate the openings in the hull that would have allowed water to enter the second deck of the vessel.
Beginning at 5:43 am EDT on October 1, the animation changes to closer view showing the position, heading and track path of El Faro, along with Samana Cay identified with a text label.
The vessel is shown 30 times actual size.
Selected summarized or paraphrased comments from the bridge audio from the VDR are displayed as text along with the time in EDT at the time they occurred.
The center of the hurricane along the National Hurricane Center Best Track is shown, along with the wind circulation directions.
An inset photograph illustrates a scuttle from El Faro.
An inset graphic indicates the listing of the ship to starboard or to port, as reported in the narration. The animation is followed by an underwater photo of the stern of El Faro resting on the seafloor.
The animation displays the position of El Faro as a yellow circle, and a solid white line indicates the track path of the vessel.
During the animation, the planned course and proposed course changes for El Faro are shown as dotted white lines.
The Voyage Data Recorder (VDR) was recovered on August 8, 2016. The VDR retained the last 26 hours of conversation on the bridge and vessel operating data.
Data from the VDR were used to determine the position and heading of the accident vessel.
The bridge audio from the VDR was also used in reconstructing the sequence of events in the accident.
The animation does not depict visibility conditions at the time of the accident.
The animation includes audio narration, and the script of the narration is appended to this description/disclaimer.
The animation begins with an overall map of the area between Jacksonville, Florida and San Juan, Puerto Rico.
An inset photograph of the fully loaded El Faro is shown in the upper right side of the screen, and the typical course from Jacksonville to San Juan traveling to the east of the Bahama Islands is depicted.
An inset photograph shows the VDR in its position on El Faro before the voyage; the inset transitions to a photograph of the VDR in its location on the bottom of the ocean before it was recovered.
An arrow indicating north, and a scale are shown in the lower left side of the screen.
The departure of the El Faro on September 29, 2015 at 9:48 pm Easter Daylight Time (EDT) is indicated, along with the position and development of Hurricane Joaquin from a tropical depression through a tropical storm to a hurricane.
A series of predicted storm tracks are animated, indicating that the storm was consistently predicted to move southwest, then turn north.
The National Hurricane Center’s Best Track (the actual track calculated after the accident) is also shown.
The date and time in EDT of selected events are displayed on the lower left side of the screen, as they are depicted or when mentioned in the narration.
The sequence of events starts at 5:36 am EDT on September 30 with the earliest information available from the VDR.
The position of El Faro is shown along with the predicted storm tracks from Bon Voyage System (BVS) and from the National Hurricane Center Sat-C, plus the National Hurricane Center Best Track.
The hurricane position is interpolated on the BVS or Sat-C tracks to indicate where the hurricane would have been expected to be at any time.
The BVS information is shown in blue, the Sat-C information is shown in red and the National Hurricane Center Best Track is shown in black.
Beginning at 2:30 pm EDT on September 30, the animation changes to a closer view including the islands in the Bahamas, with the islands of San Salvador, Rum Cay and Samana Cay identified with text labels.
The Old Bahama Channel north of Cuba is also labeled with text. Beginning at 12:00 am EDT on October 1, the animation changes to a closer view centered on San Salvador, Rum Cay and Samana Cay, which are identified with text labels.
The Old Bahama Channel north of Cuba is again labeled with text.
An inset photograph looking at the aft and starboard side of El Faro is shown, superimposed with twelve white ovals to indicate the openings in the hull that would have allowed water to enter the second deck of the vessel.
Beginning at 5:43 am EDT on October 1, the animation changes to closer view showing the position, heading and track path of El Faro, along with Samana Cay identified with a text label.
The vessel is shown 30 times actual size.
Selected summarized or paraphrased comments from the bridge audio from the VDR are displayed as text along with the time in EDT at the time they occurred.
The center of the hurricane along the National Hurricane Center Best Track is shown, along with the wind circulation directions.
An inset photograph illustrates a scuttle from El Faro.
An inset graphic indicates the listing of the ship to starboard or to port, as reported in the narration. The animation is followed by an underwater photo of the stern of El Faro resting on the seafloor.
Poor situational awareness, aided and abetted by inadequate professional training, an ineffective safety culture afloat and ashore, and an unwillingness to consider worst-case scenarios and possible alternatives to avoid them, led directly to a series of clearly bad operational decisions.
But these decisions did not occur in a vacuum.
A complete lack of checks and balances, both on the water and ashore, resulted in the voyage gradually snowballing into a mass-fatality disaster.
Insufficient safety support and oversight from every level — corporate, regulatory, etc. — laid the foundation for it all to unravel, resulting in the deaths of 33 crewmembers for no good reason at all.
courtesy of Maritime Executive
“We may never understand why the captain failed to heed his crew’s concerns about sailing into the path of a hurricane, or why he refused to chart a safer course away from such dangerous weather,” said NTSB Chairman Robert L. Sumwalt.
“But we know all too well the devastating consequences of those decisions.”
There is much to think about, but I’ll point first to remarks made by NTSB Chairman Robert Sumwalt at one of the hearings in Washington, D.C. Referring to the El Faro’s captain, Michael Davidson, he said, he “had a mental model that the hurricane would be in one place, and based on that mental model and based on his previous experience he thought they were going to be OK.”
That mental model proved to be wrong, and with fatal consequences.
Since we all build mental models for everything we do (even if you’re unaware of it) and no one is immune from building a bad one, you might want to consider the serious ramifications of that fact.
As for the value of experience, consider this: Davidson’s previous experience did not help him and probably pushed him further into a corner from which there was no escape.
Links :
- Maritime executive : El Faro's Final Maneuvers Revisited
- NYPost : Why doomed freighter sailed right into a megastorm
- NY Times : A Disaster at Sea, Animated by 26 Hours of Black-Box Recordings
- The Boston Globe : How cheap is too cheap?
- The Day : George Foy’s new book details the tragic loss of El Faro to Hurricane Joaquin
- Seatrade Maritime : Book review: Into the Raging Sea
- GeoGarage blog : The last voyage of the SS El Faro / It's extremely rare for large ships like El Faro to ...
No comments:
Post a Comment