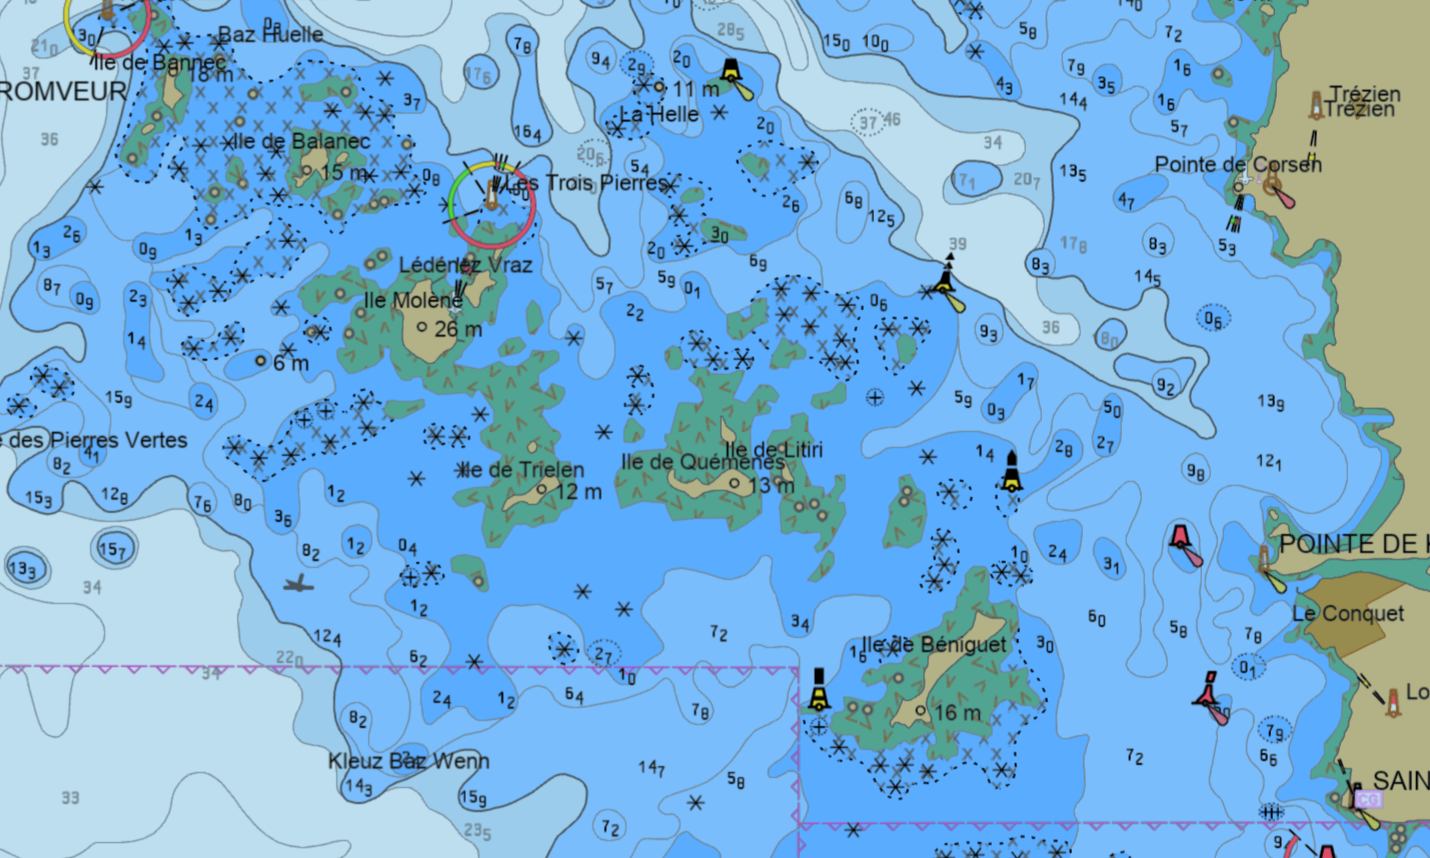
Figure 3: Very detailed bathymetric information on a Transit ENC (compilation scale 90,000) displayed on SEAiq Pilot.
The area is also covered by ENCs at compilation scales 45,000 and 22,000. (Image courtesy: Shom)
From Hydro by Christian Mouden, SHOM
Why the transition to S-101 is a unique review opportunity
Hydrographic offices (HOs) are preparing their transition into the new S-100 era.
Why the transition to S-101 is a unique review opportunity
Hydrographic offices (HOs) are preparing their transition into the new S-100 era.
This will require them to scheme different S-100 products that will be used in future ECDIS systems, set up the production, validation and distribution processes, train staff and so on.
The imminent transition from S-57 to S-101 offers a unique opportunity to review and optimize the content of nautical charts for modern navigation.
This article focuses on the use of electronic navigational charts (ENCs) in ECDIS systems, while recognizing the increasing use of ENCs on electronic chart systems (ECS) for non-SOLAS navigation.
For the past 30 years or so, mariners have been using official S-57 ENCs on their ECDIS systems, supporting safety of life at sea (SOLAS).
For the past 30 years or so, mariners have been using official S-57 ENCs on their ECDIS systems, supporting safety of life at sea (SOLAS).
The primary goal for HOs was to provide ENC coverage of the main maritime routes as quickly as possible.
That is why S-57 ENCs have almost always been produced by digitizing all the information on paper charts that formed national portfolios, with content dating back many decades or more.
While these ENCs were indeed new digital products, they were certainly not newly charted information (see Figure 1).
It was customary at the time to portray the maximum amount of information on the entire chart extent, and the content was designed with the sole purpose of being printed at certain scales and used accordingly by the mariner.
It was customary at the time to portray the maximum amount of information on the entire chart extent, and the content was designed with the sole purpose of being printed at certain scales and used accordingly by the mariner.
Obviously, it was not considered for use on an ECDIS. This ‘show all’ compilation method is defined as ‘full depiction’ in the International Hydrographic Organization (IHO) S-4 standard.
Full depiction is applied on the largest-scale charts, with the aim of showing as much information as space permits.
 Figure 1: Shom chart 6540 (published in 1970) and the equivalent ENC FR565400 displayed on SEAiq Pilot. (Image courtesy: Shom)
In reality, charted information (topographic features, bathymetric data, etc) varies considerably, not only from one HO to another but also over time within a single HO – and it can even depend on an individual cartographer’s interpretation.
The overall result can be very dense, with charts showing detail in areas where the mariner is not intended to navigate, or information of no benefit to navigation.
This often leads to ECDIS screen clutter. SCAMIN attribution, which is encoded on most of the ENC objects, is intended to optimize the display when the mariner zooms out by reducing clutter.
However, the current optional implementation by most HOs is not optimum and can certainly be improved.
The qualities of a good chart
In the case of the ENC specifically, being free of validation check errors (IHO S-58 standard) does not necessarily mean it is a high-quality product.
While S-58 validation checks ensure the digital product is consistent with the IHO ENC Product Specification, they do not consider the three basic qualities of a nautical chart:
1. It must be safe.
1. It must be safe.
This is the responsibility of the producing authority.
It is worth noting that safe does not mean, for instance, that the chart has been entirely compiled from recent surveys conducted with modern techniques.
Rather, it means that the overall charted features – including metadata on the quality of surveys (typically CATZOC attribute) or position accuracy attribute POSACC – provide the mariners with ad-hoc information so that they can appreciate the accuracy of the depth information in any area and adjust their routes and ECDIS look-ahead settings accordingly.
2. It must meet user requirements.
2. It must meet user requirements.
This means that the chart content is optimized with regard to the navigational purpose and the complexity of the area.
The chart content must also be adjusted depending on the possible existence of larger-scale charts in the area.
3. It must be easy to read.
3. It must be easy to read.
This quality is sometimes overlooked.
The best illustration of this is probably the density of soundings, which is often very high, even in areas with a relatively regular seabed with few significant shoals.
When displayed on the ECDIS, this makes it difficult to distinguish the objects that are most helpful for navigation.
The situation often becomes critical when text is displayed; then, screen clutter reaches saturation point.
It is important that HOs avoid producing unnecessarily crowded charts, recognizing that mariners often do not fully understand the technical content of the charts.
It is important that HOs avoid producing unnecessarily crowded charts, recognizing that mariners often do not fully understand the technical content of the charts.
For example, S-4 standard includes some detailed charting rules that the mariner may be ignorant of. The recent merging of abbreviations for ‘Position Approximate’ and ‘Position Doubtful’ (PA/PD) offers a good example of how charts can be made easier to read for mariners. Keeping charts as simple as possible facilitates their task
Less information also significantly reduces the number of features in the ECDIS pick report.
More generalization for more efficiency
Generalization is the cartographic process used to produce a smaller-scale chart from a larger-scale one. Nautical chart generalization principles are described in the S-4 standard, which provides basic guidance to cartographers on the levels of detail to be retained according to the navigational purpose of the chart.
S-4 also mentions that some vessels might not carry all the largest-scale charts and may be forced by unplanned circumstances (e.g. bad weather) to approach the coast or shelter using a smaller-scale chart.
For this reason, according to S-4, omission of details on smaller scales should be considered carefully. Although this is valid for paper chart navigation, the situation is different for SOLAS vessels that have the capacity to acquire ENCs on demand.
Apart from the full depiction provided on larger-scale charts and the generalization that should be applied on smaller-scale ones, the S-4 standard also allows the use of minimal depiction.
Apart from the full depiction provided on larger-scale charts and the generalization that should be applied on smaller-scale ones, the S-4 standard also allows the use of minimal depiction.
This is an extreme case of generalization that omits most features in an area, even though space is available to show some of them.
This process could be used more frequently on small-scale ENCs in specific areas such as estuaries or harbours.
On current charts, generalization is often minimal; many small-scale charts show detailed information, even in areas that are covered by larger scales.
On current charts, generalization is often minimal; many small-scale charts show detailed information, even in areas that are covered by larger scales.
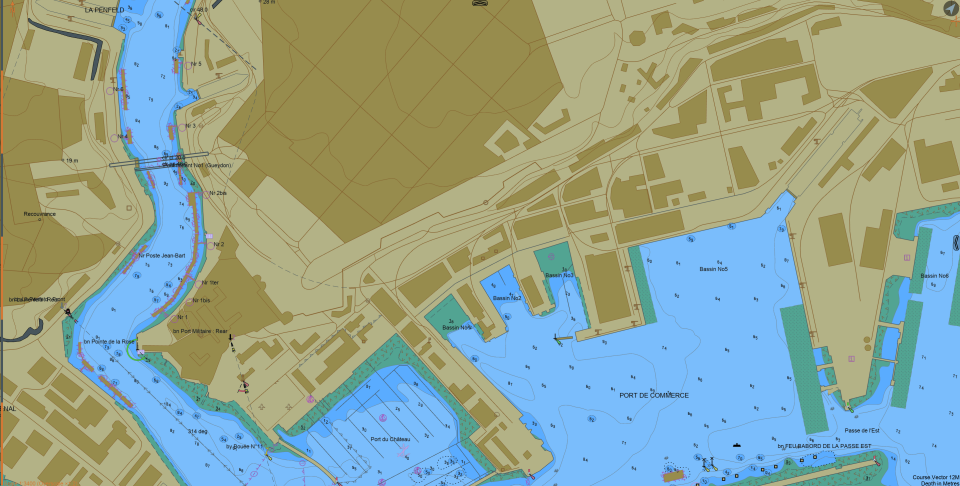
Is there a need to show detailed information close to the shore on a ENC for transit navigation? Minimal depiction areas should be preferred in such cases (see Figure 4).
This would make charts easier to read and would also reduce the volume of the digital files.
S-101: a unique opportunity
The transition to S-101 is challenge for data providers as they will have to convert their existing S-57 data (or rather S-57 database, in some cases) to S-101.
Although this conversion will be an automated process executed using mapping files, it will require a careful initial review and consolidation of existing data to minimize both potential conversion issues and post-conversion edits of S-101 data.
This necessary preparation can be a huge task, but it is also a unique and perfect opportunity to review chart content so that it completely fits the actual needs of modern navigation.
Apart from the general chart content described above, HOs can also take advantage of this opportunity to review their national portfolios, such as by:
Apart from the general chart content described above, HOs can also take advantage of this opportunity to review their national portfolios, such as by:
- optimizing the number of scales used
- reviewing the S-57 encoding to reduce the number of alarms on the ECDIS (this has been a constant complaint from mariners)
- encoding more depth contours than traditionally, especially in port areas where the seabed is not evolutive and where S-102 products (bathymetric surface) will not be necessary or available
- reviewing areas encoded with a CATZOC value ‘Unassessed’
- replacing qualitative accuracy attributes such as QUAPOS with quantitative attributes that can be used by the ECDIS look-ahead functionality
For HOs, this not only means a lighter workload for the conversion, validation and S-101 data post-conversion edits, but will also significantly reduce the necessary updates once the charts have been published.
Too heavy a task?
Hydrographic Offices may very well argue that the S-57 to S-101 conversion is already a challenge and that they do not have the resources to review their entire chart portfolio content.
This is only partly true.
Before changing the chart portfolio content, it will of course be necessary to define the new chart content.
Before changing the chart portfolio content, it will of course be necessary to define the new chart content.
Once these principles have been agreed, digital data and existing tools will allow a high level of automation.
It is possible to automate the reduction of sounding density, or remove specific features in selected areas, for instance. Ideally, this should be done before converting the data to S-101.
Nations with small ENC portfolios will be able to optimize their chart content ‘manually’.
Other producers can take advantage of existing tools to reduce the resources necessary to accomplish their chart modernization.
Conclusion
Although it may be out of scope for most hydrographic offices, they should at least consider rationalizing their nautical chart portfolio and content.
For HOs, this is a long-term investment to reduce their chart maintenance workload.
At this point in time, it is also a unique opportunity to ultimately better address mariners’ real-world challenges and provide them with all the data they need specifically and only the data they need, to ensure safe and easy navigation on their ECDIS or ECS.
There is no doubt they will be grateful when they experience the results.
No comments:
Post a Comment